×
模态框(Modal)标题
在这里添加一些文本
Close
Close
Submit
Cancel
Confirm
×
模态框(Modal)标题
×
Journal
Article
Figure
Search
EN
中文
Home
About Journal
About Journal
Indexed in
Awards
Editorial Board
Guide for Authors
Browse
Current Issue
Online First
Archive
Highlights
Topic
Archive by Subject
Most Viewed
Most Download
Most Cited
E-mail Alert
RSS
Subscribe
Advertisement
Contact us
EN
中文
Figure/Table detail
Land use change and its influencing factors along railways in Africa: A case study of the Ethiopian section of the Addis Ababa-Djibouti Railway
ZHAO Shengbo, QI Junheng, LI Dongxue, WANG Xingping
Journal of Geographical Sciences
, 2024, 34(
6
): 1128-1156. DOI:
10.1007/s11442-024-2242-y
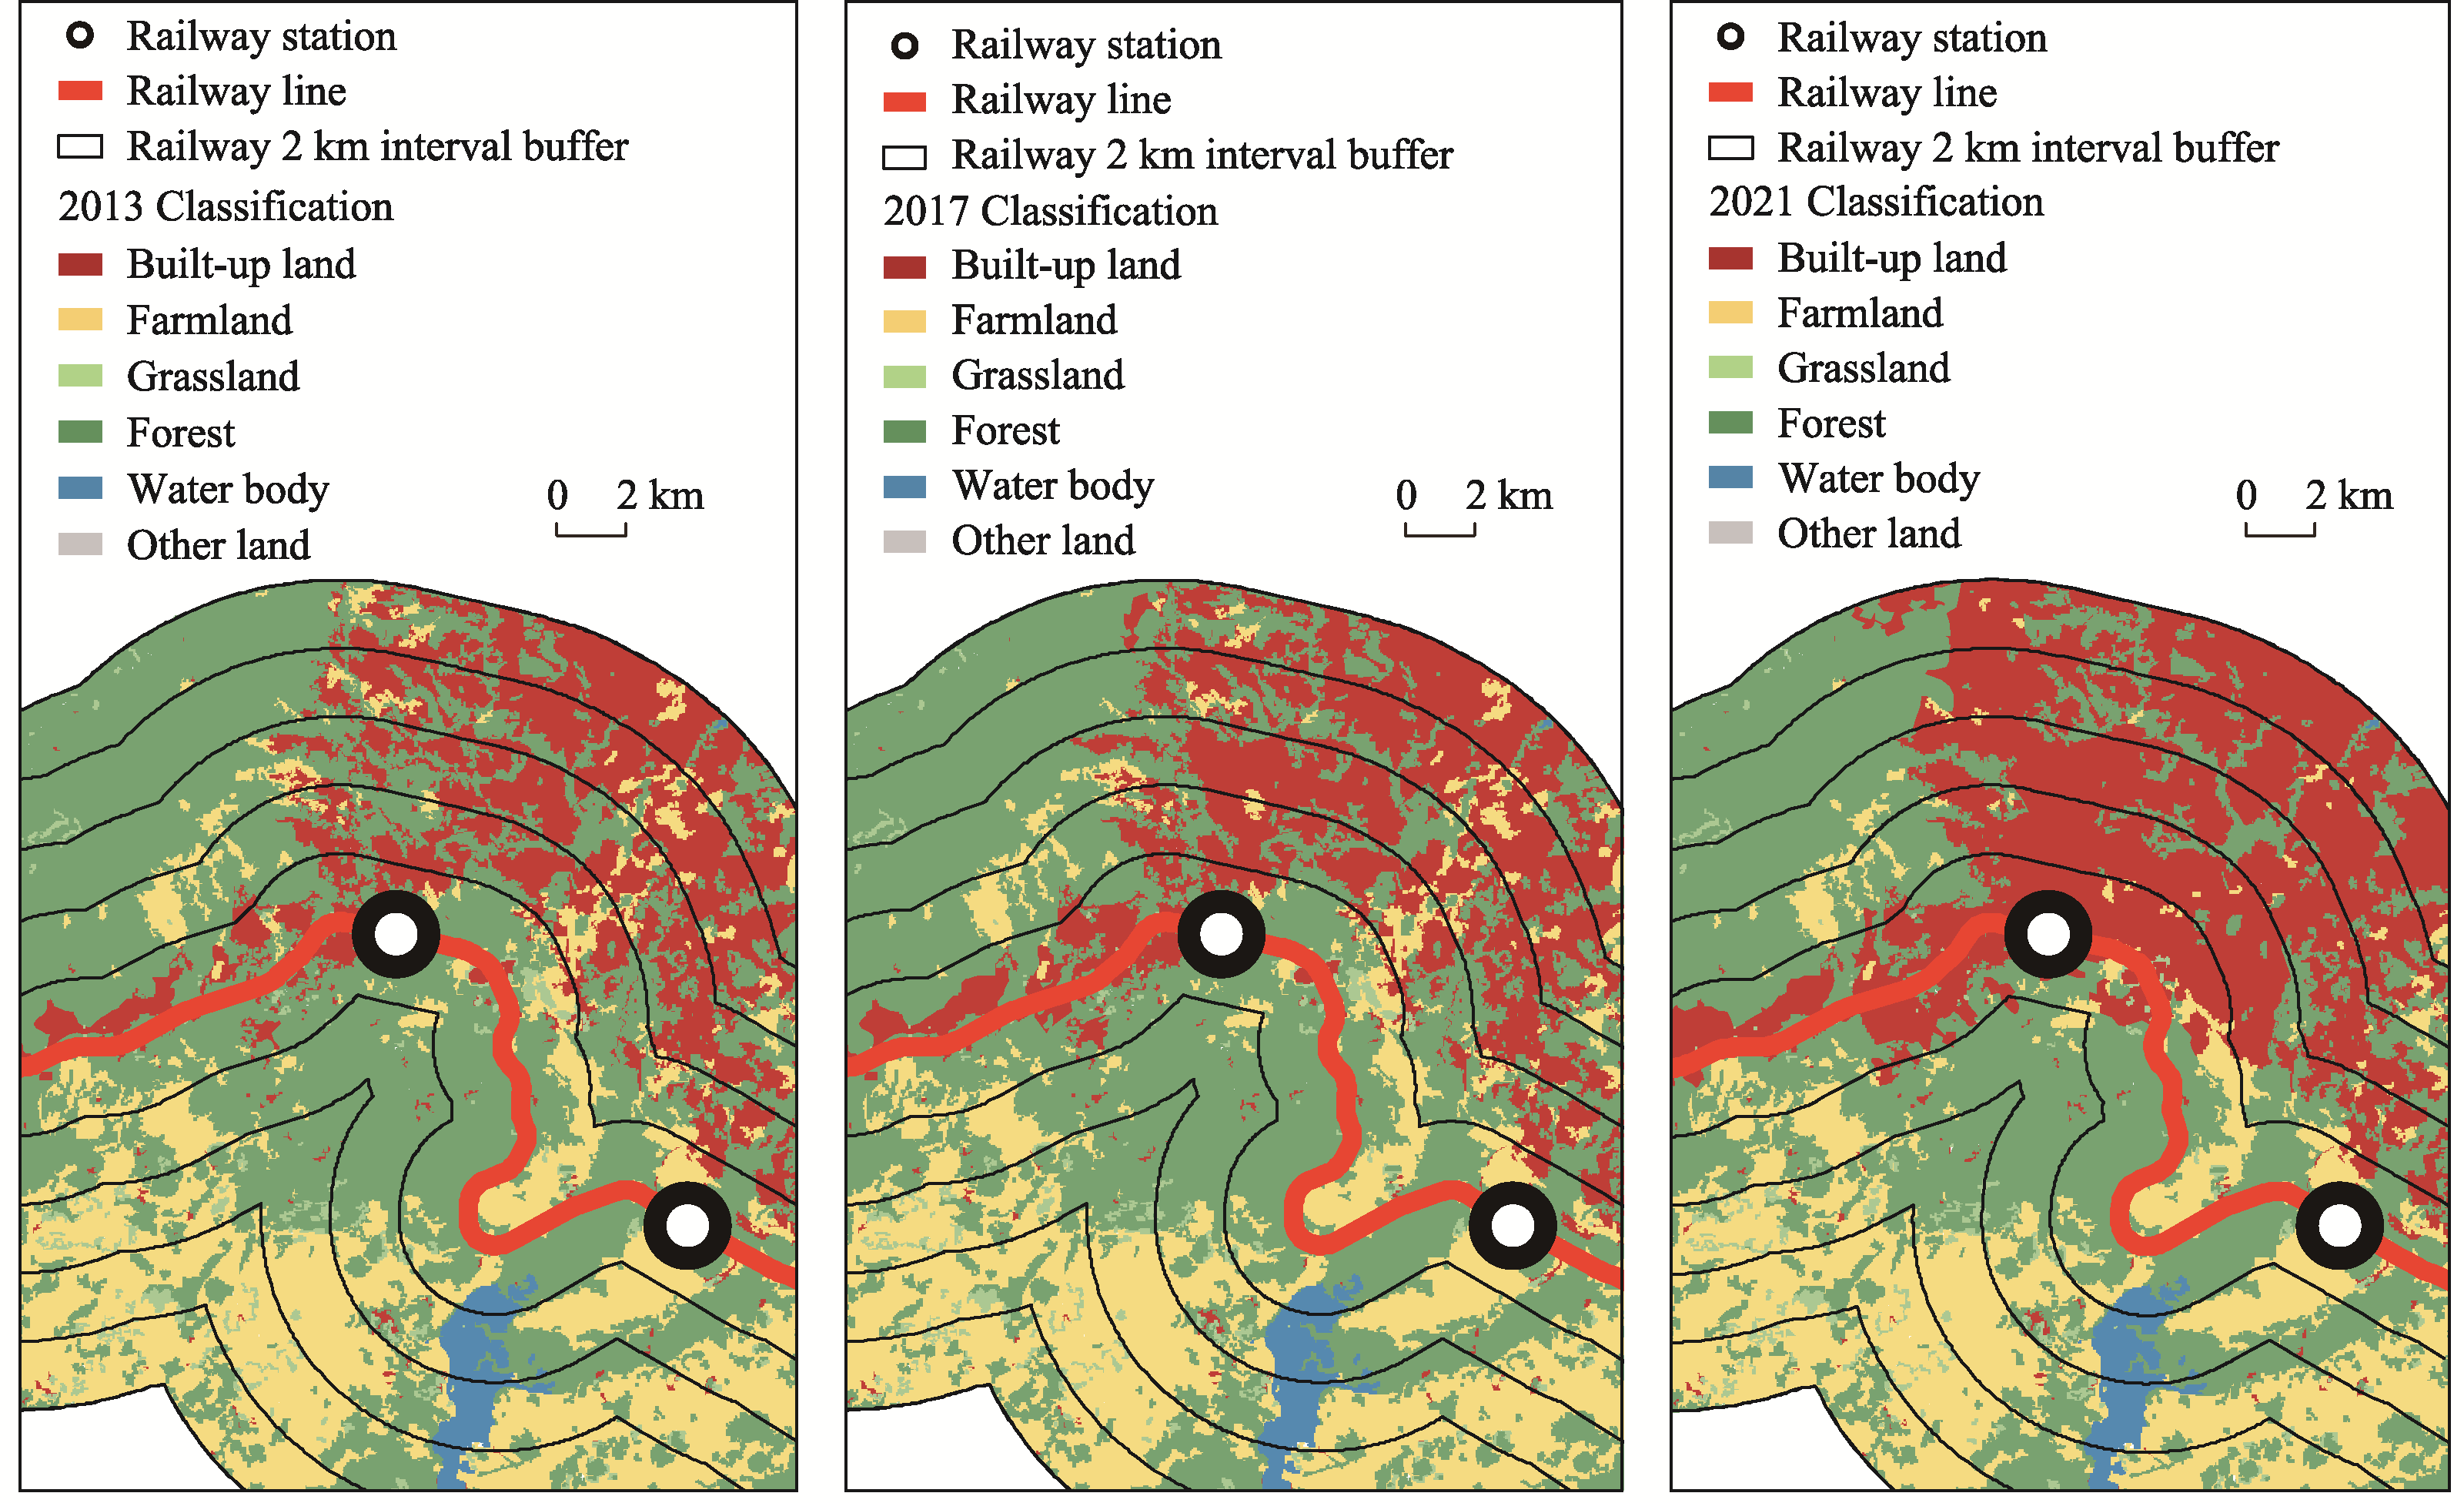
Figure 4
An enlarged map of the five buffer zones at 2 km intervals and the spatial distribution of land use along the railway line with Addis Ababa at the center in different time periods
Other figure/table from this article
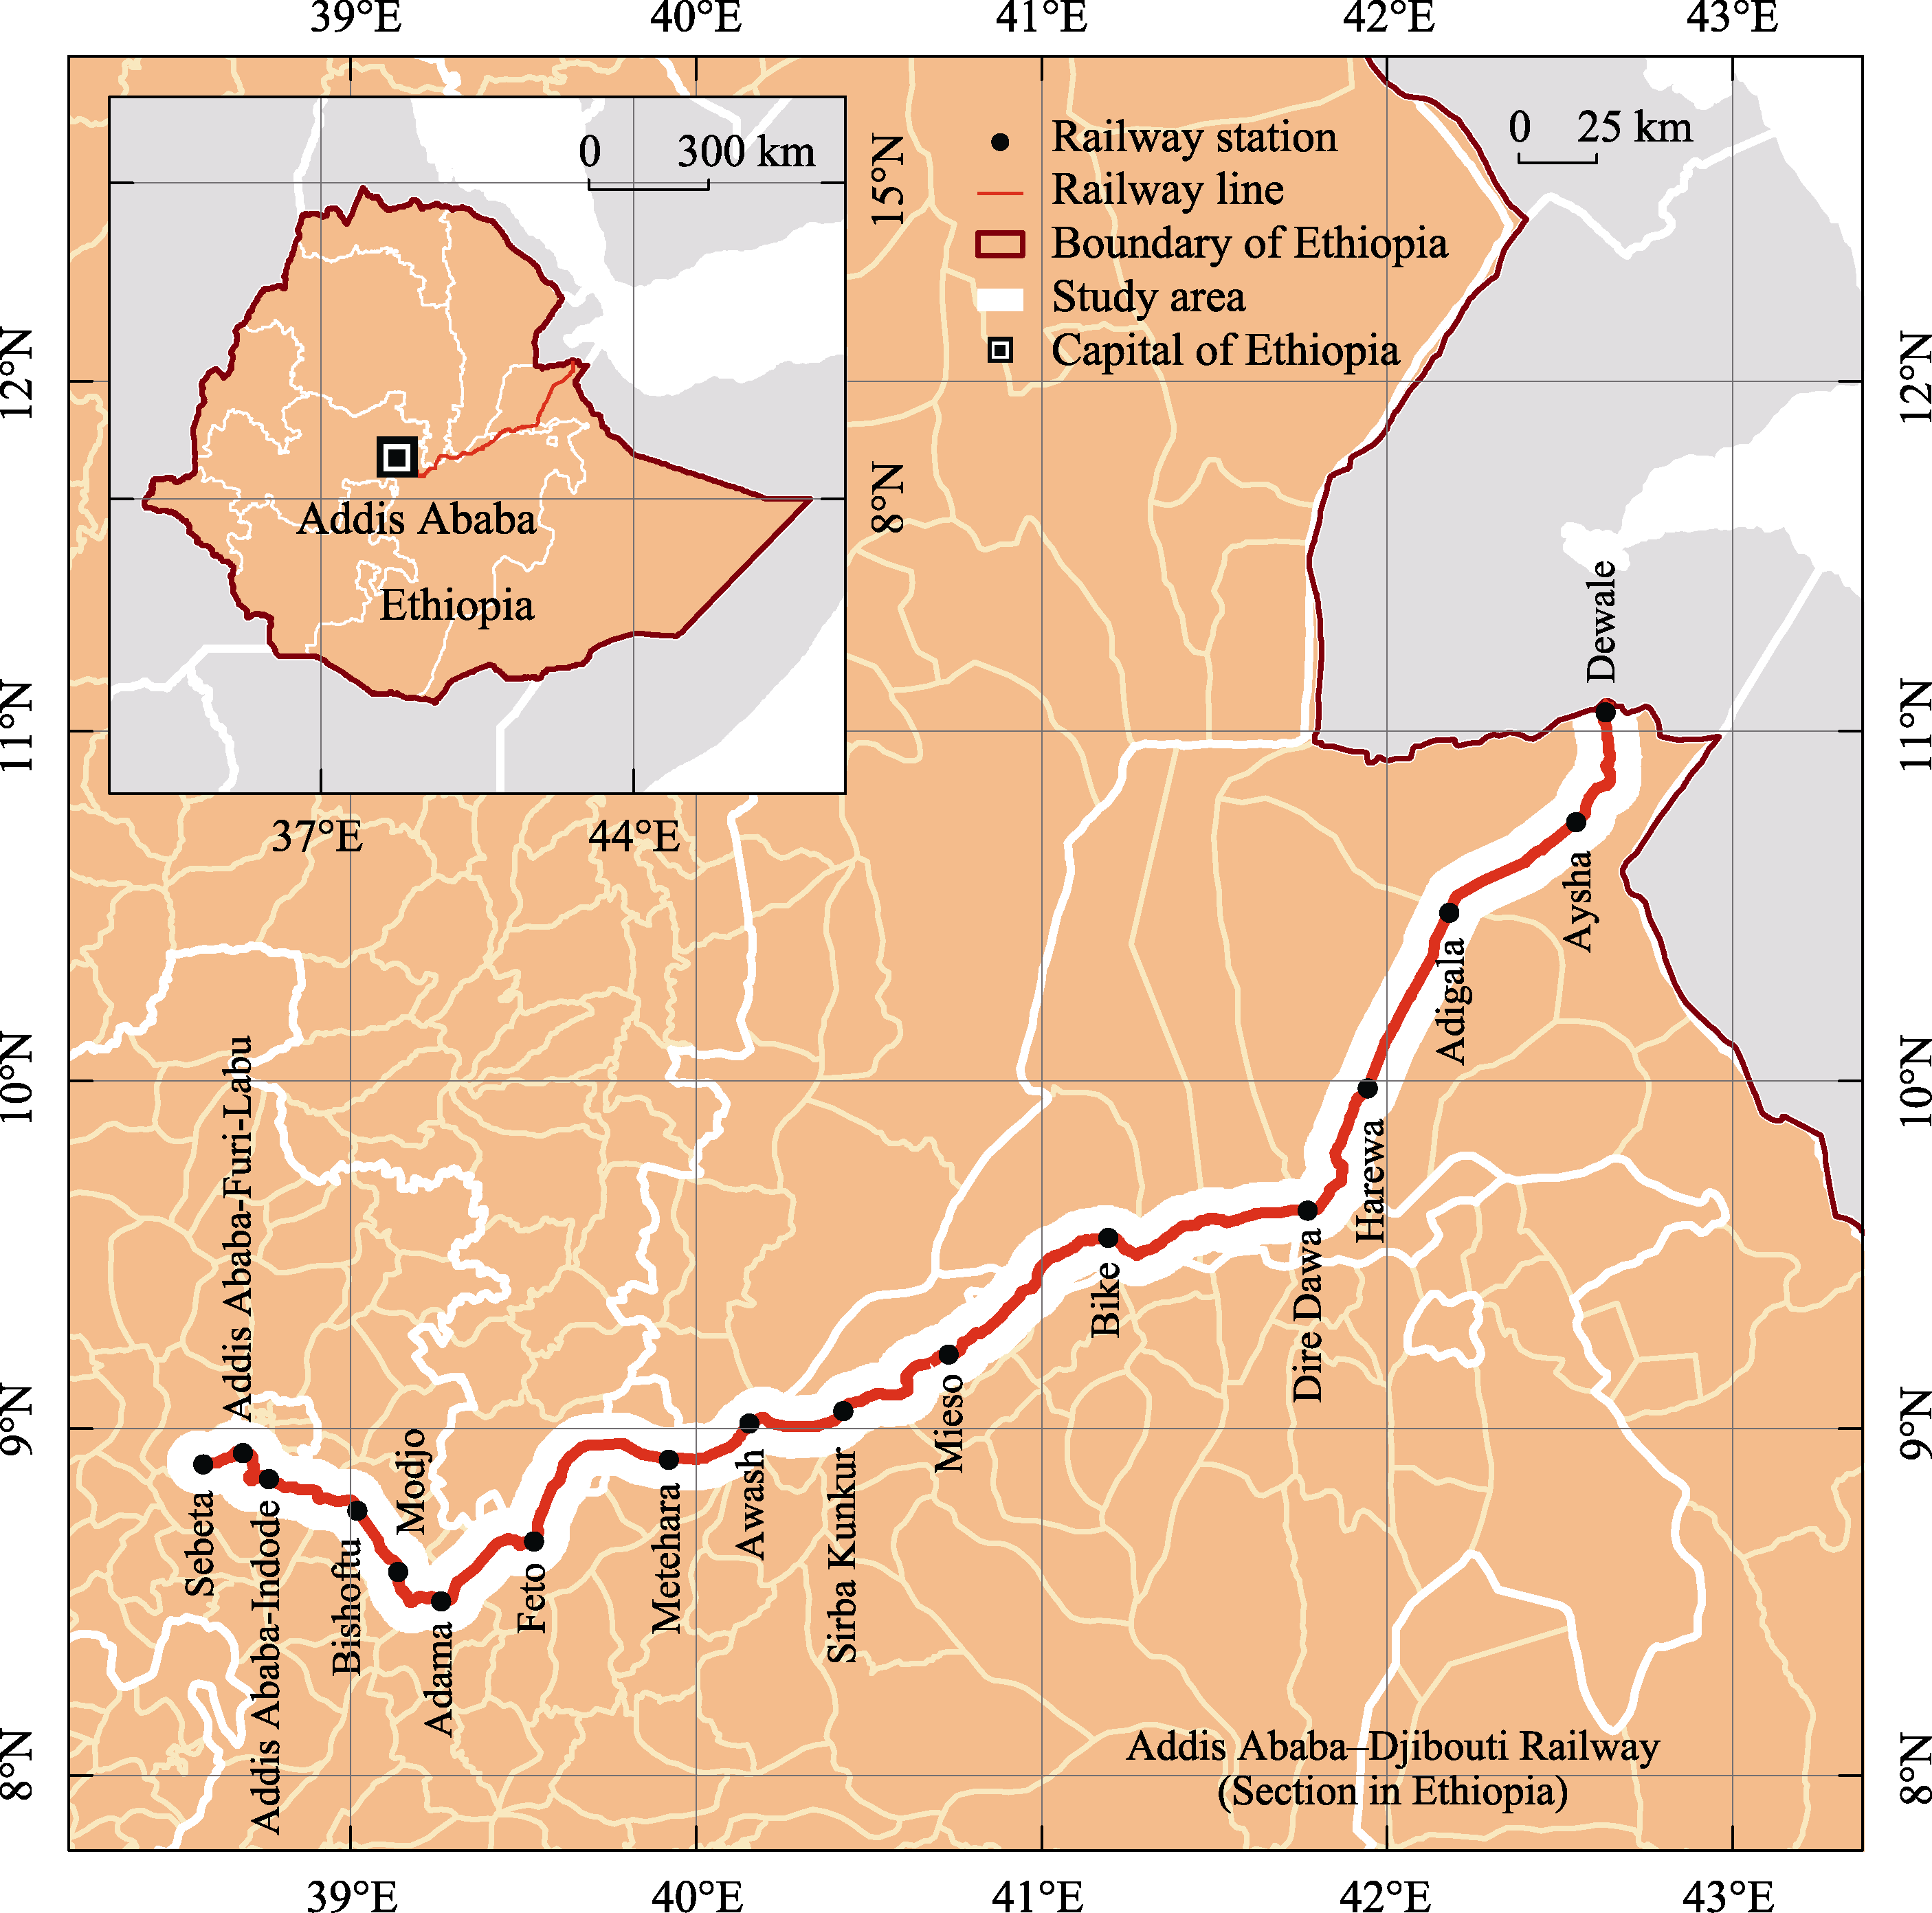
Figure 1
Location of the study area (Ethiopian section of the Addis Ababa-Djibouti Railway)
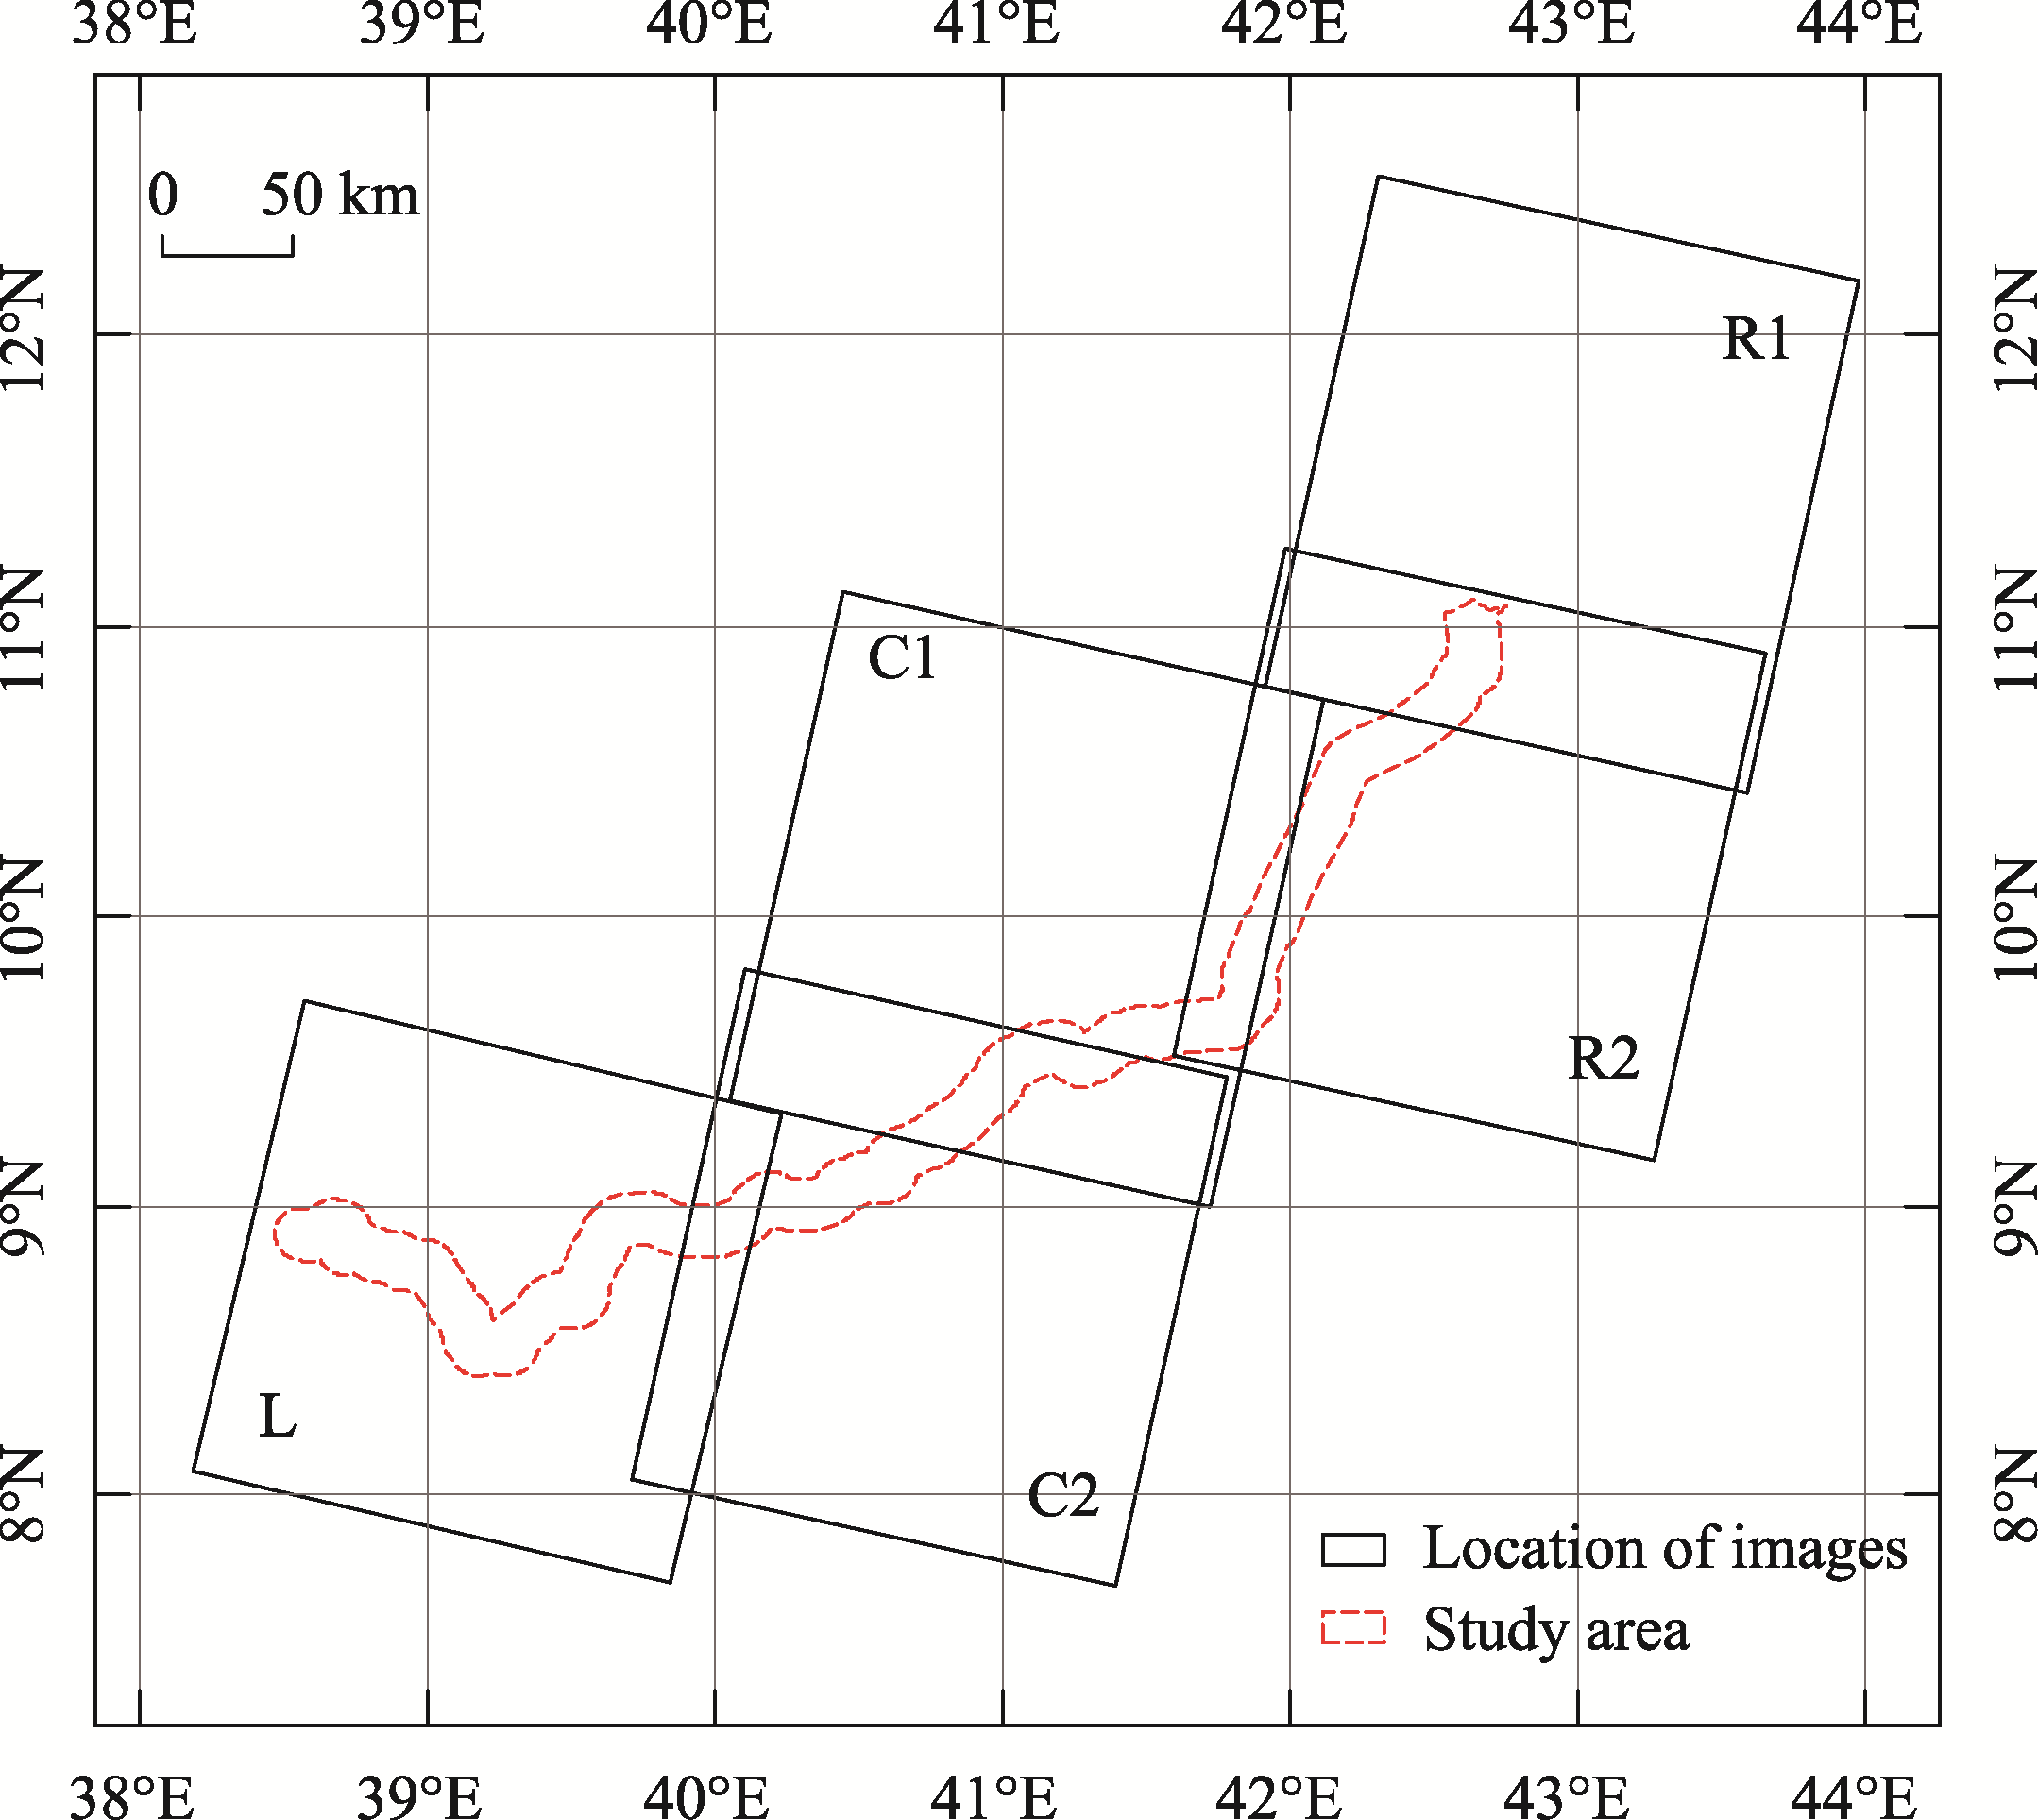
Figure 2
The distribution and index of the Landsat remote sensing images
Table 1
The date and filename of Landsat remote sensing images
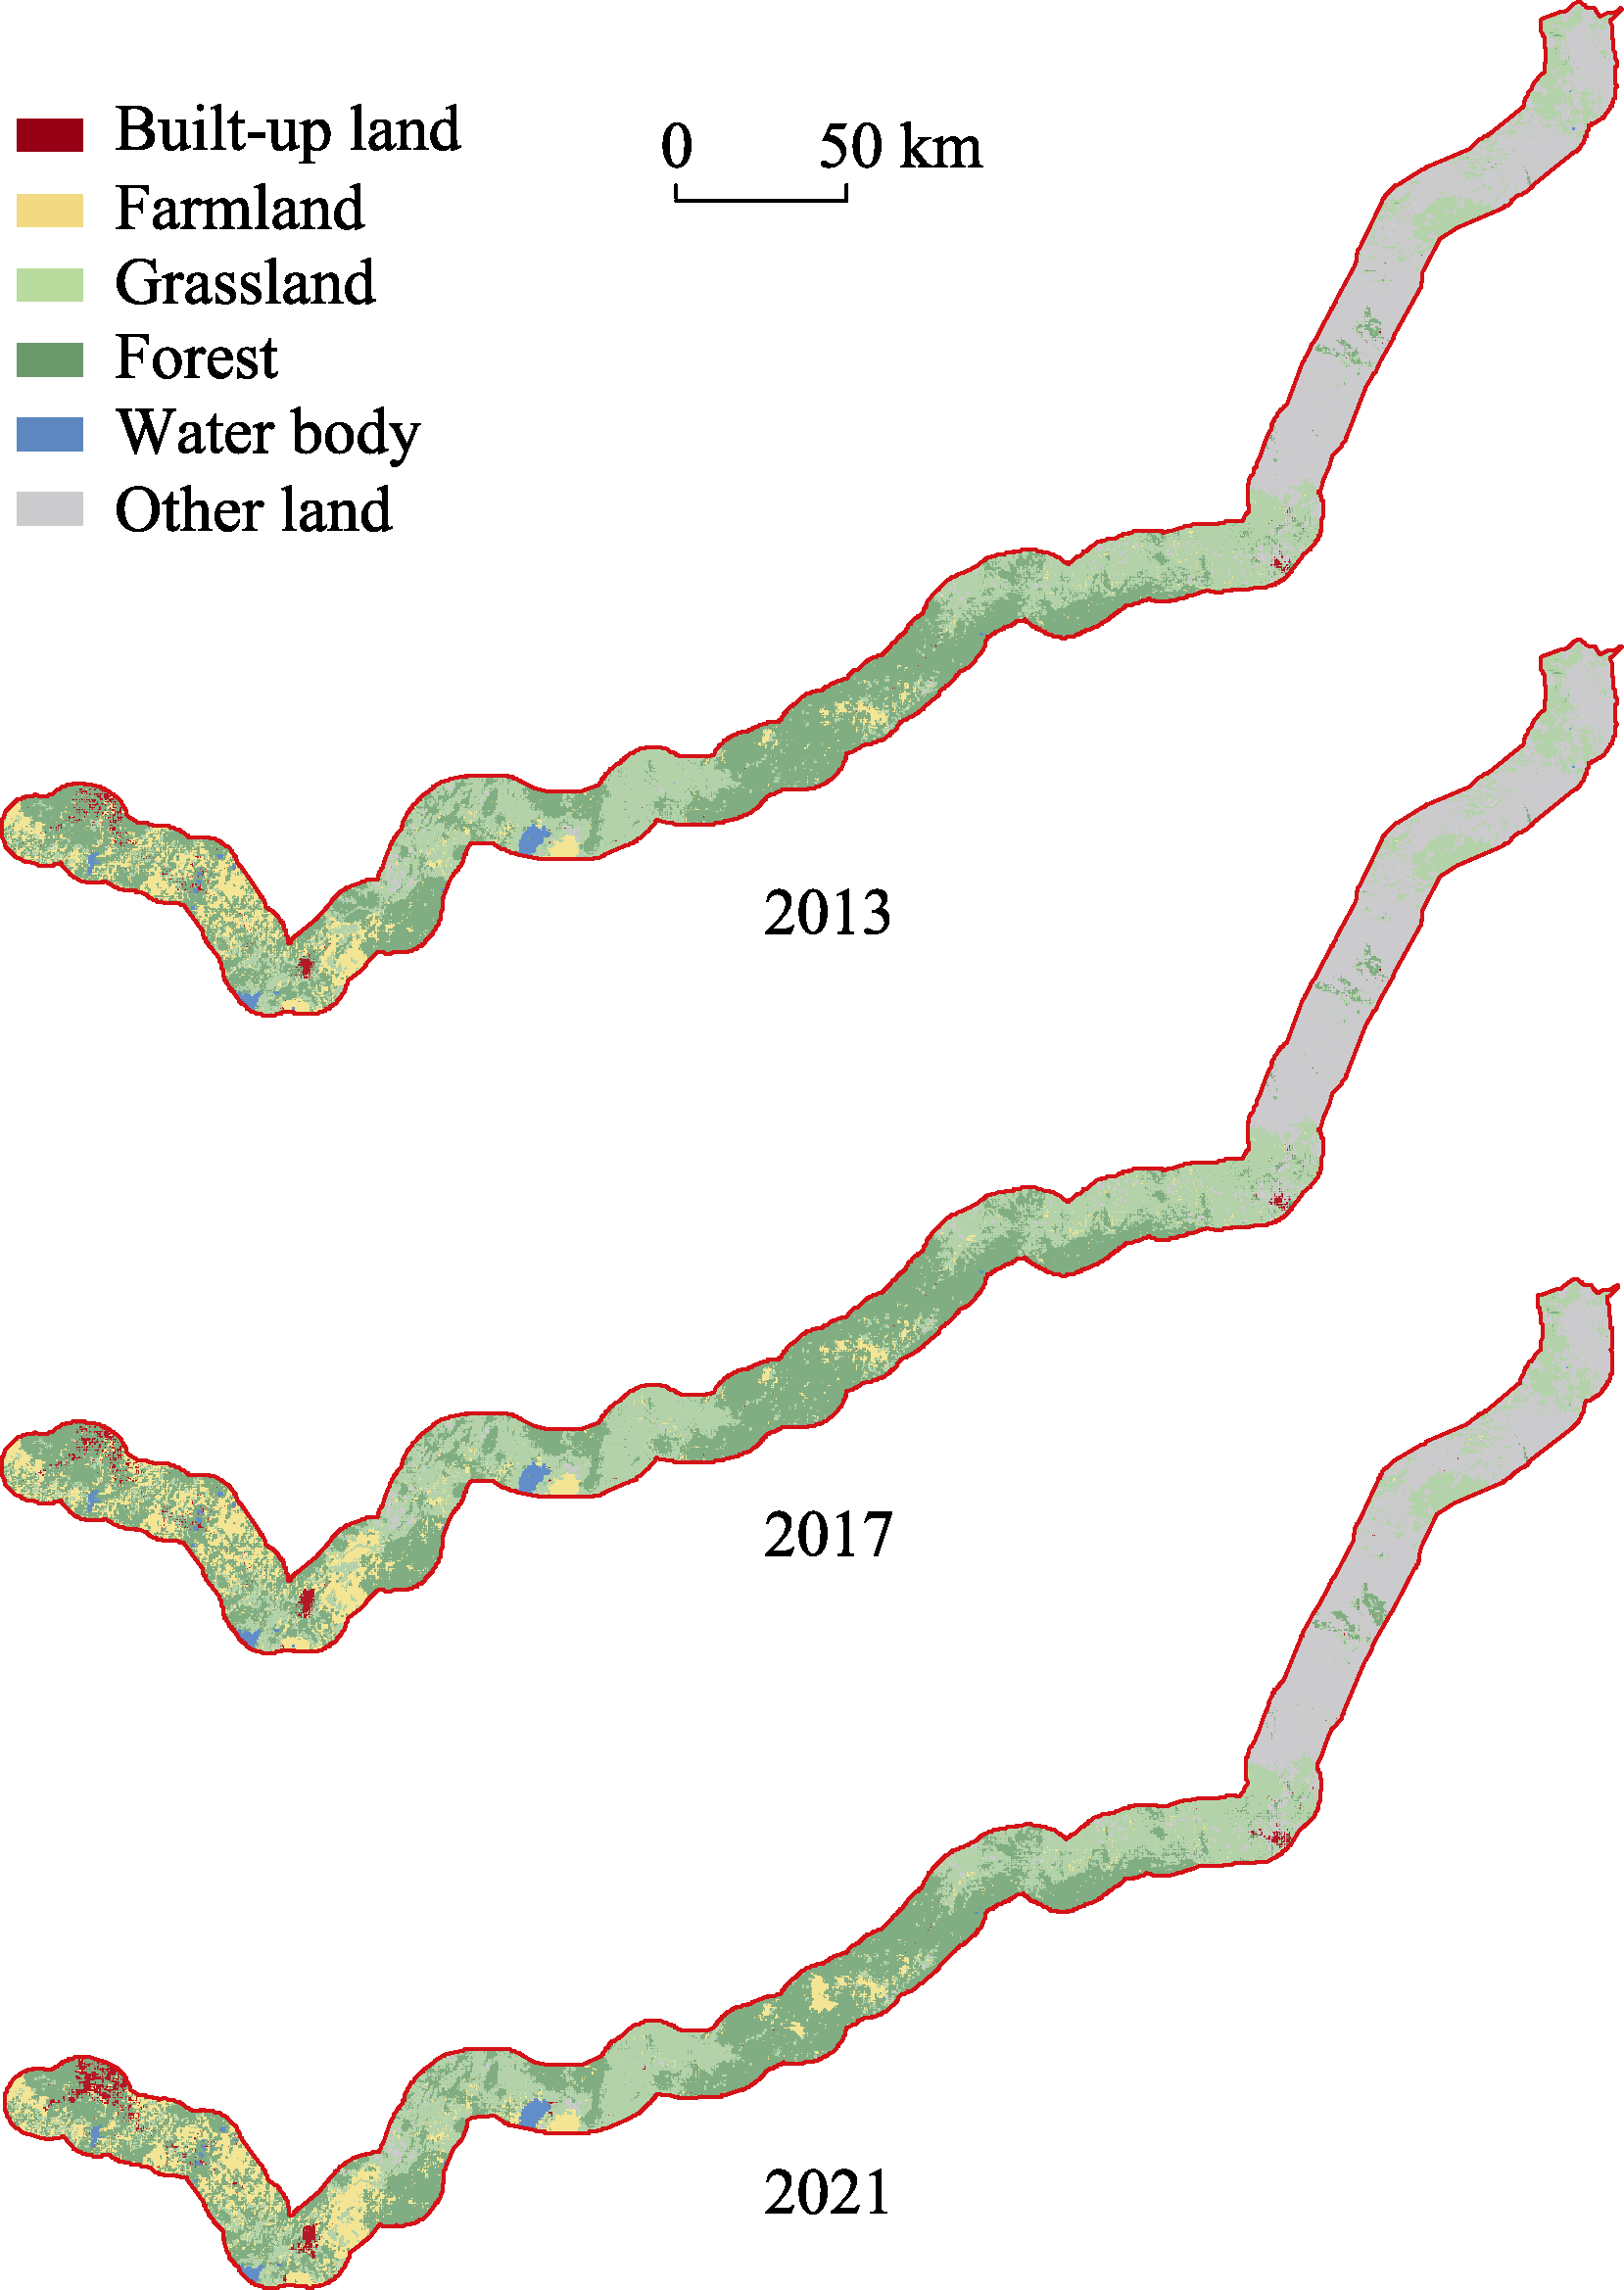
Figure 3
Distribution of land use classification in the study area in different time periods
Table 2
Proportion of land use types in different time periods
Table 3
Range of land use change in different time periods
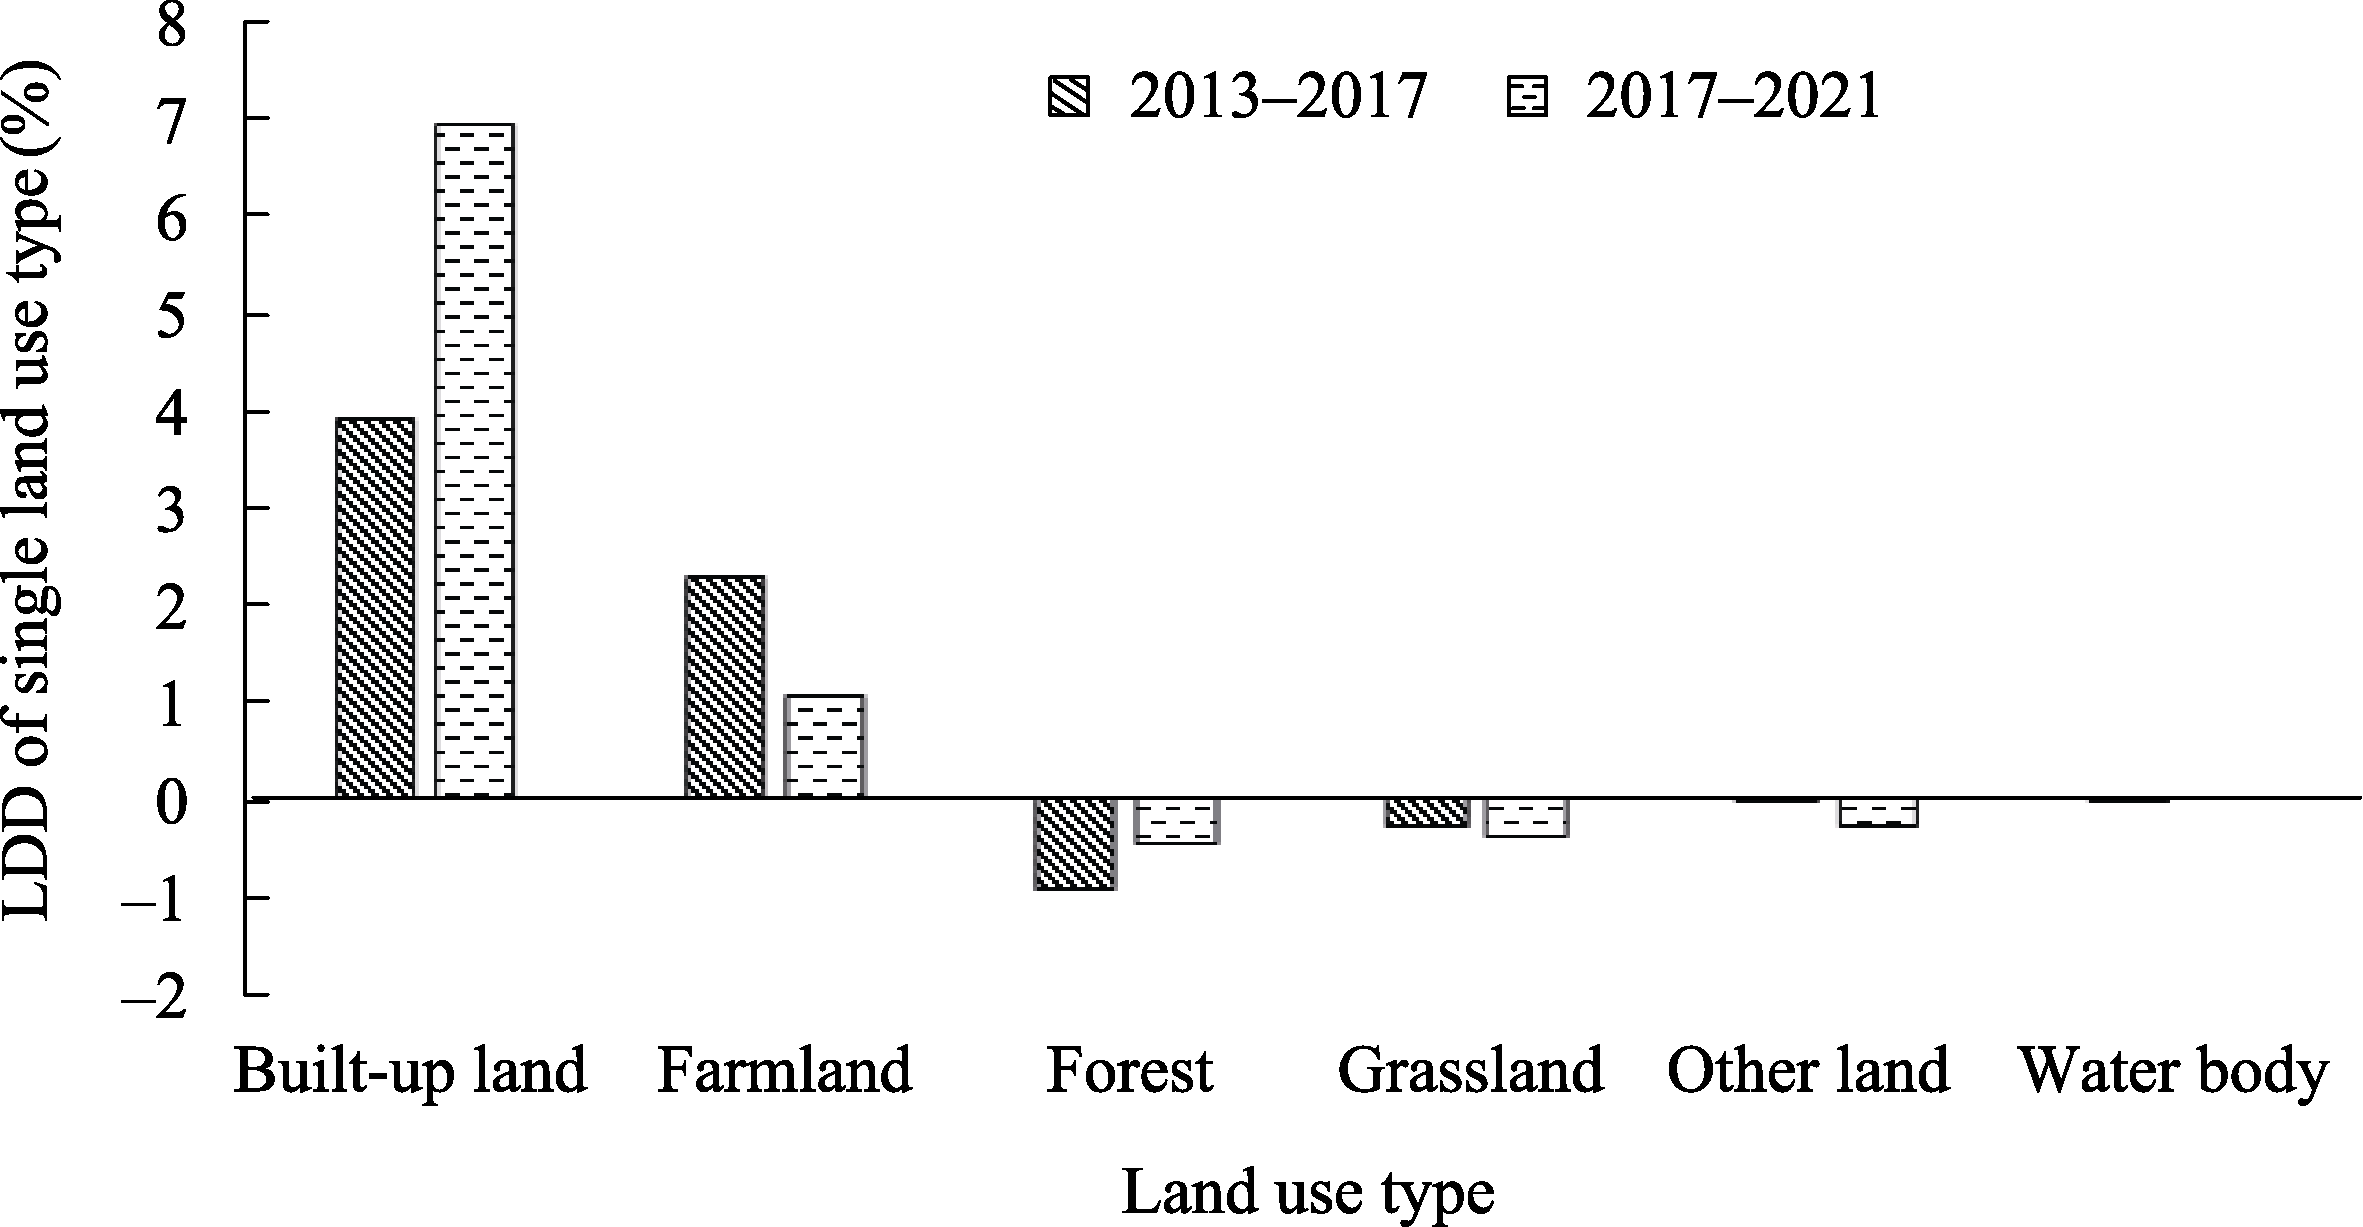
Figure 5
Land use dynamic degree (LDD) of single land use type in different periods
Table 4
Land use dynamic degree (LDD) of comprehensive land use type in different periods
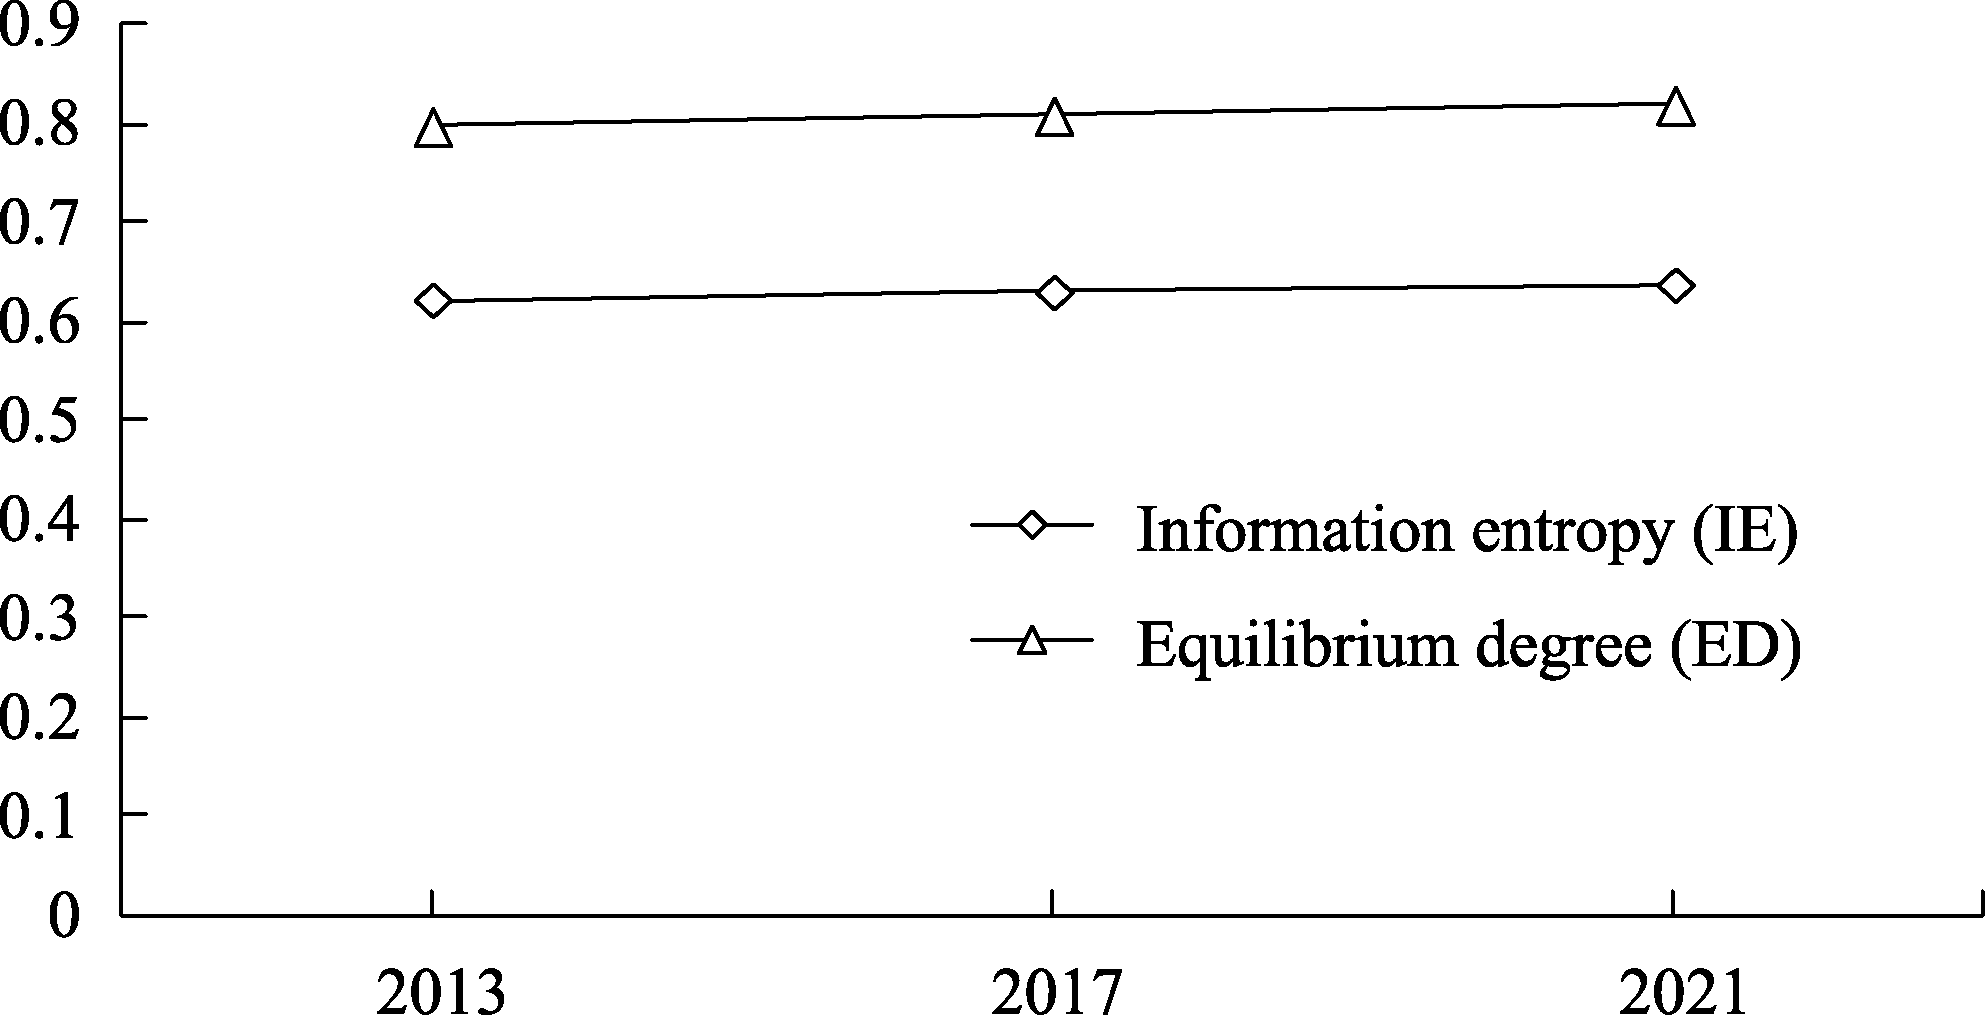
Figure 6
Information entropy (IE) and equilibrium degree (ED) of land use in different years
Table 5
Land use transfer matrix in different periods
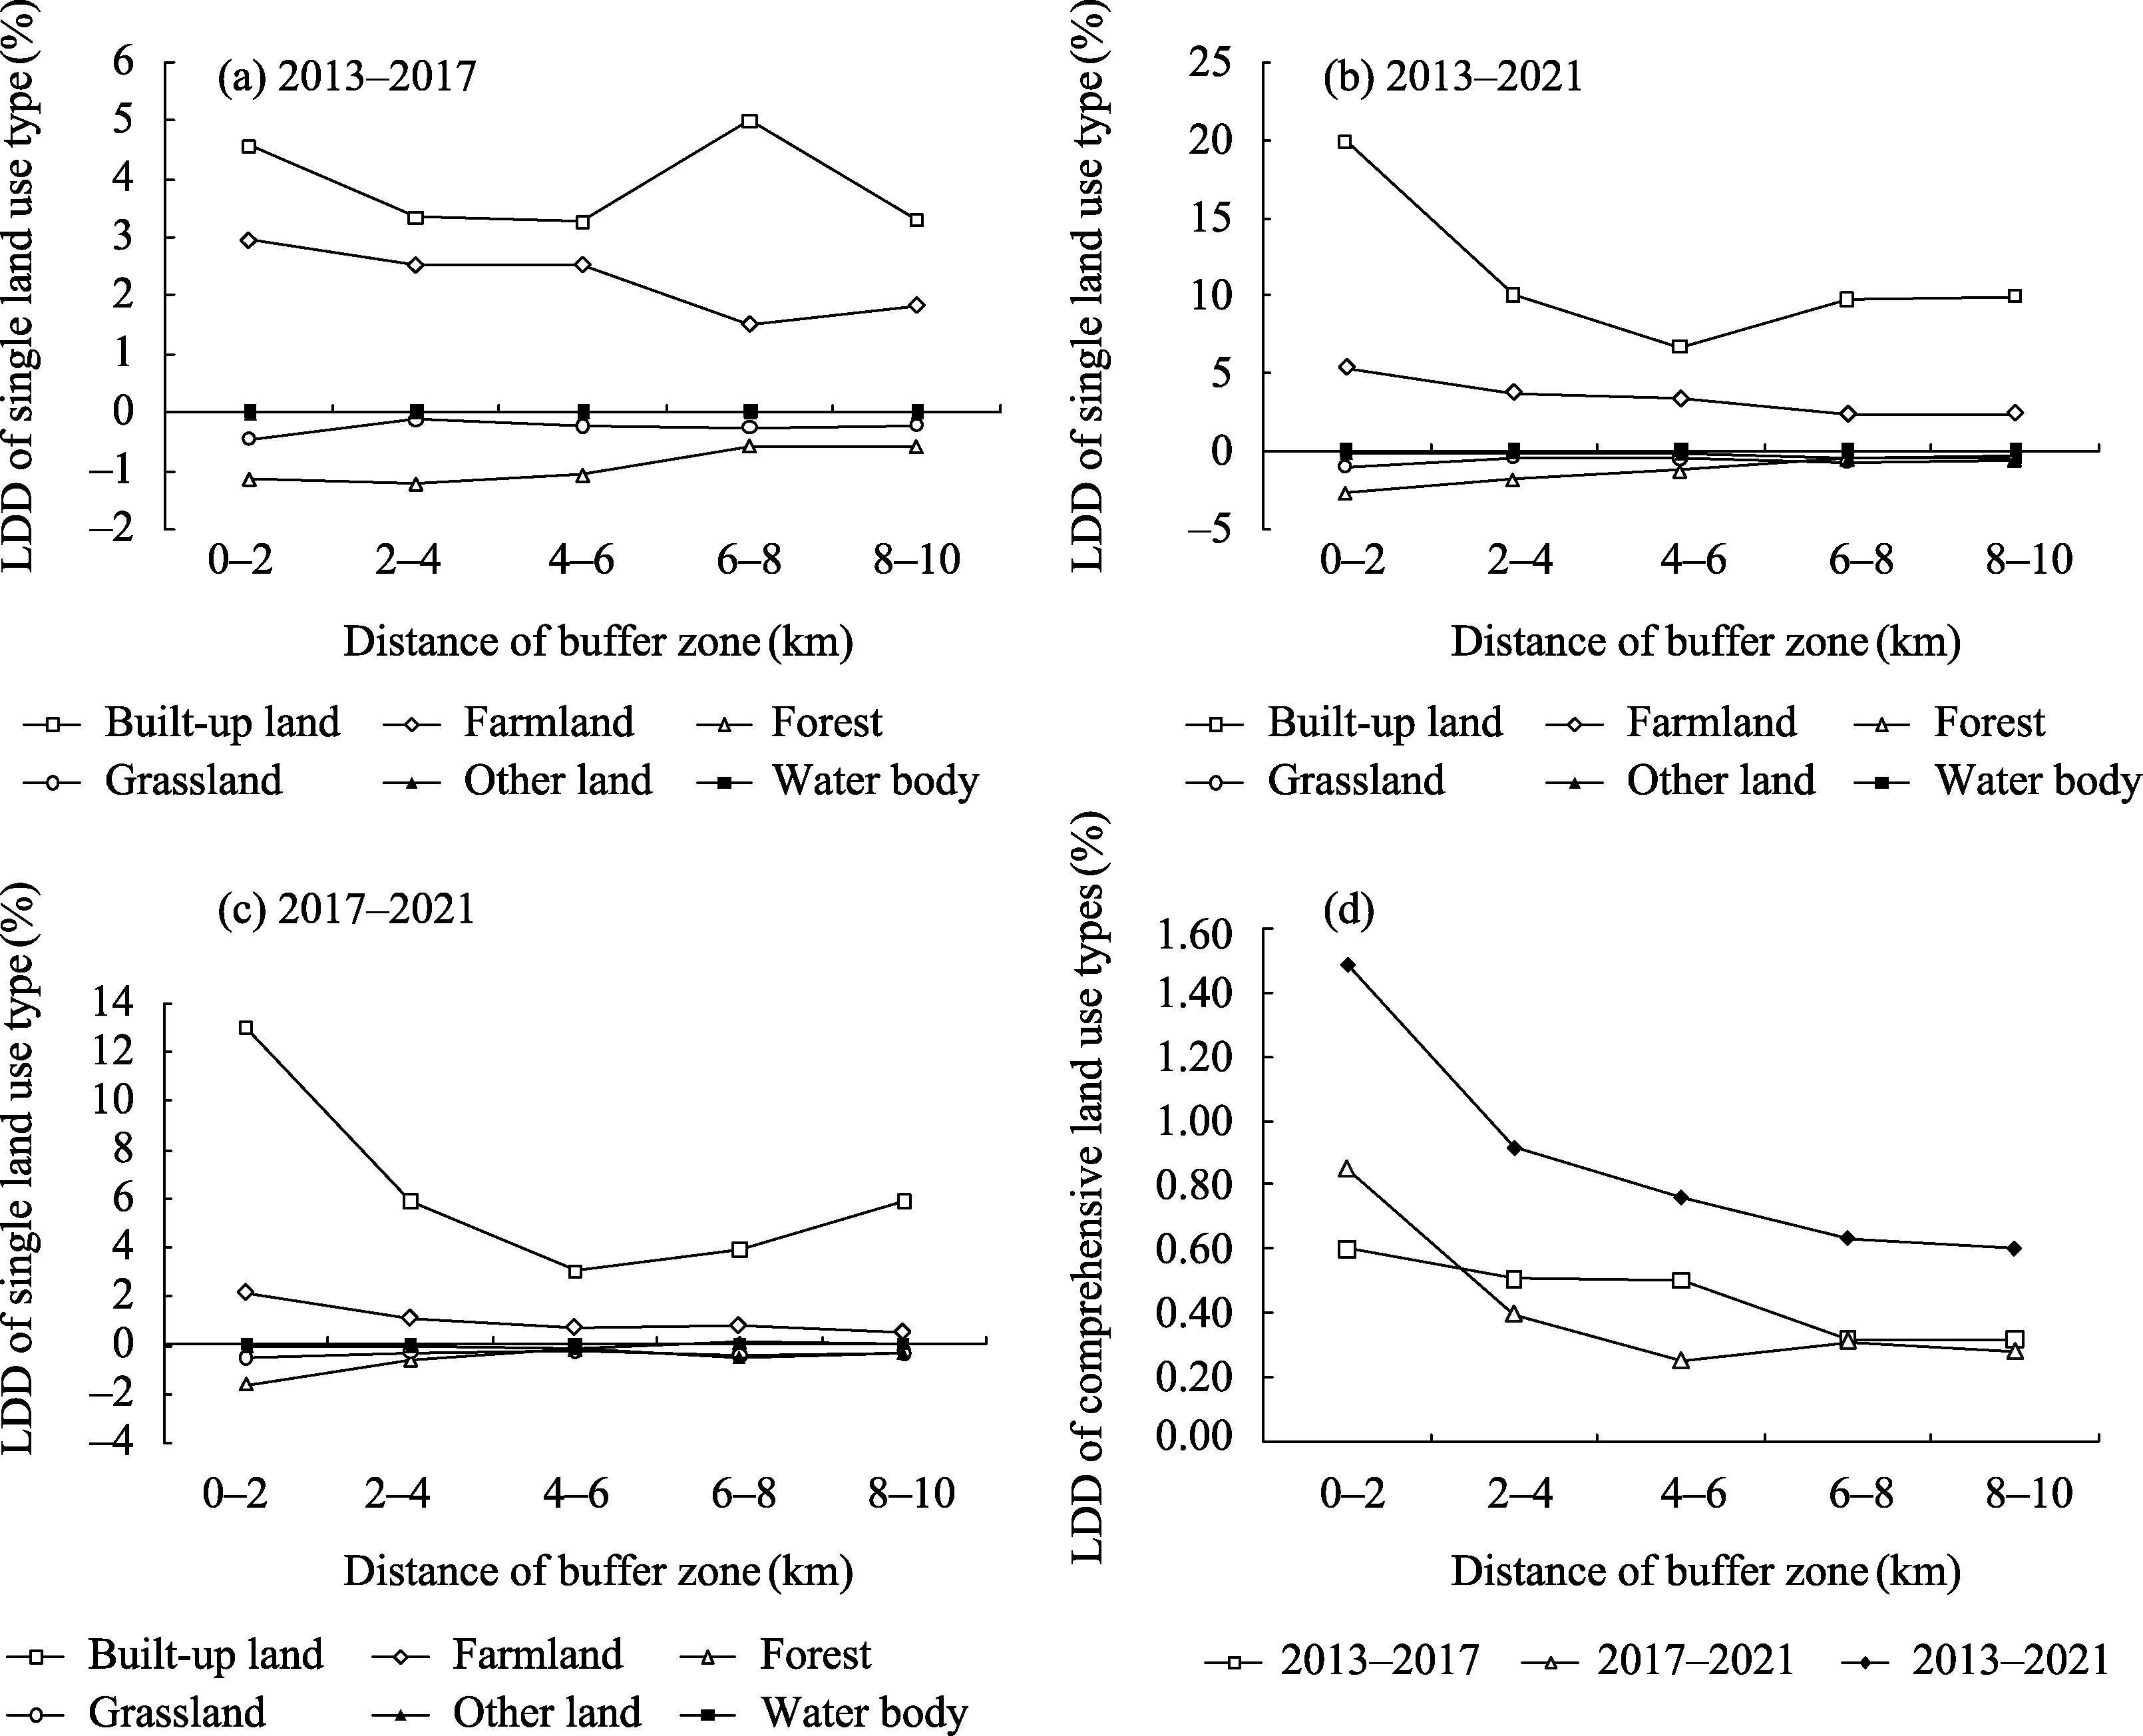
Figure 7
Relationship between land use dynamic degrees of land use change and buffer distance in each period
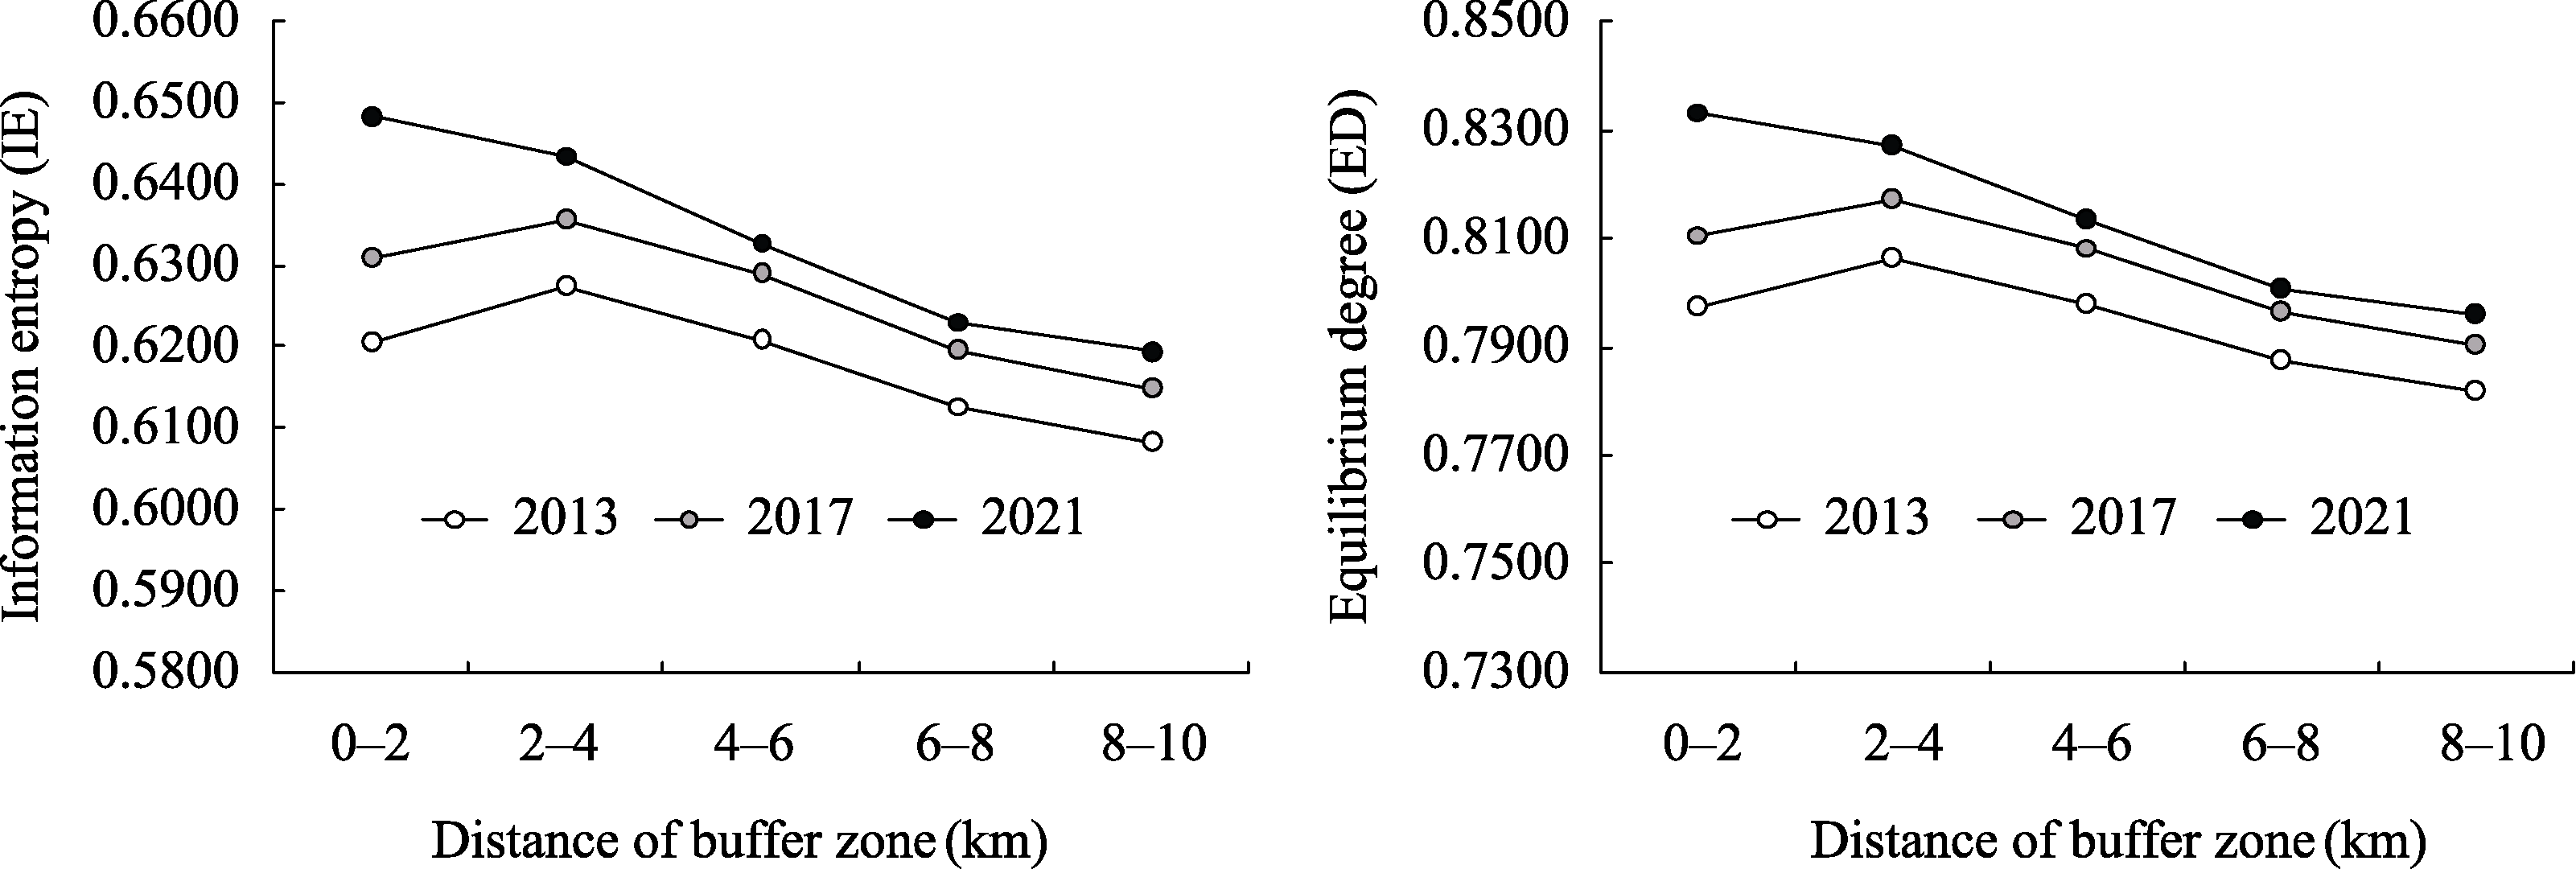
Figure 8
Information entropy and equilibrium degree of land use in each buffer zone in different periods
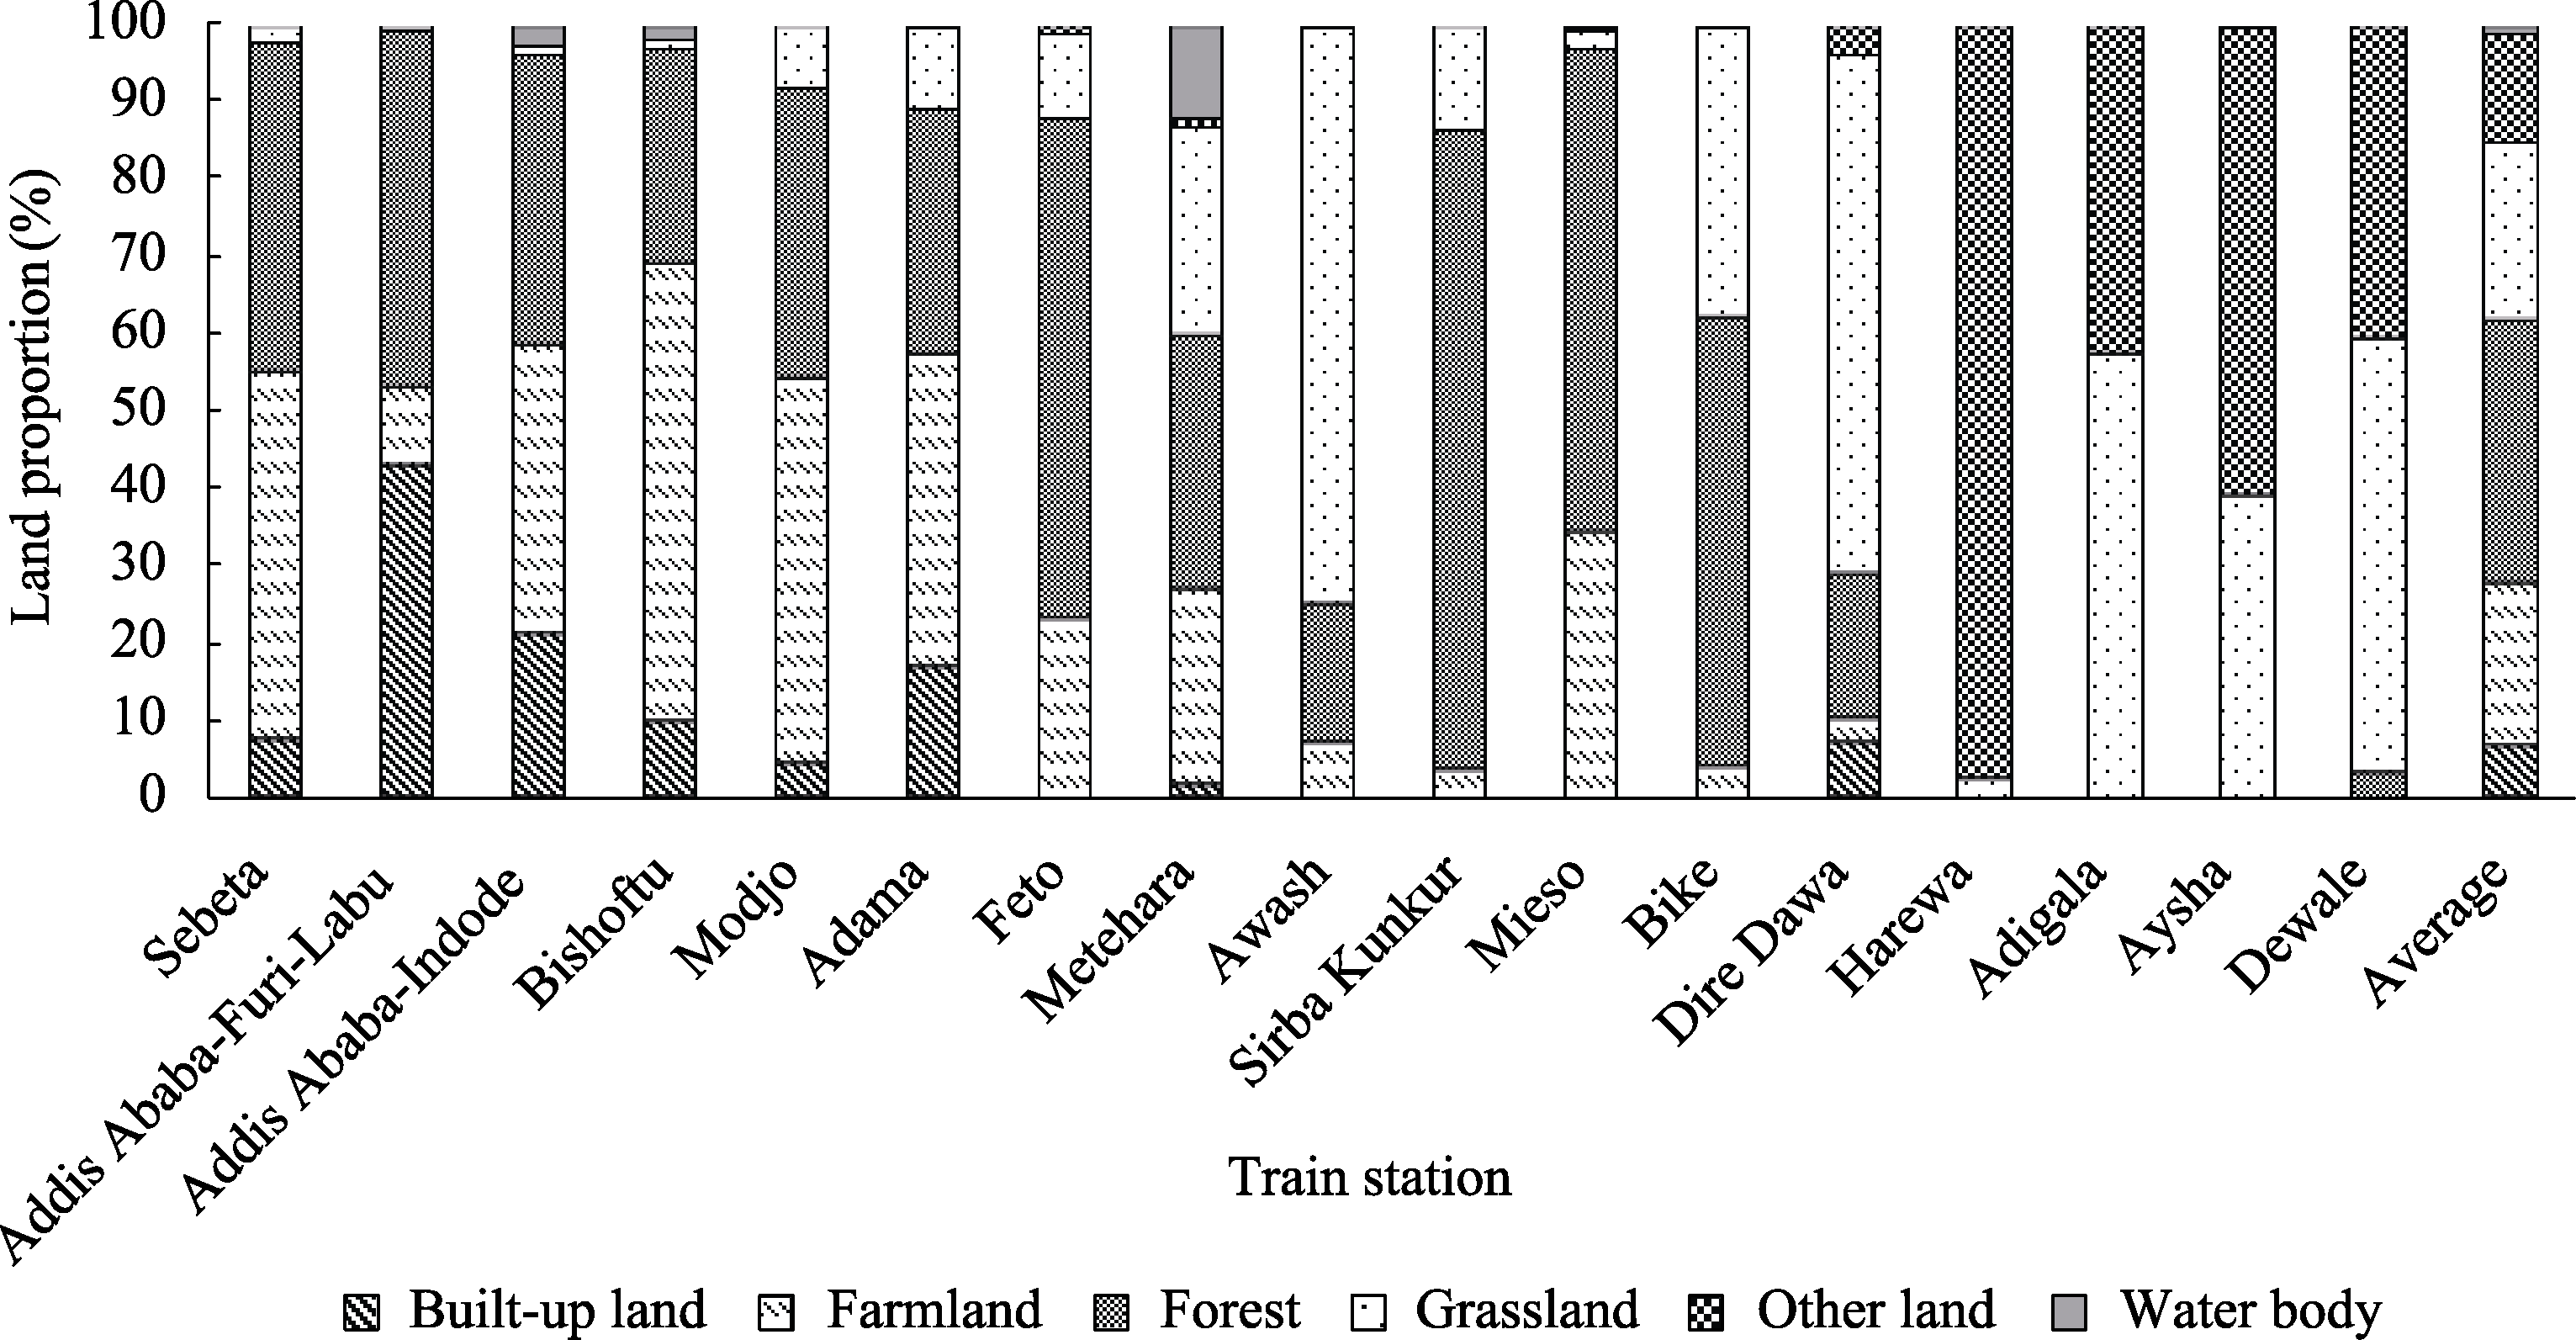
Figure 9
Land use structure of the buffer zones with a radius of 10 km around the stations along the Ethiopian section of the Addis Ababa-Djibouti Railway in 2021
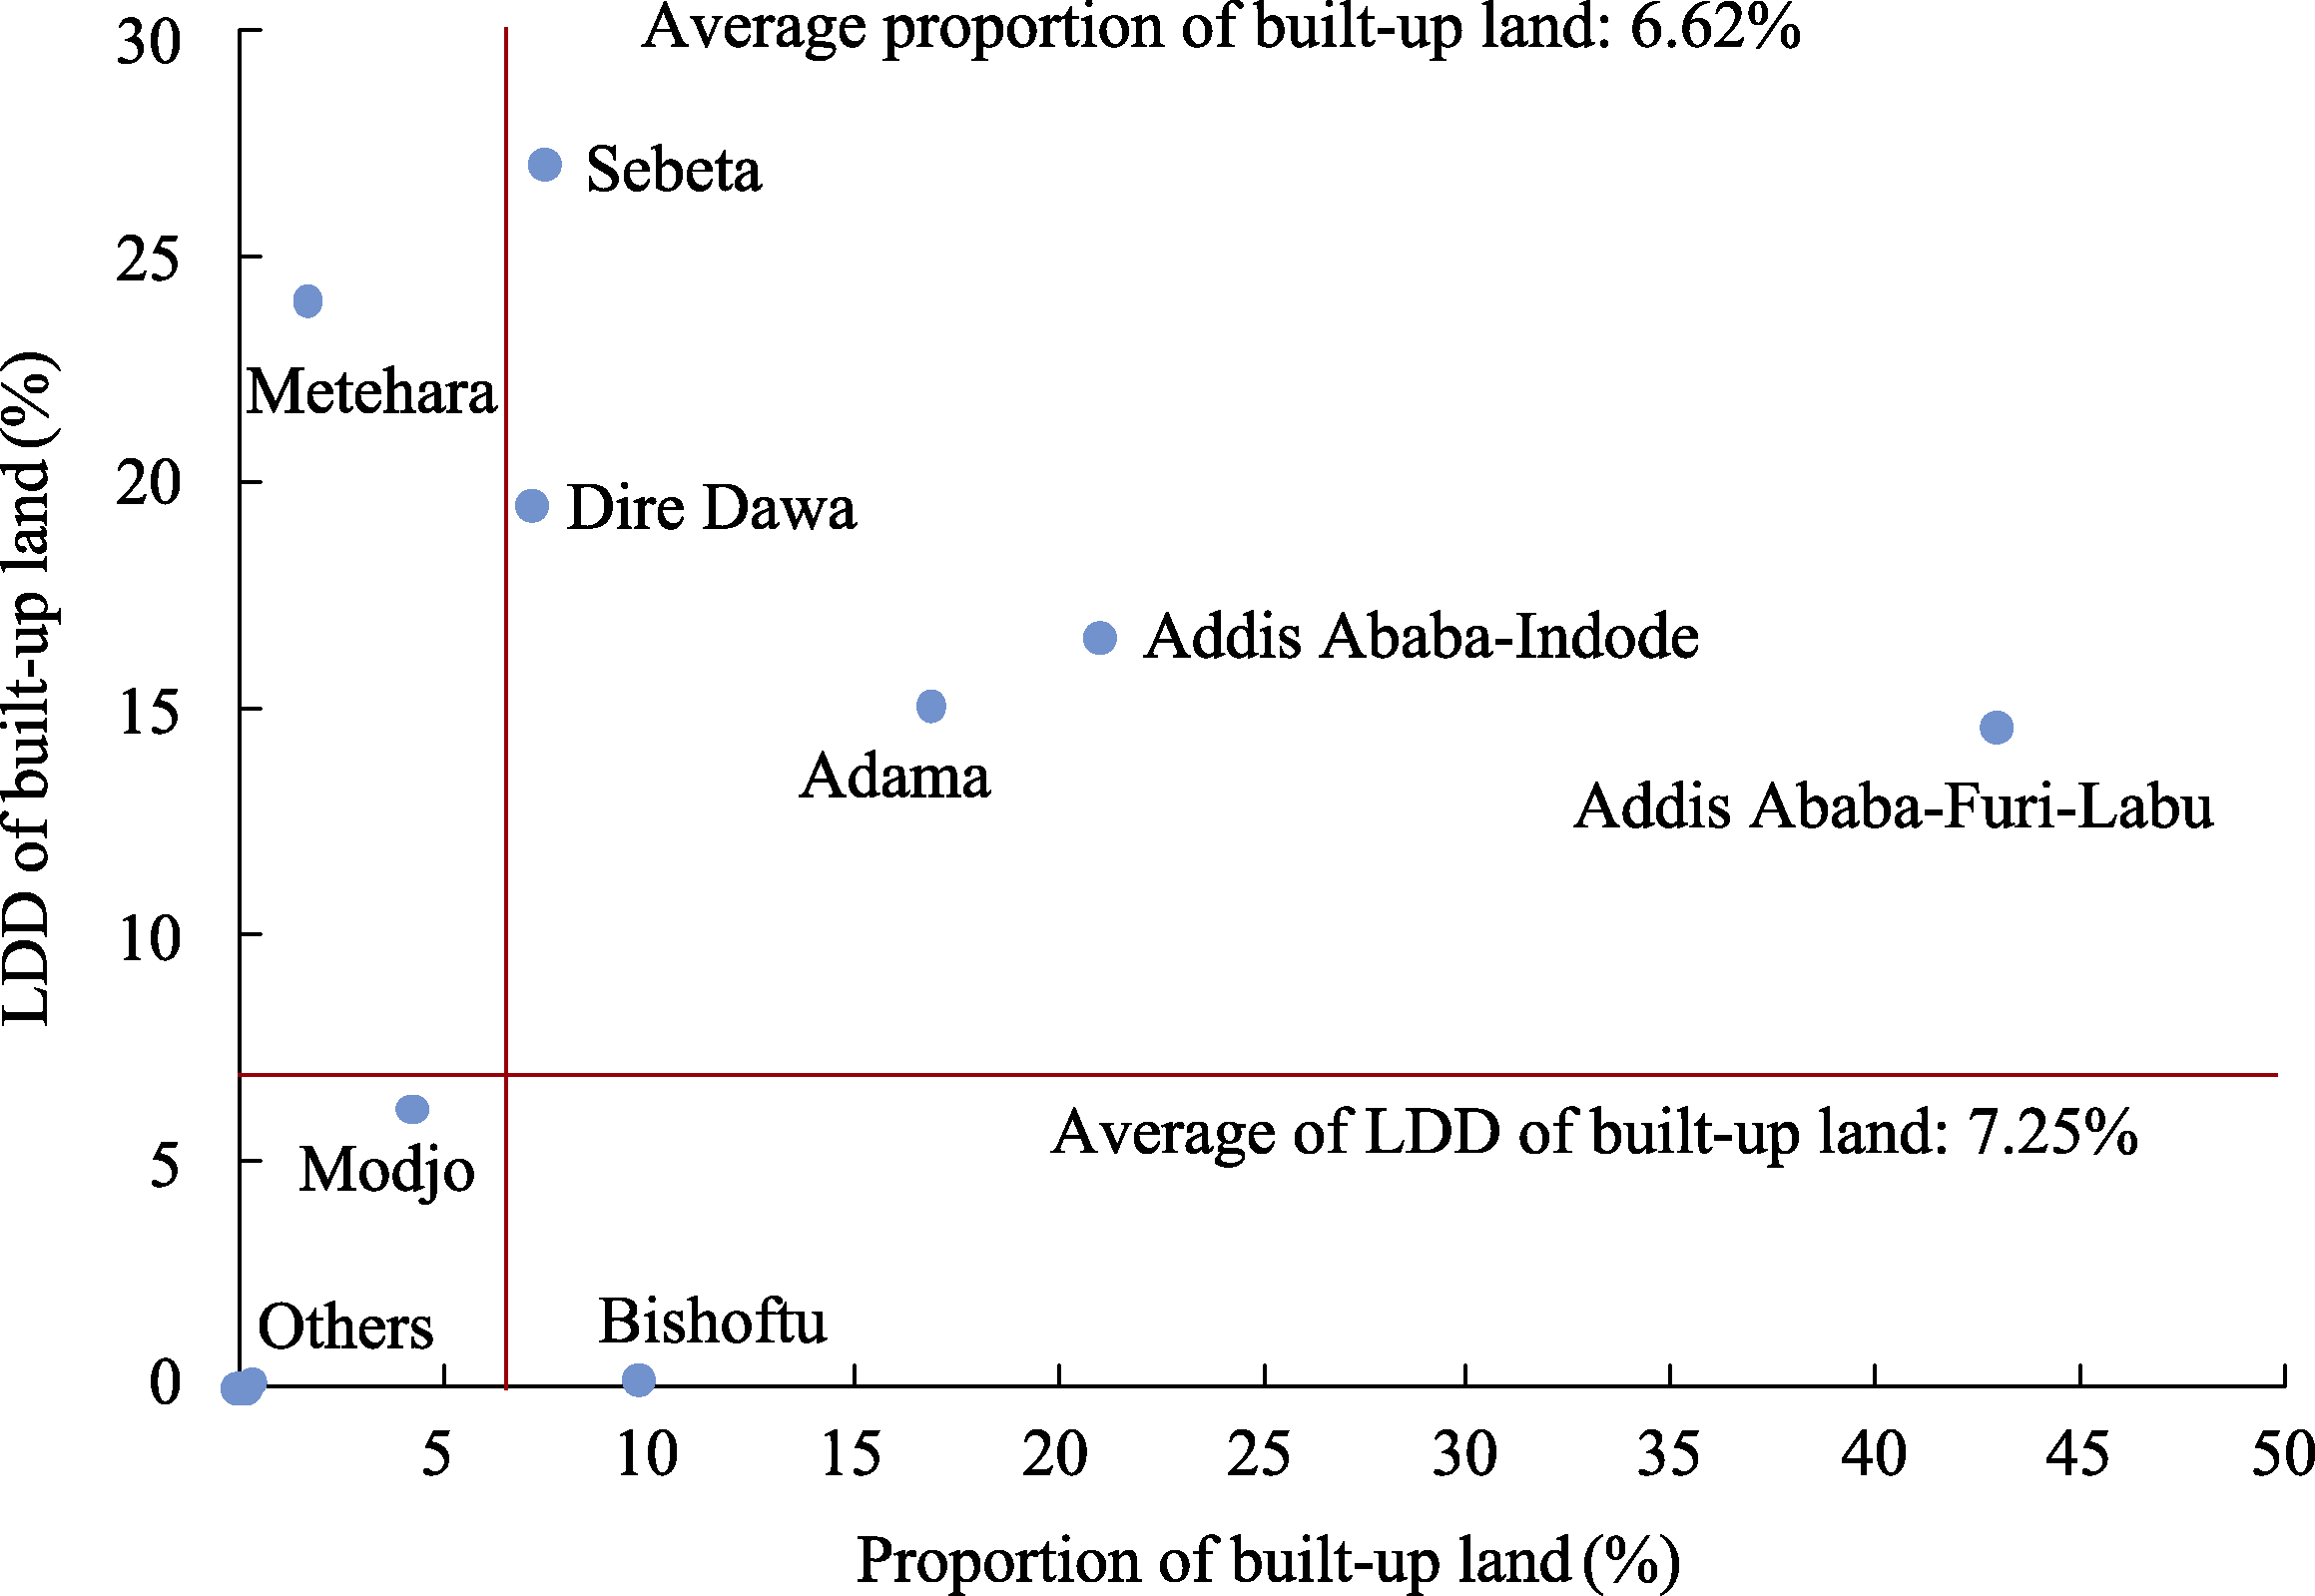
Figure 10
Proportion of built-up land in 2021 and land use dynamic degree (LDD) of built-up land from 2013 to 2021 of the buffer zones with a radius of 10 km around the stations along the Ethiopian section of the Addis Ababa-Djibouti Railway
Note: “Others” includes Feto, Awash, Sirba Kunkur, Mieso, Bike, Harewa, Adigala, Aysha, and Dewale.
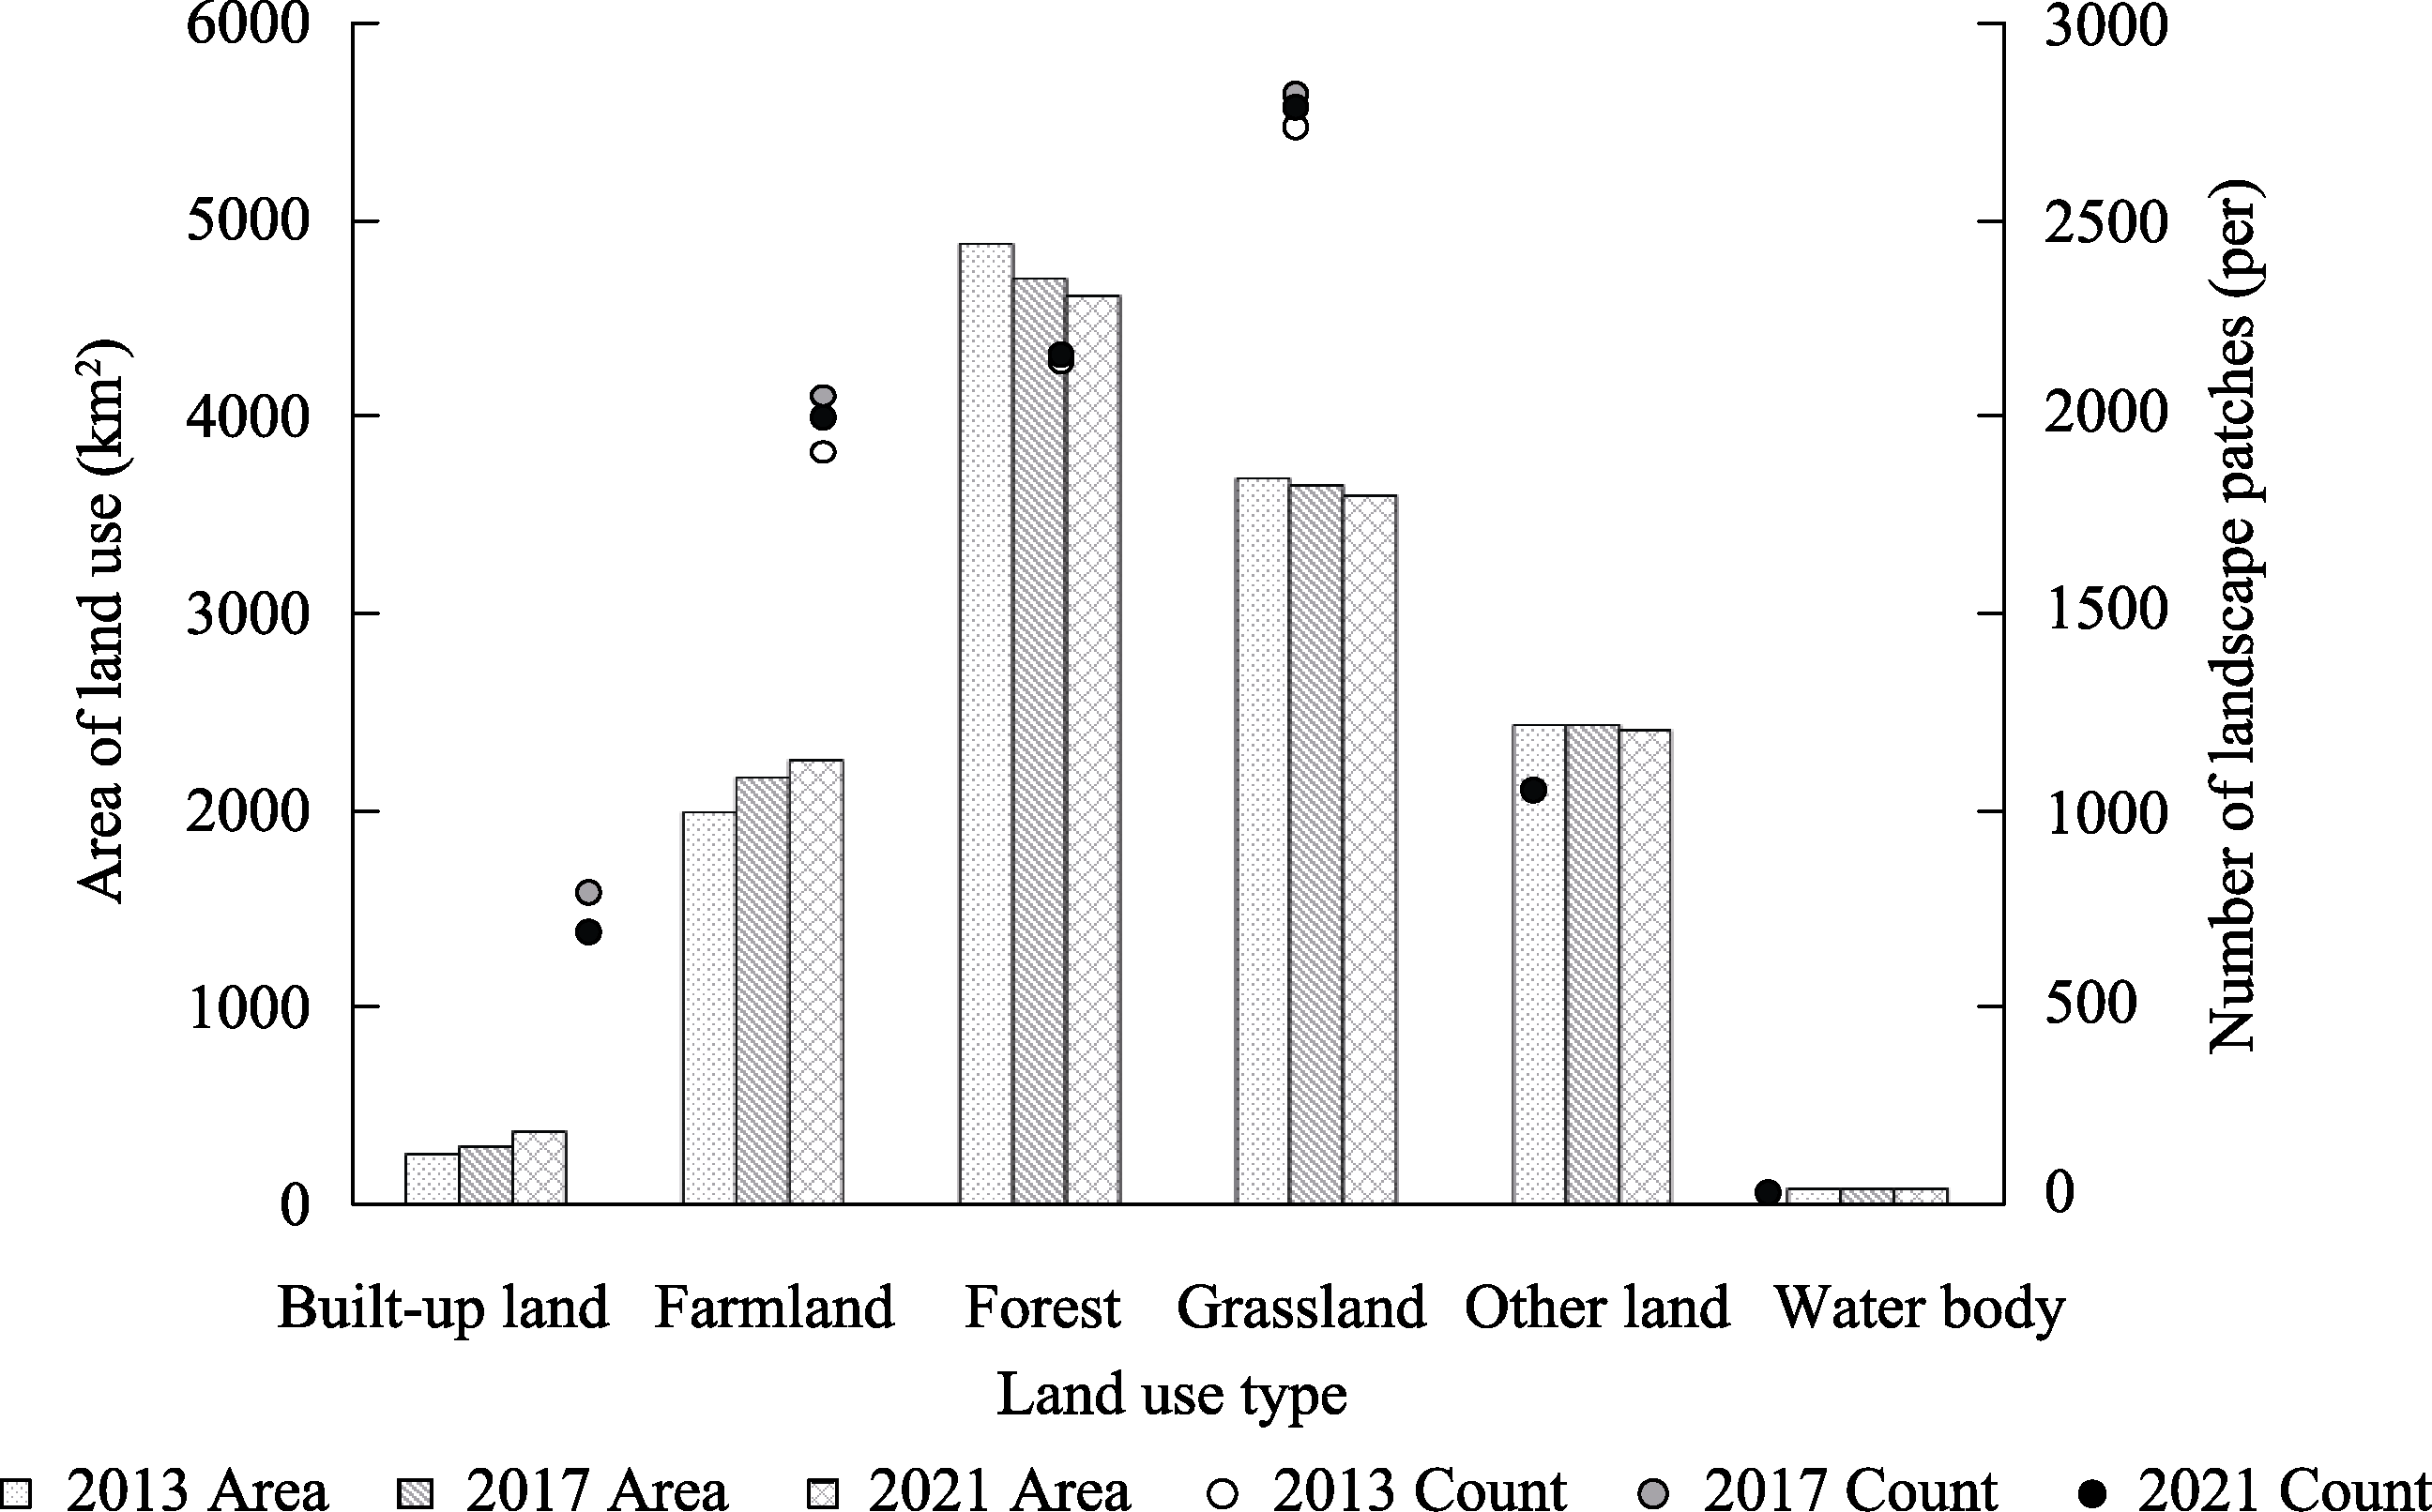
Figure 11
Change in land area and number of landscape patches in the Ethiopian section of the Addis Ababa-Djibouti Railway
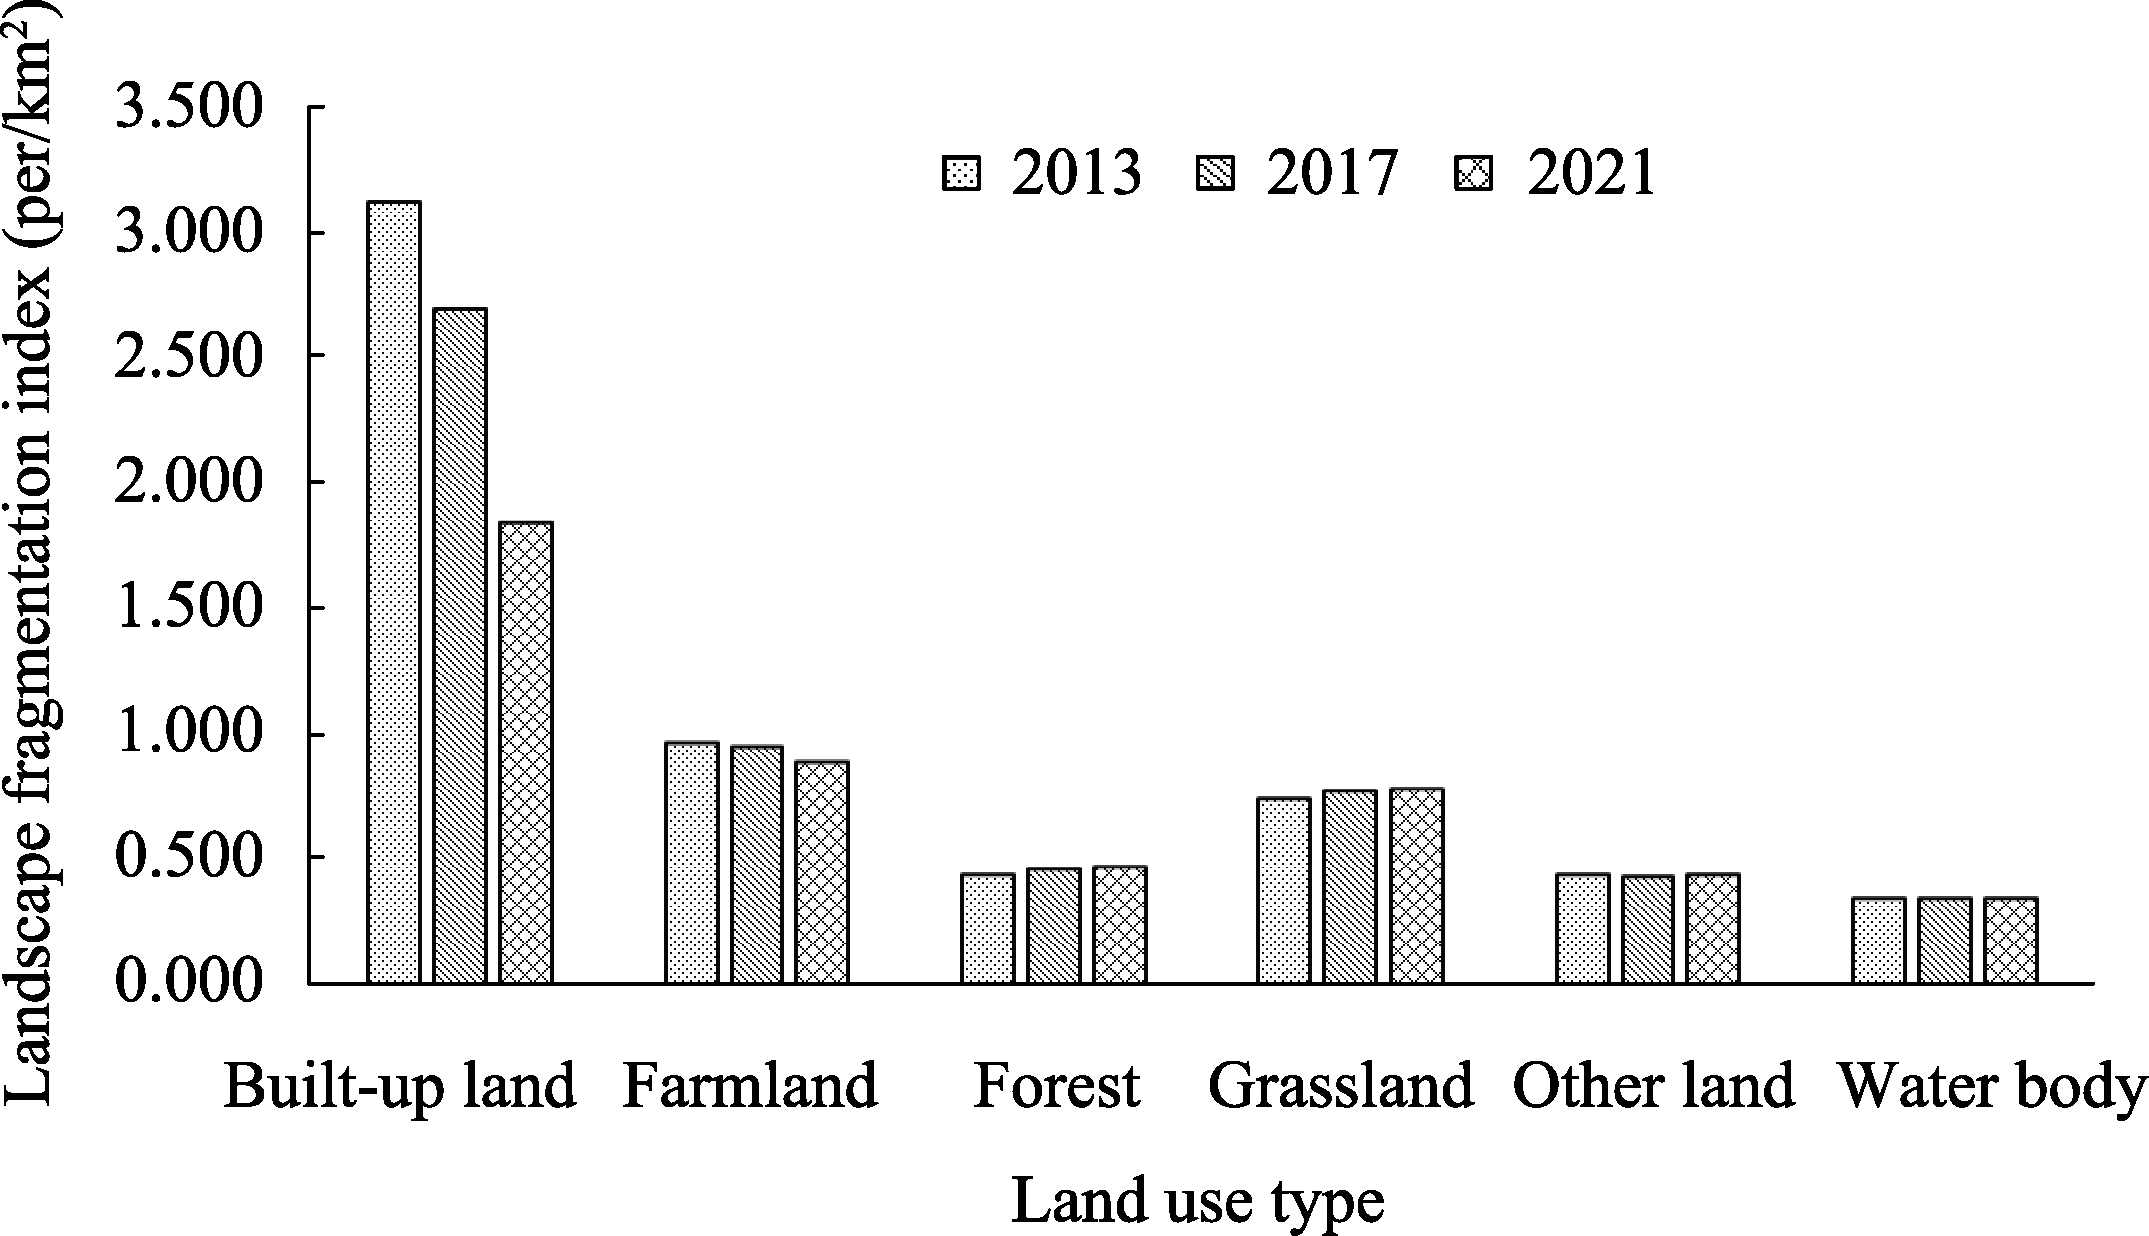
Figure 12
Landscape fragmentation index of different land use types in the Ethiopian section of the Addis Ababa-Djibouti Railway
Table 6
The influencing factors of built-up land expansion in the area around stations
Table 7
Fitting degree comparison between OLS Model and GWR Model in 2013 and 2021
Table 8
Estimation results of influencing factors of built-up land expansion based on OLS
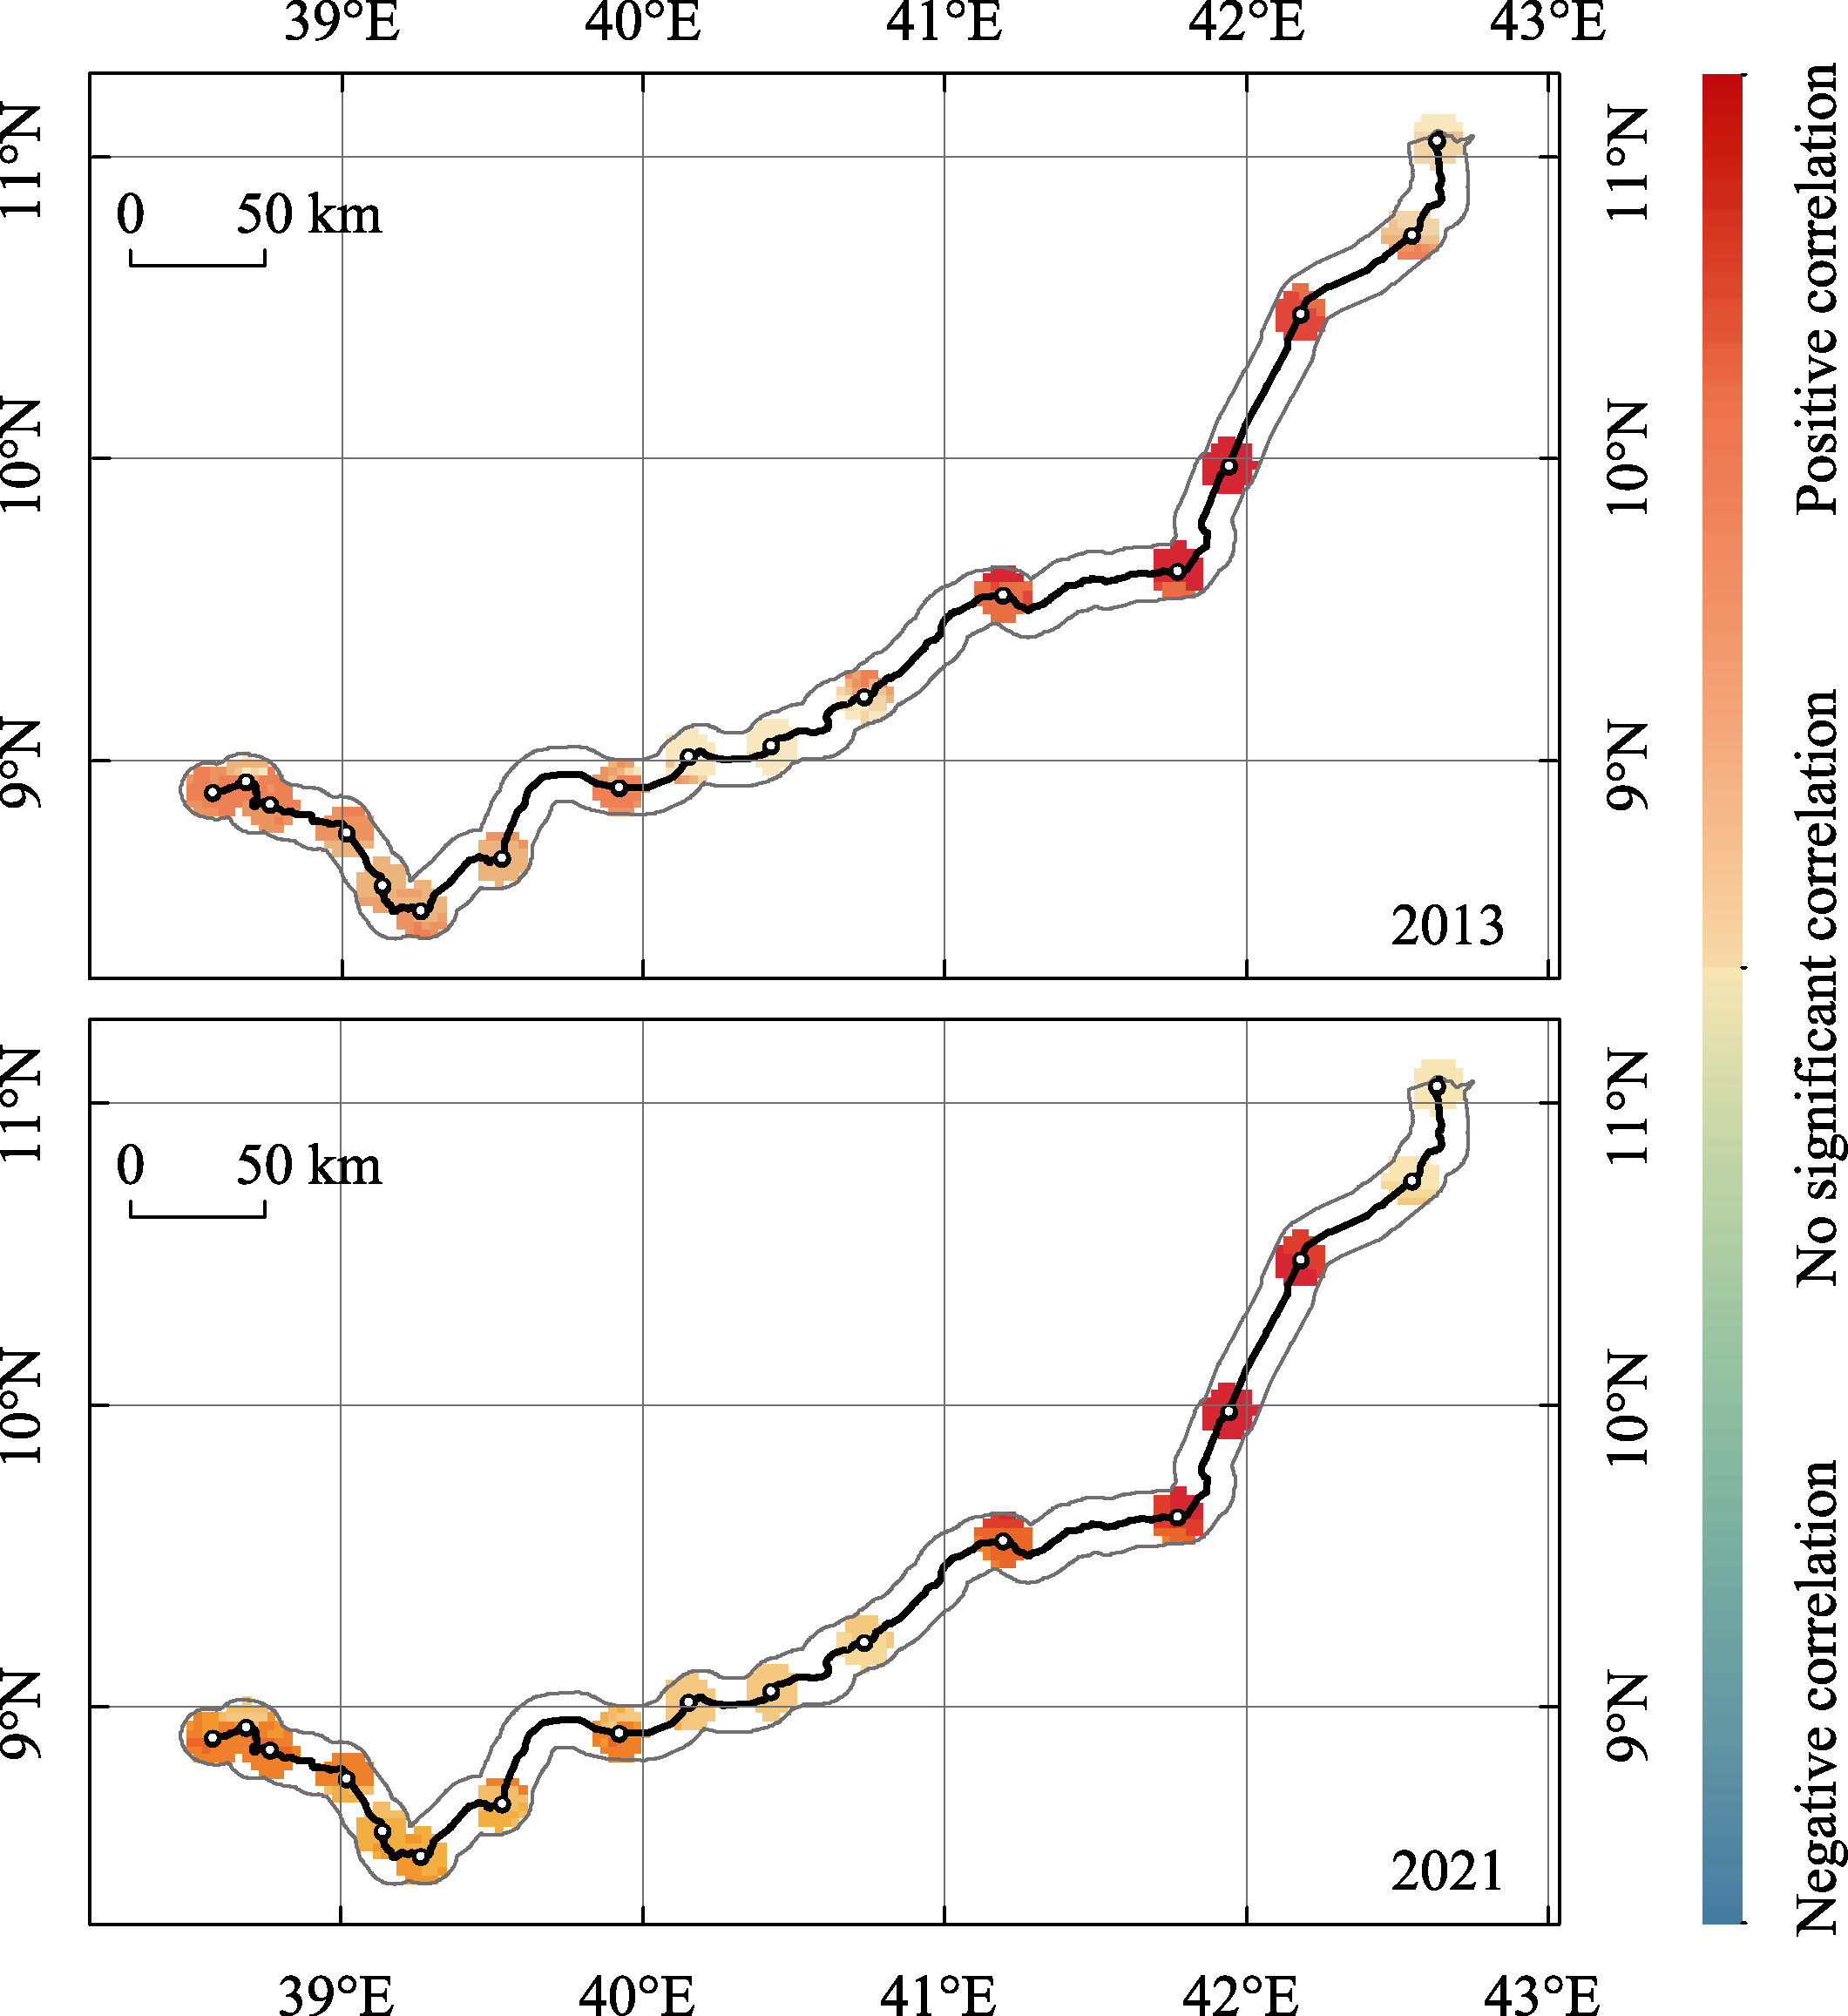
Figure 13
Spatial distribution of the distance from the train station in the GWR Model
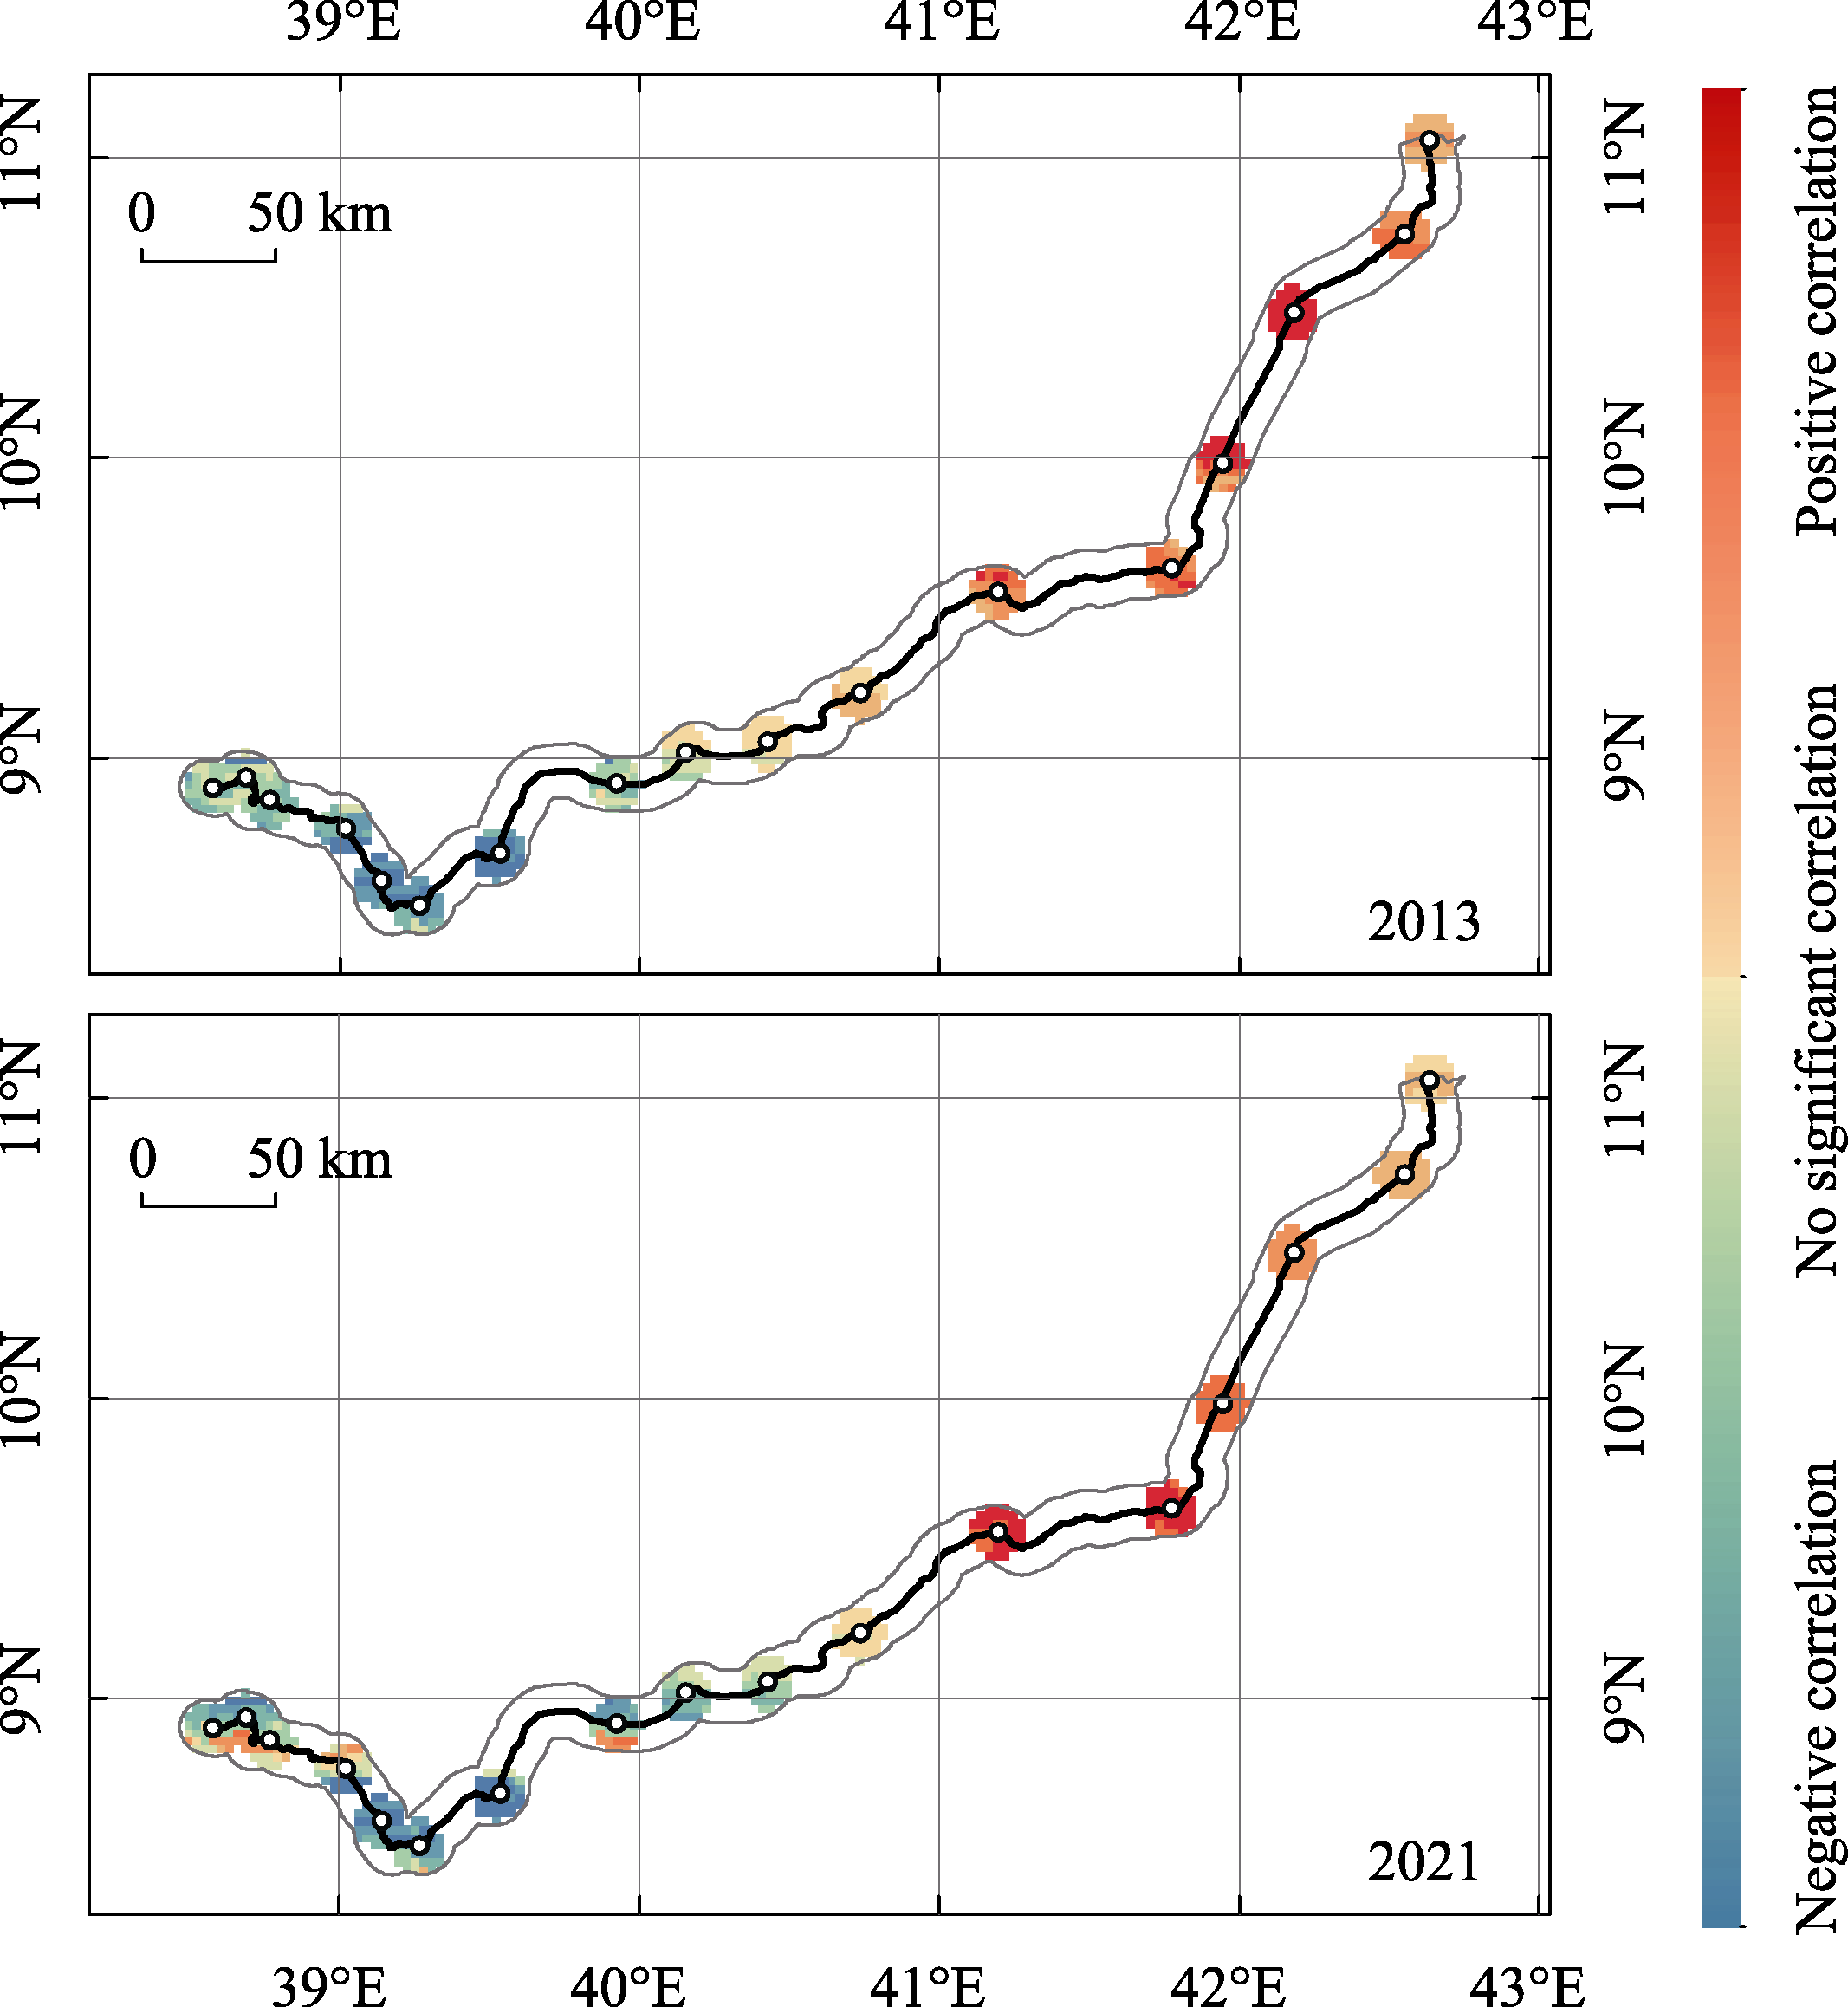
Figure 14
Spatial distribution of the population size in the GWR Model
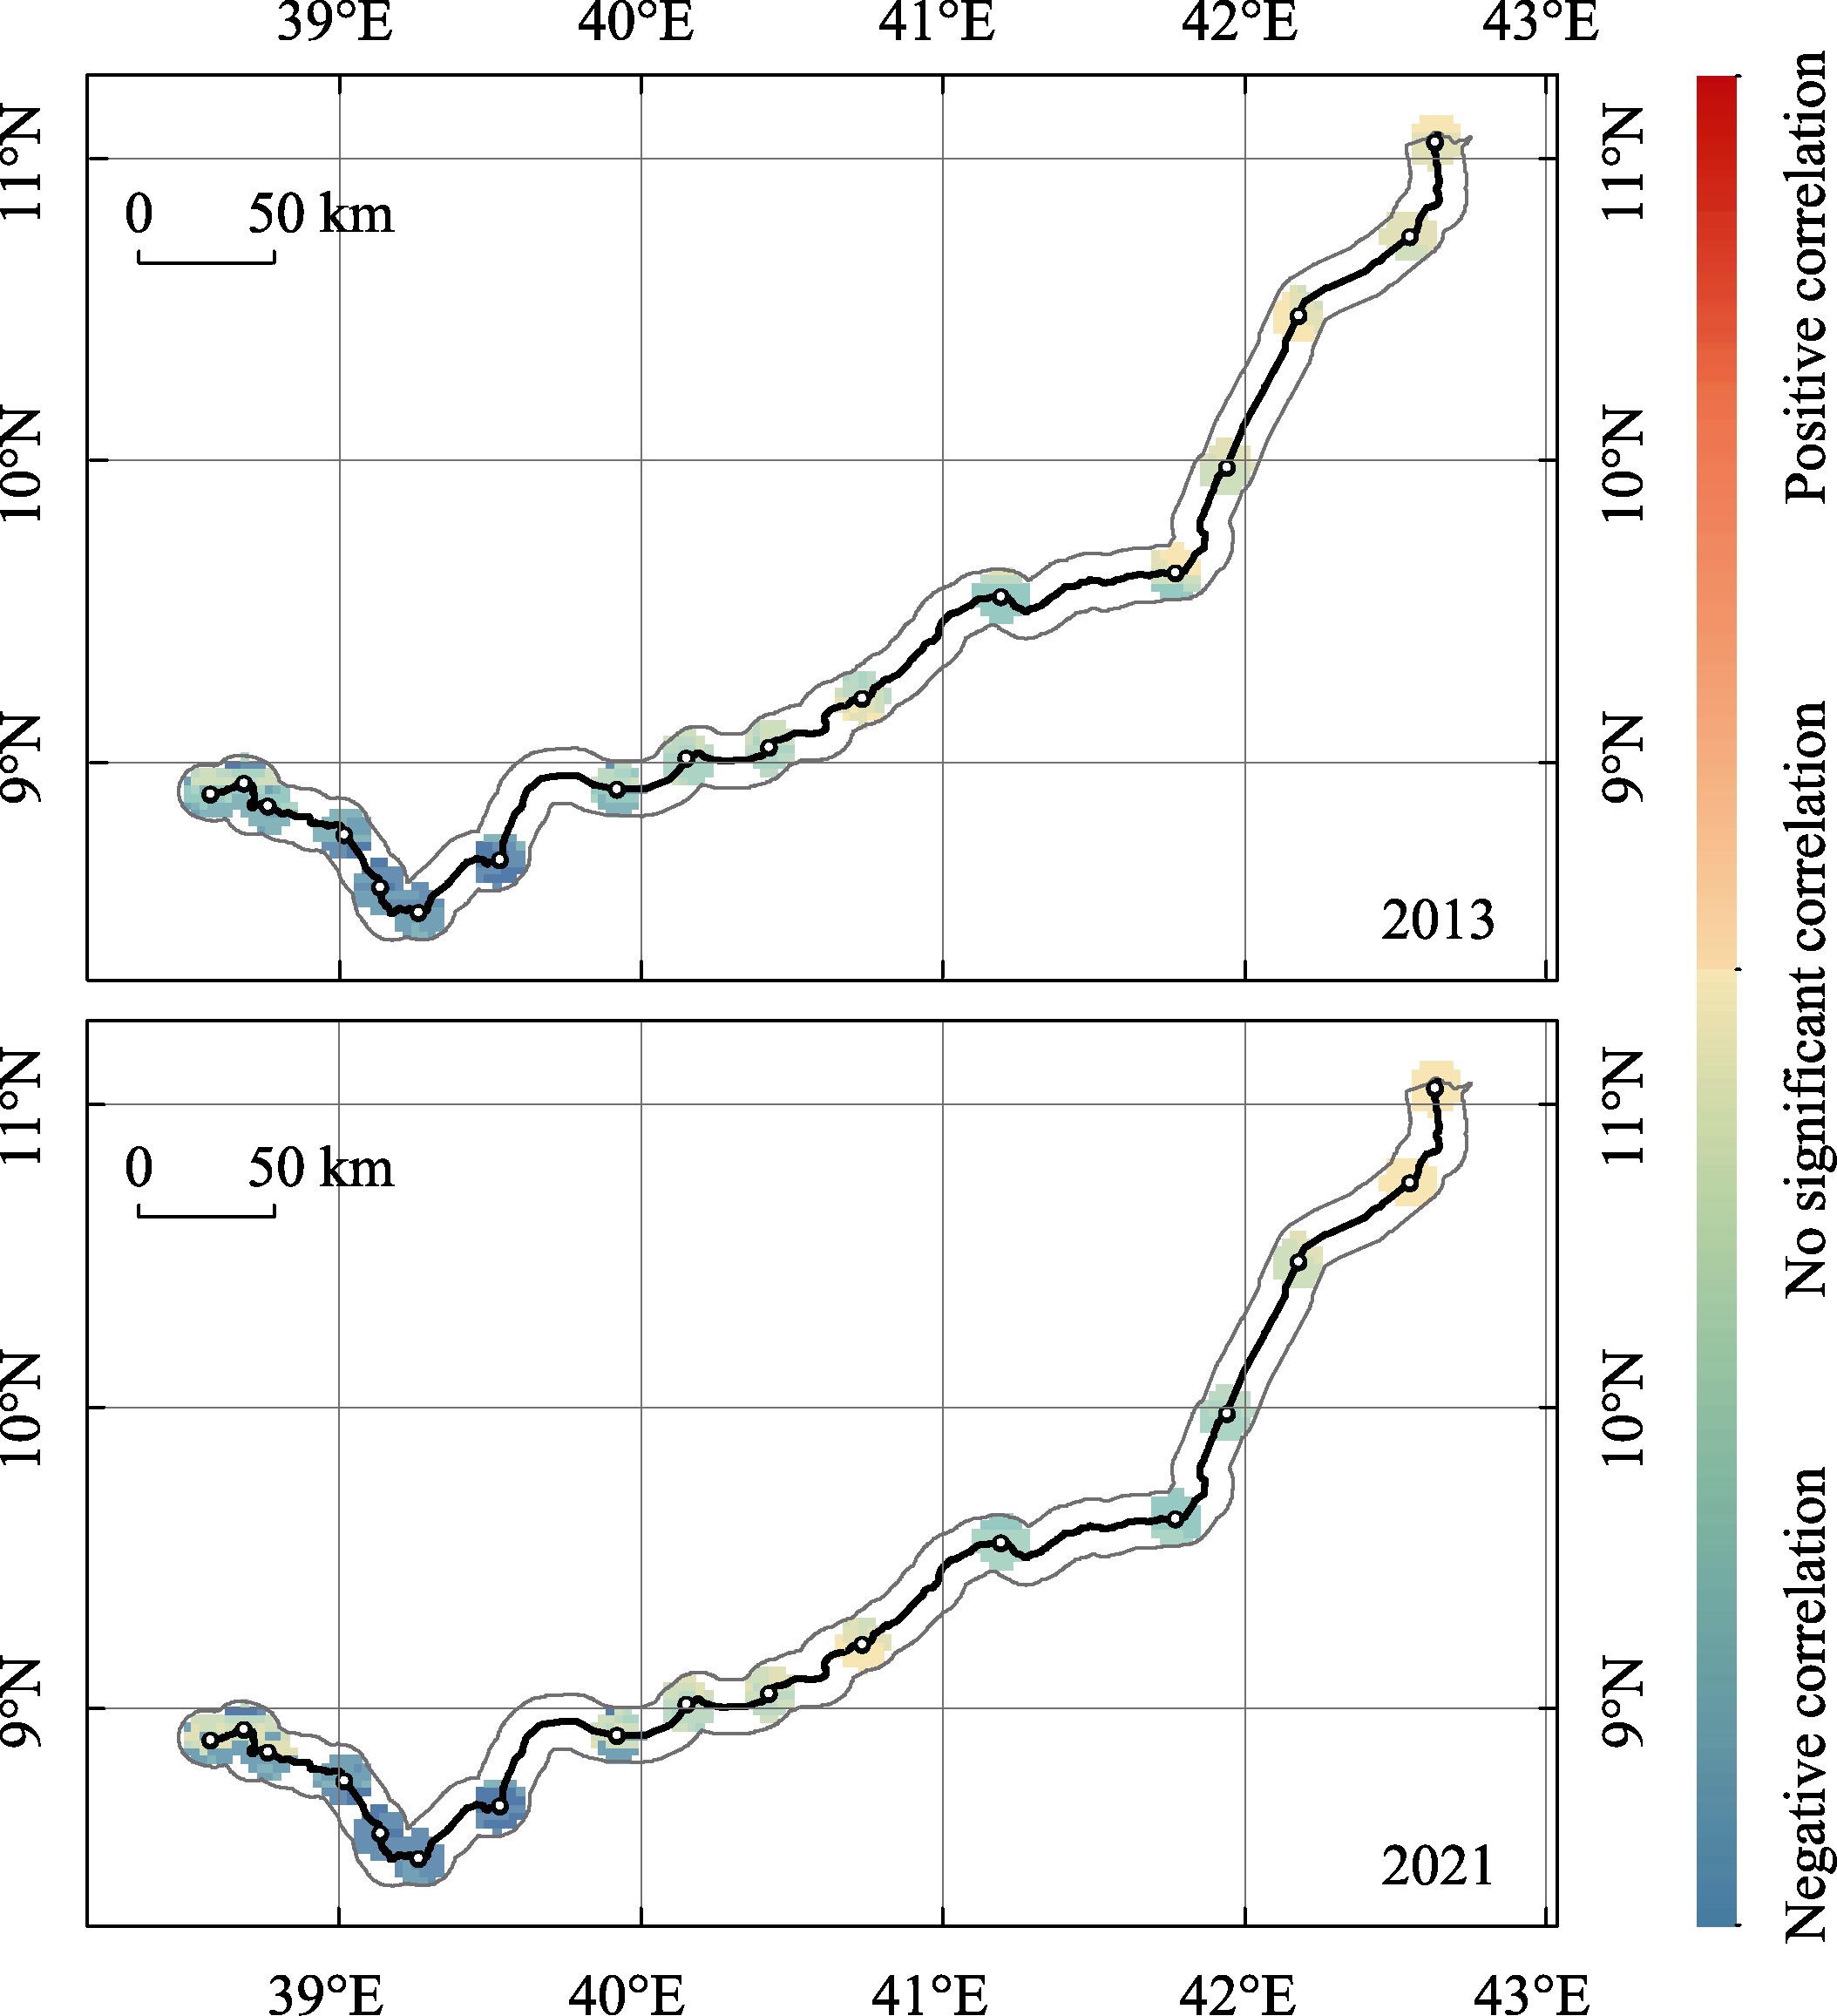
Figure 15
Spatial distribution of the distance from the central city in the GWR Model
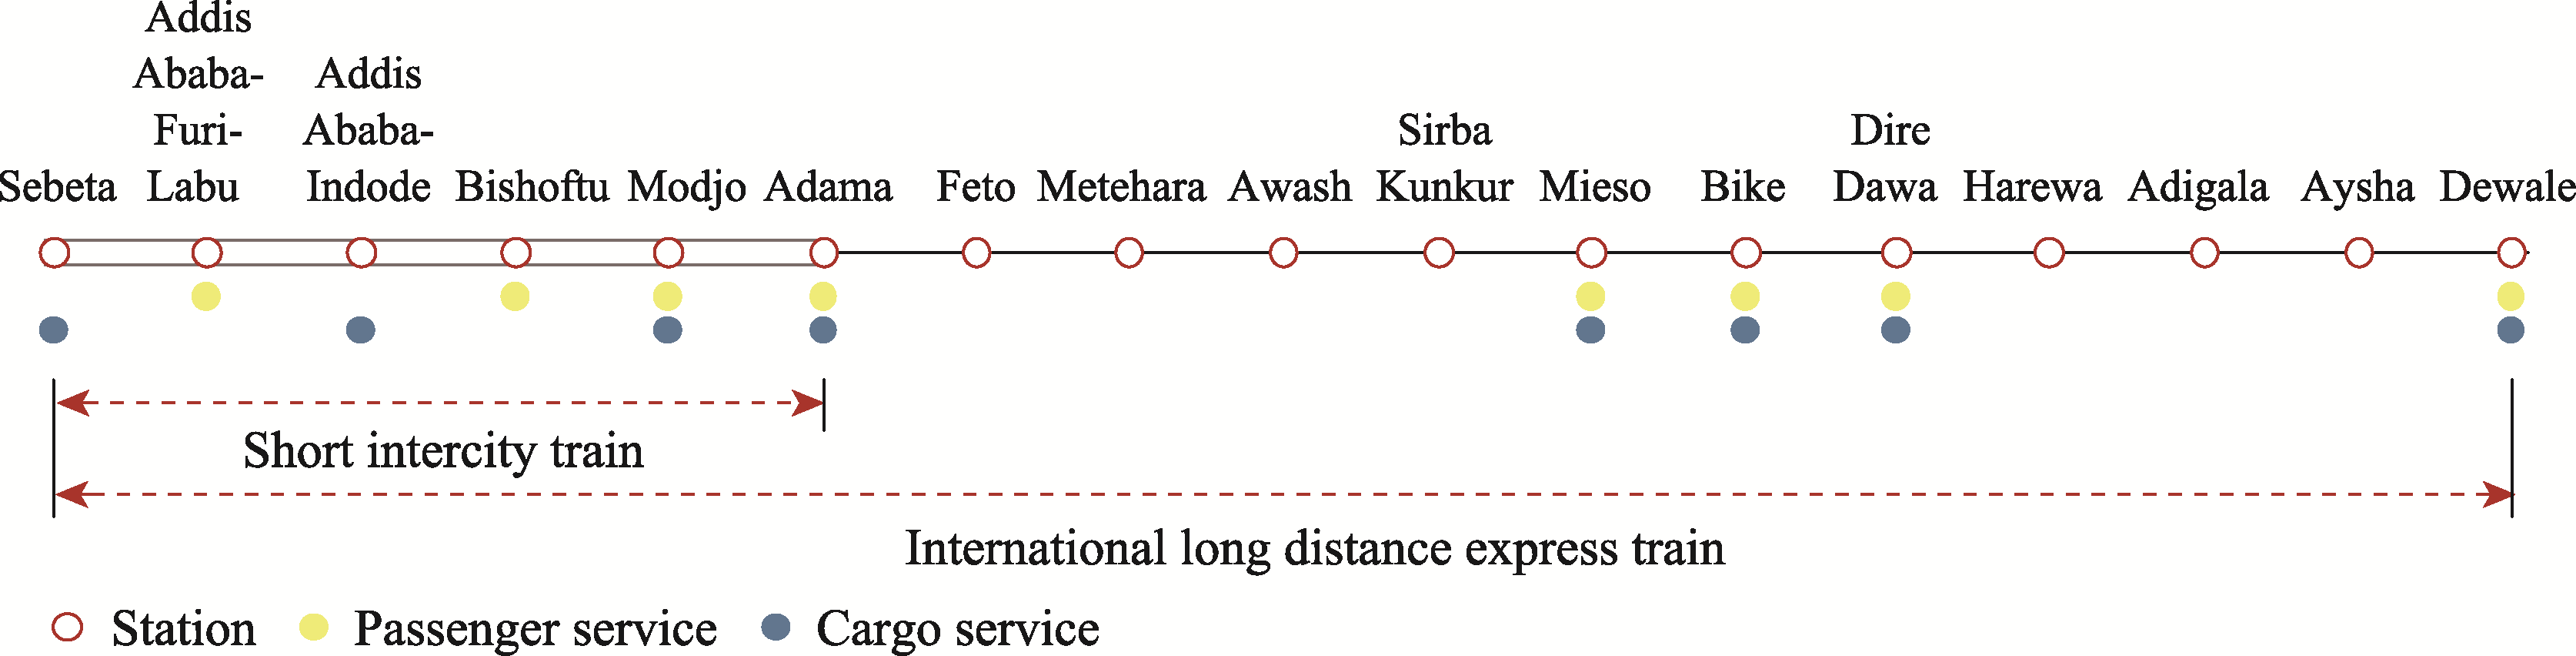
Figure 16
Operation strategy of the Ethiopian section of the Addis Ababa-Djibouti Railway