×
模态框(Modal)标题
在这里添加一些文本
关闭
关闭
提交更改
取消
确定并提交
×
模态框(Modal)标题
×
期刊
文章
图表
检索
EN
中文
首页
关于期刊
期刊介绍
数据库收录
期刊荣誉
编委会
投稿指南
在线期刊
当期目录
优先出版
过刊浏览
推荐文章
专题
按栏目浏览
阅读排行
下载排行
引用排行
E-mail Alert
RSS
期刊订阅
广告合作
联系我们
EN
中文
图/表 详细信息
Spatiotemporal heterogeneities in vegetation phenophase responses to climate extremes in arid mountains of Central Asia
ZHENG Lilin, CHEN Ruishan, XU Jianhua, JIA Nan, LI Yinshuai, LUO Yaxue
地理学报(英文版), 2025, 35(
9
): 1900-1922. DOI:
10.1007/s11442-025-2396-2
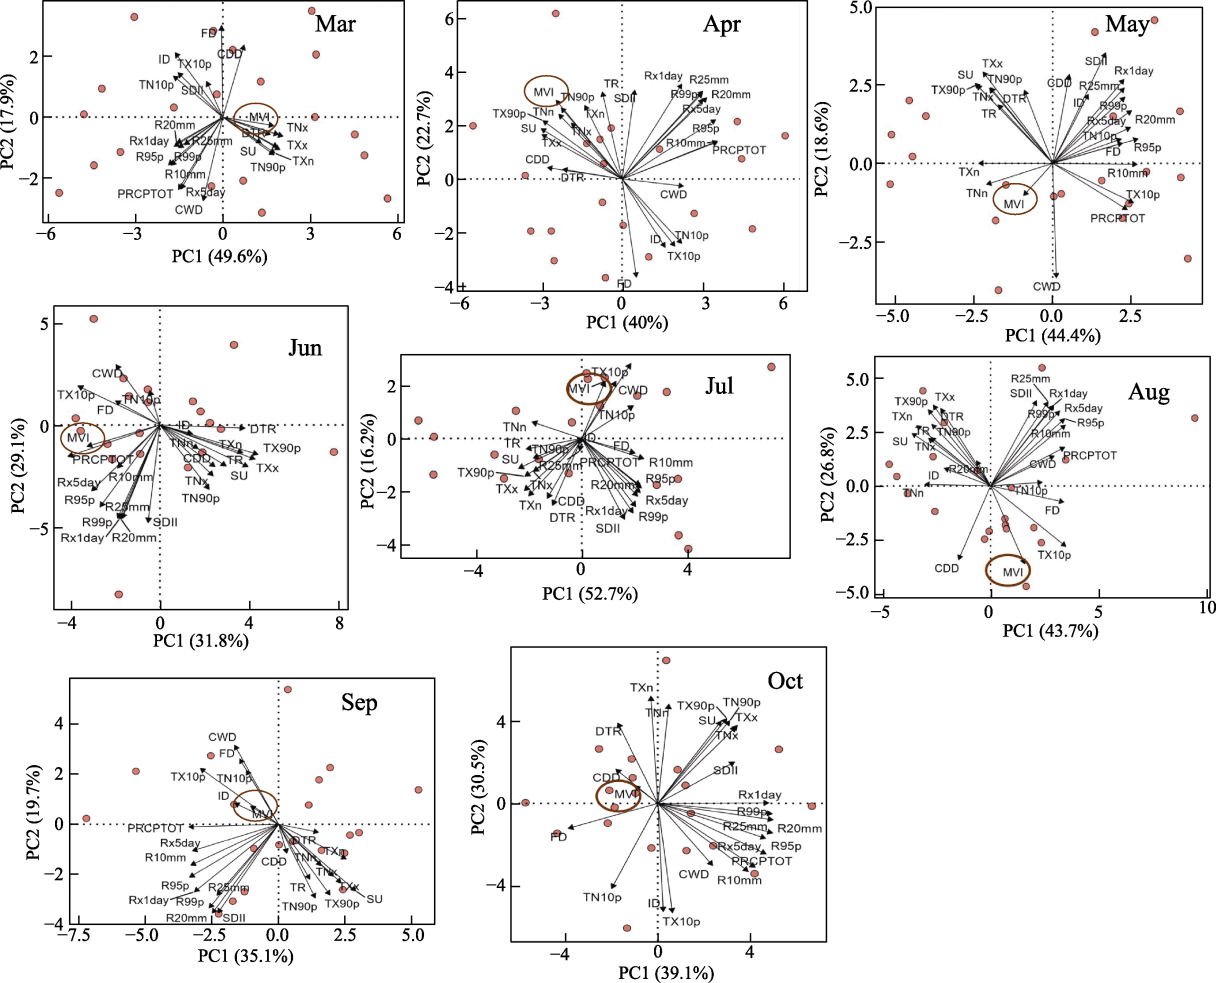
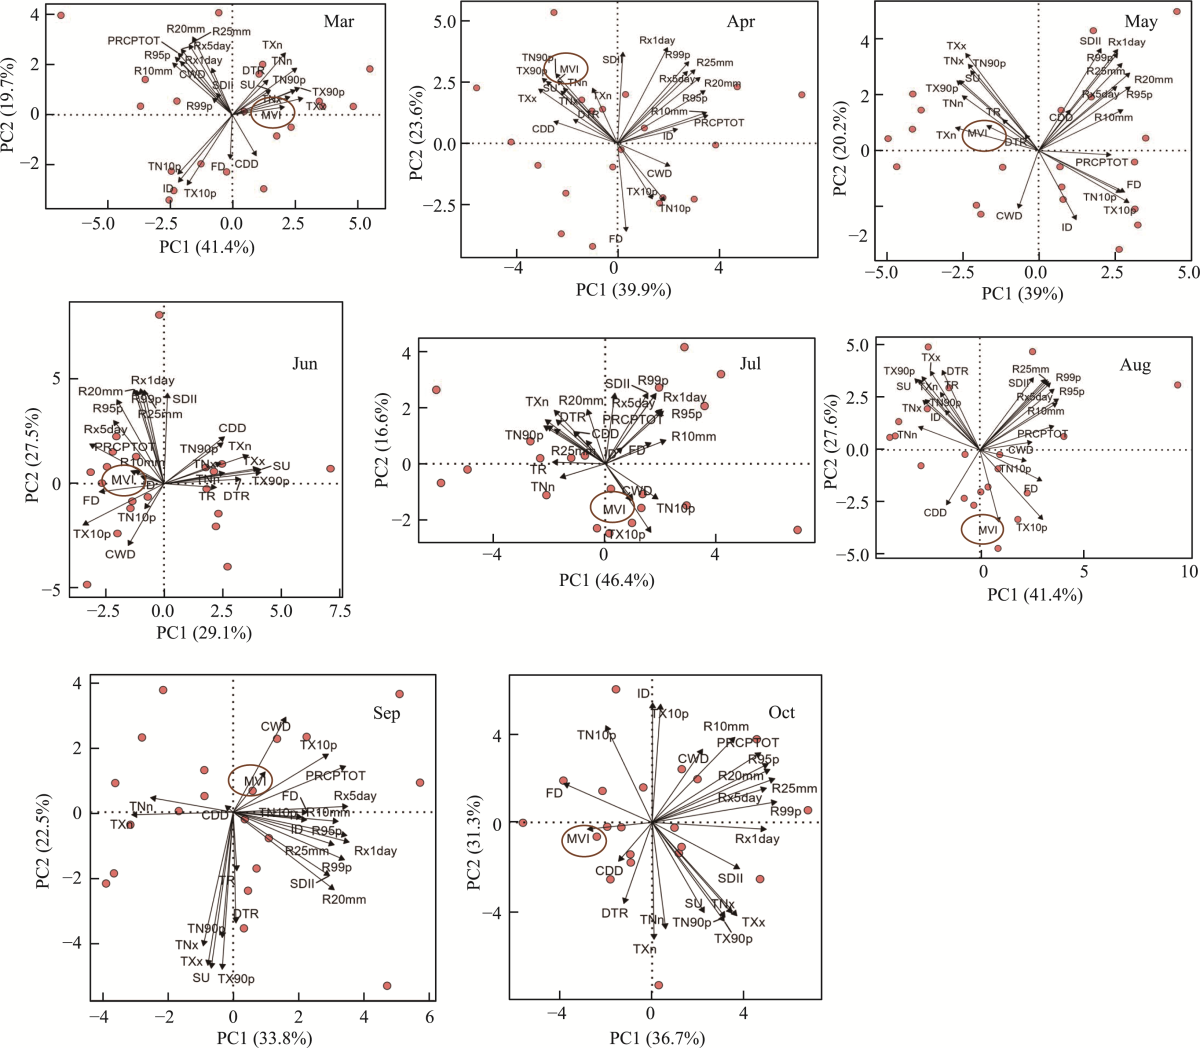
Figure 8
Principal Component Analysis loading diagram of monthly maximum NDPI (MVI) values of forest-grassland and extreme climate indices in each month during growing season (from March to October)
本文的其它图/表
Figure 1
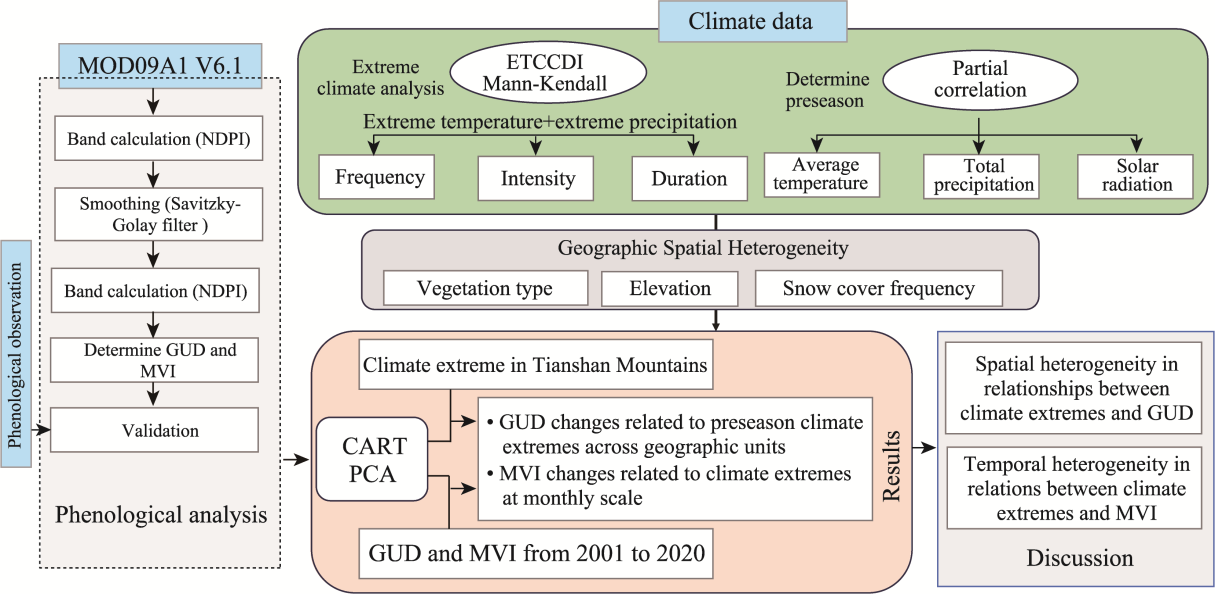
Flowchart showing the research methodology and structure of this article
Figure 2
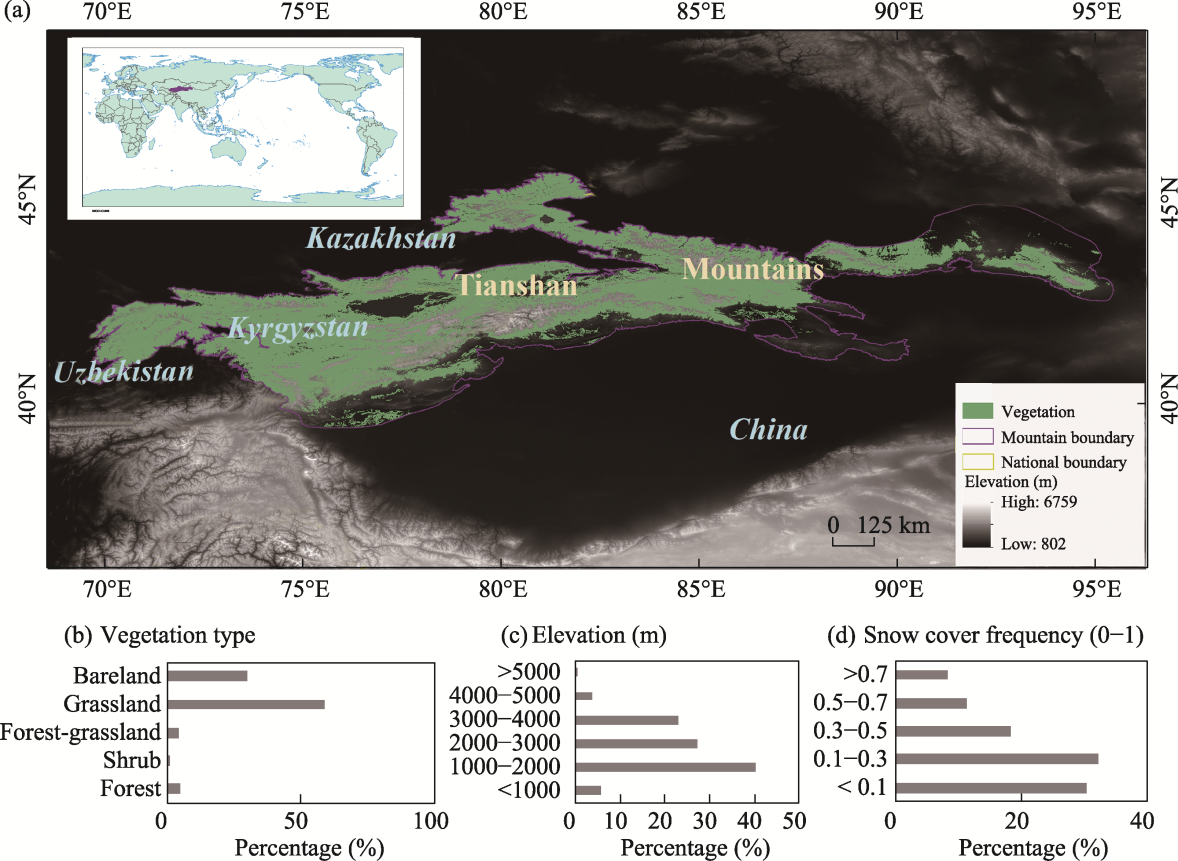
Location of the study area (a. Location of Tianshan Mountains; b. Vegetation type; c. Elevation; d. snow cover frequency)
Table 1
List of the ETCCDI core climate indices and their definitions (available online at
http://etccdi.pacificclimate.org/software.shtml
)
Table S1
Validation of extreme temperature indices from 1982 to 2020
Table S2
Validation of extreme precipitation indices from 1982 to 2020
Table 2
The mean values and change trends in climate extreme indices in the Tianshan Mountains during 1982-2020
Table S3
Details about the phenological stations and the validation results
Figure 3
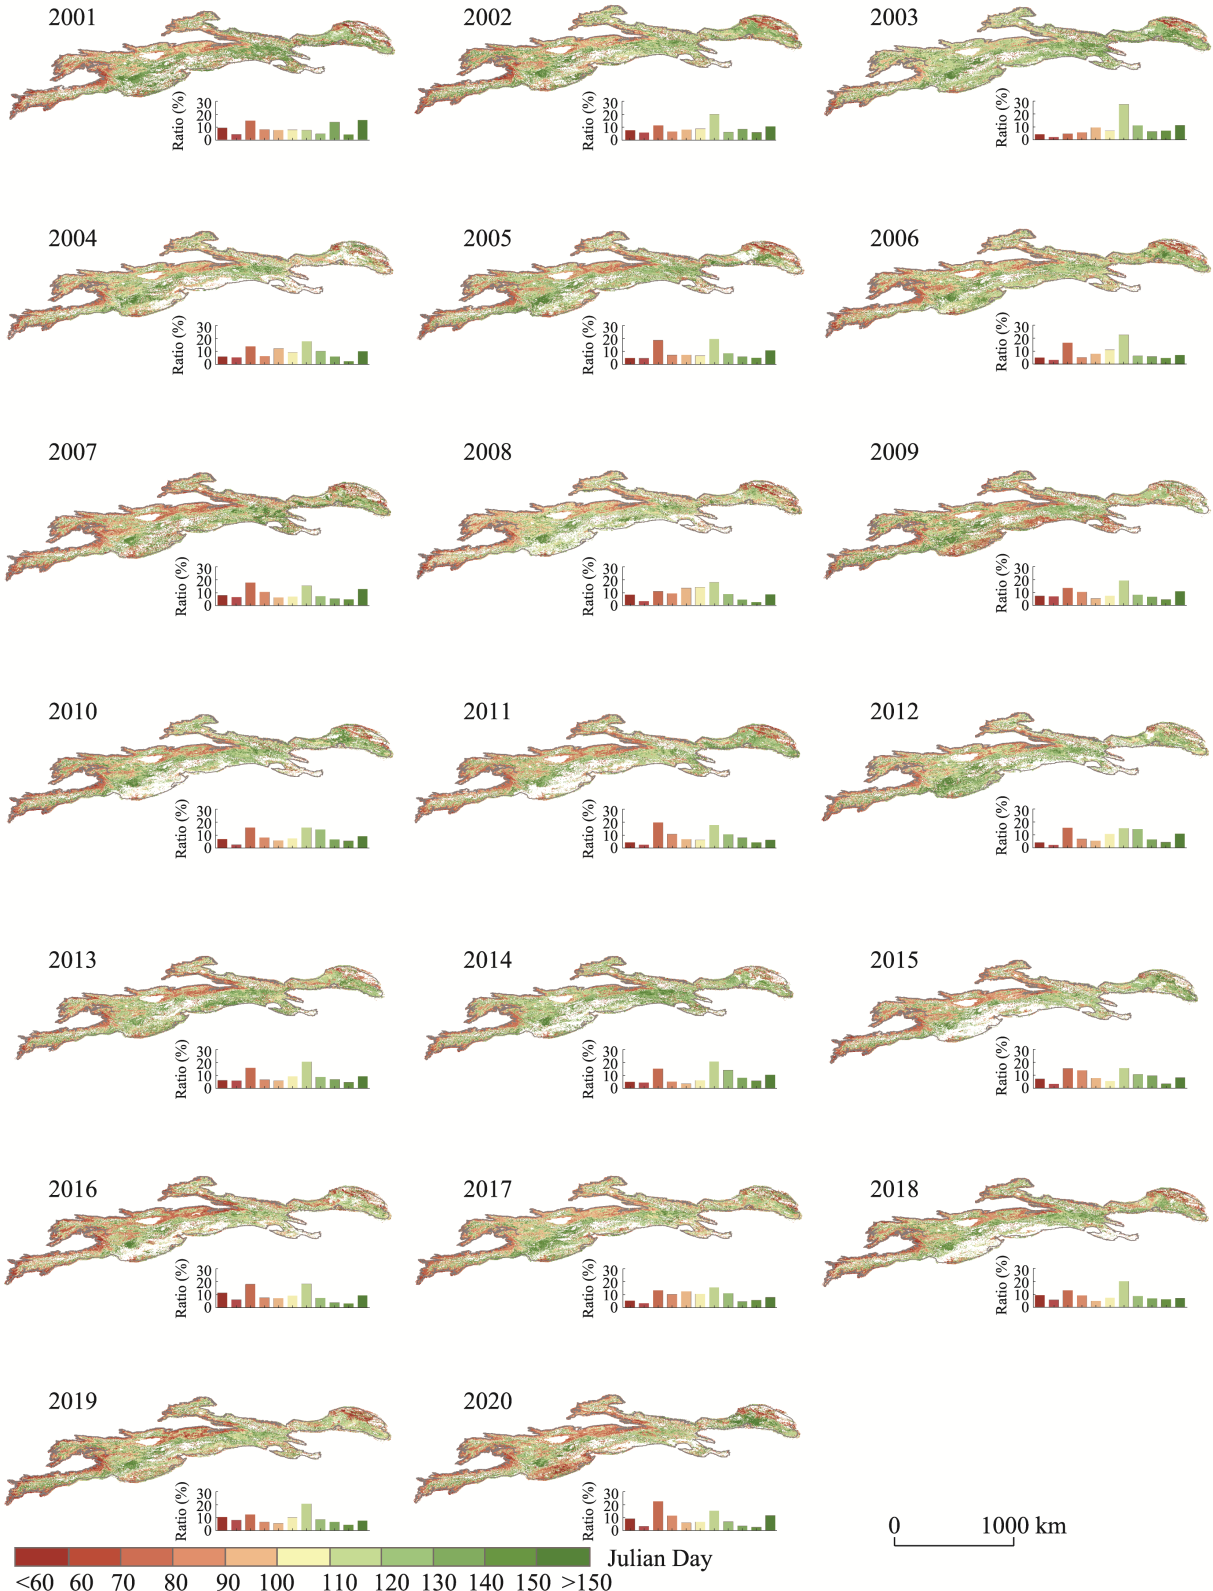
Spatial distributions of the vegetation green-up date in the Tianshan Mountains from 2001 to 2020 (The inset at the bottom left corner of each subfigure displays the frequency distributions of the corresponding green-up dates.)
Figure 4
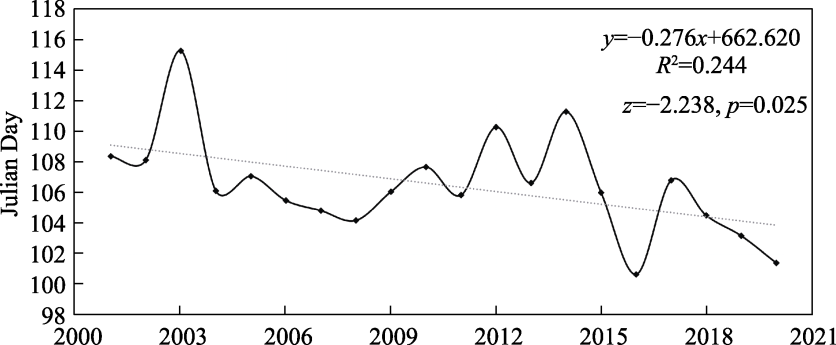
Interannual variations of vegetation green-up date in the Tianshan Mountains from 2001 to 2020
Figure 5
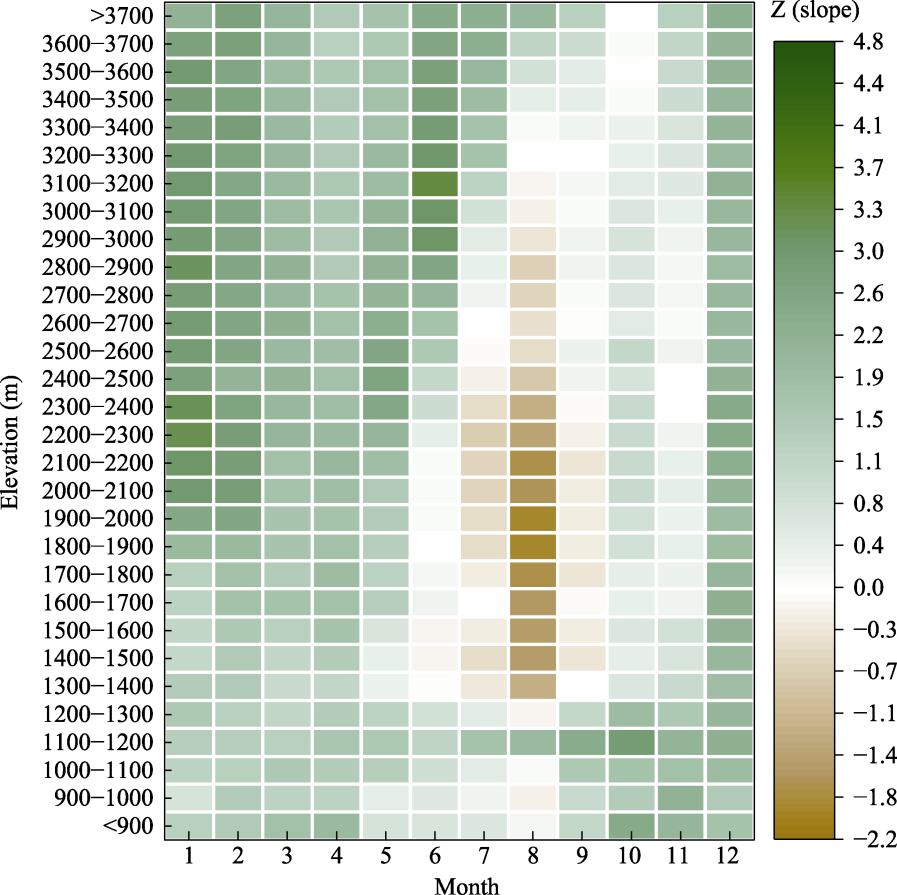
Change trends in monthly maximum vegetation index along elevation bands of Tianshan Mountains from 2001 to 2020 (Z value represents the change slope calculated by the Mann-Kendall trend test (greening: Z > 0; browning: Z < 0).)
Table S4
Spatial statistics of second-order partial relationship between vegetation green-up date and the daytime temperature, nighttime temperature, and total precipitation within 1-6 months before the green-up date
Figure 6
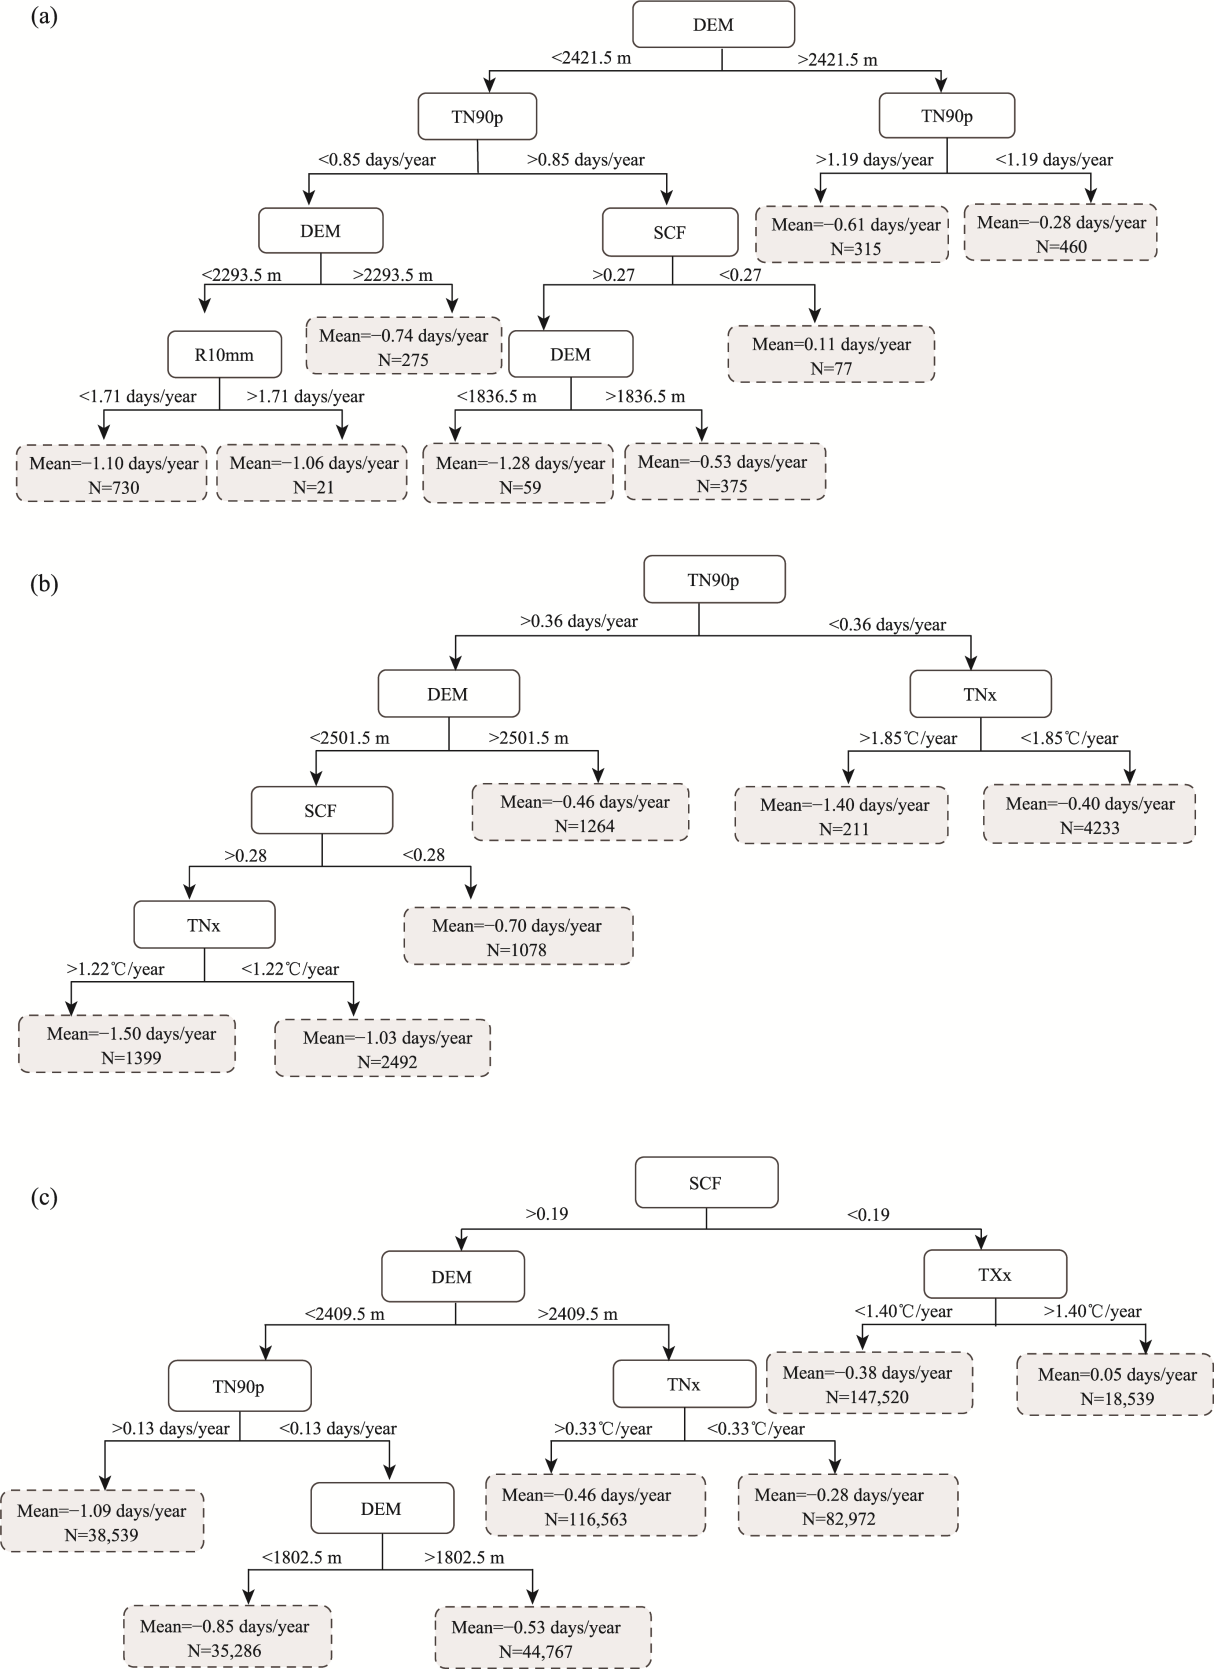
The CART model illustrating the impact of preseason climate extreme indices on the green-up date (GUD) in the Tianshan Mountains (a. forest; b. forest-grassland; c. grassland)
Figure S1
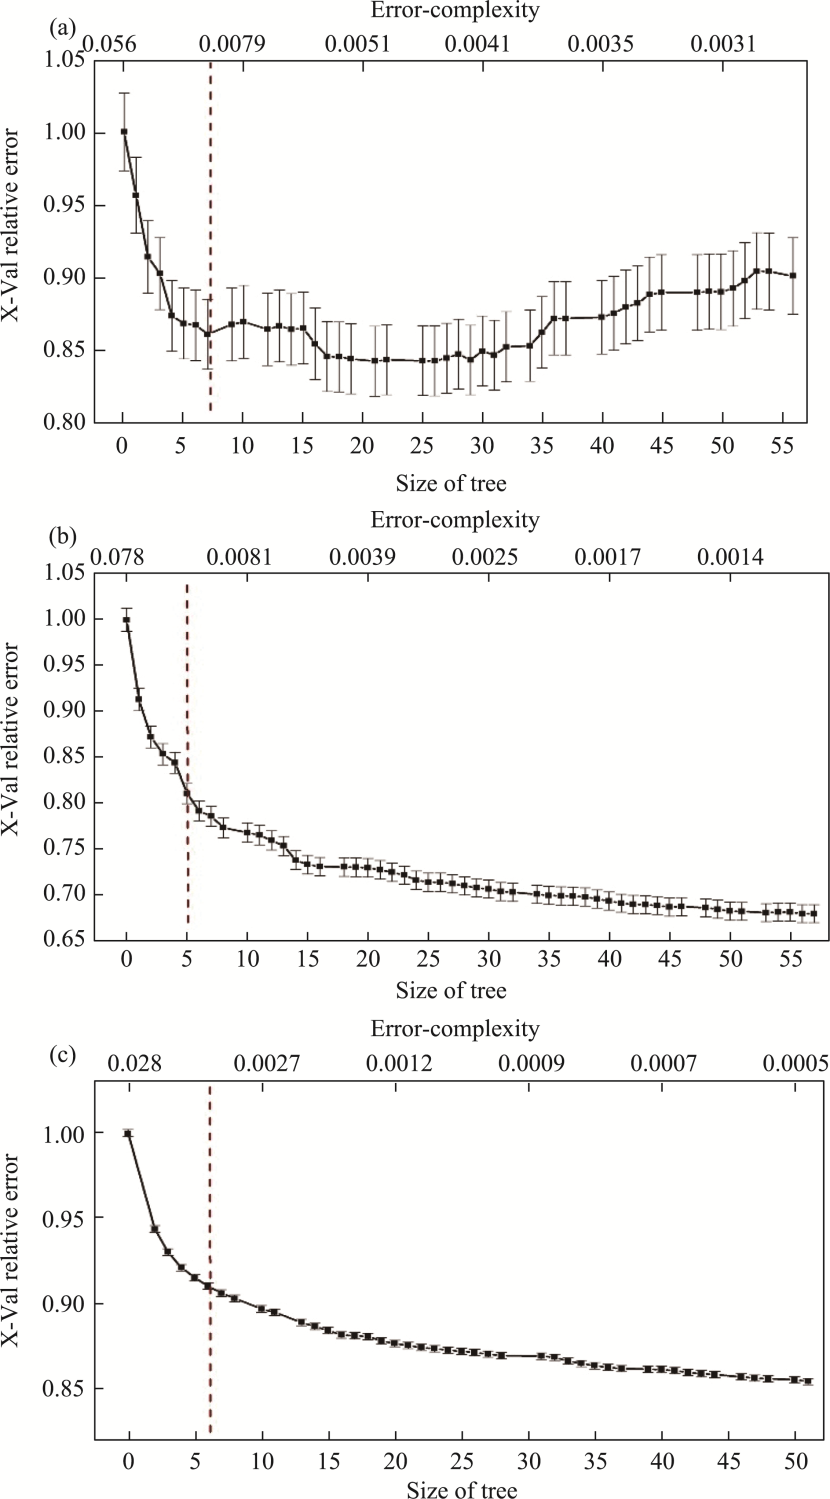
The cost complexity and X-Val relative error of the final CART tree (a. forest; b. forest-grassland; c. grassland)
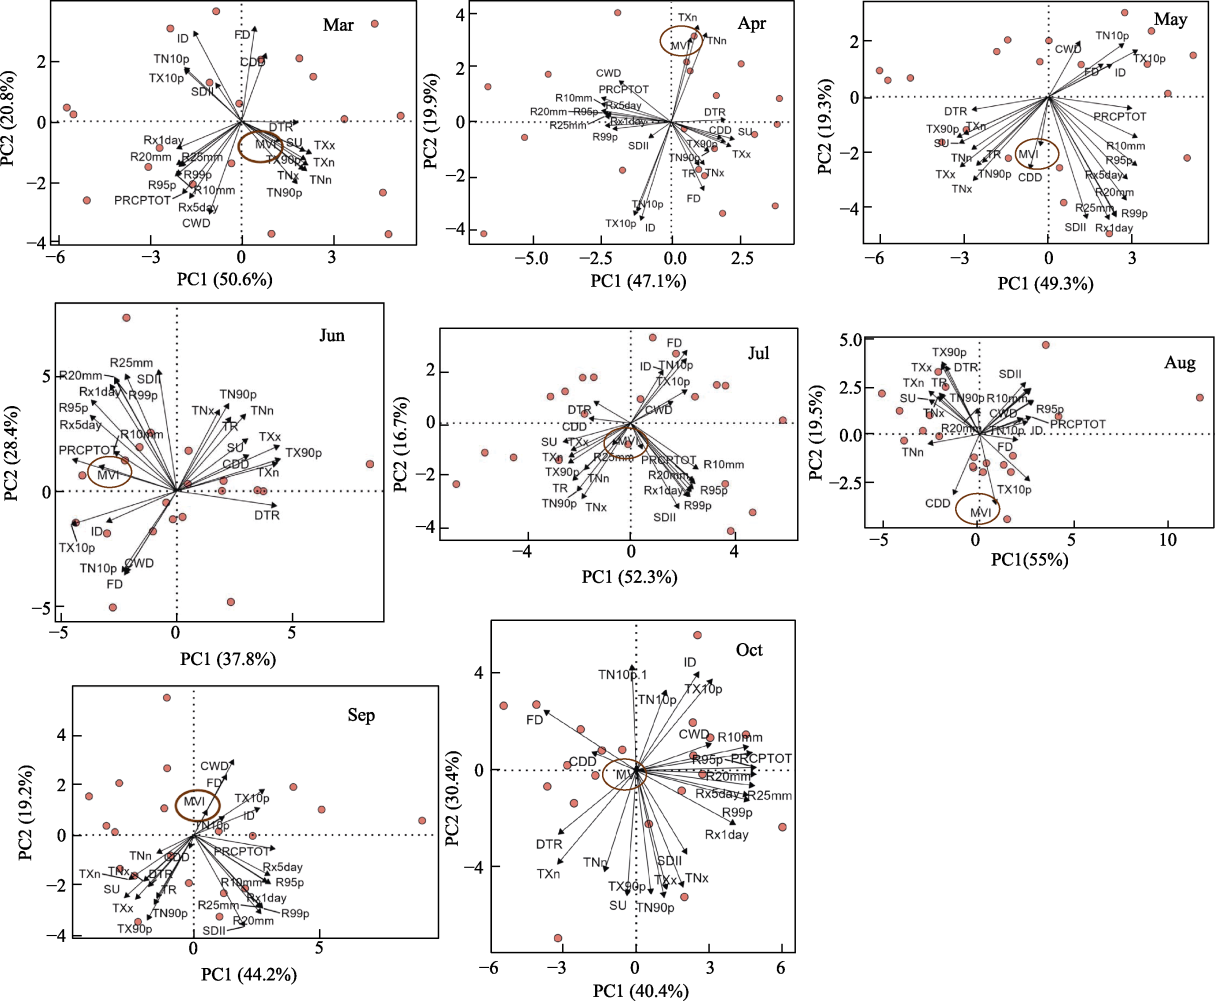
Figure 7
Principal Component Analysis loading diagram of monthly maximum NDPI (MVI) values of forest and extreme climate indices in each month during growing season (from March to October)
Figure 9
Principal Component Analysis loading diagram of monthly maximum NDPI (MVI) values of grassland and extreme climate indices in each month during growing season (from March to October)