| Type | Name | Indicator | Grouping by resource | Grouping by economy | Grouping by area size | Grouping by urbanization | ||||
|---|---|---|---|---|---|---|---|---|---|---|
| Cultural | Natural | Developed | Underdeveloped | Large | Small | Extra- urban | Intra- urban | |||
| Format: B (sig t ) [* p<0.05 ** p<0.01] | ||||||||||
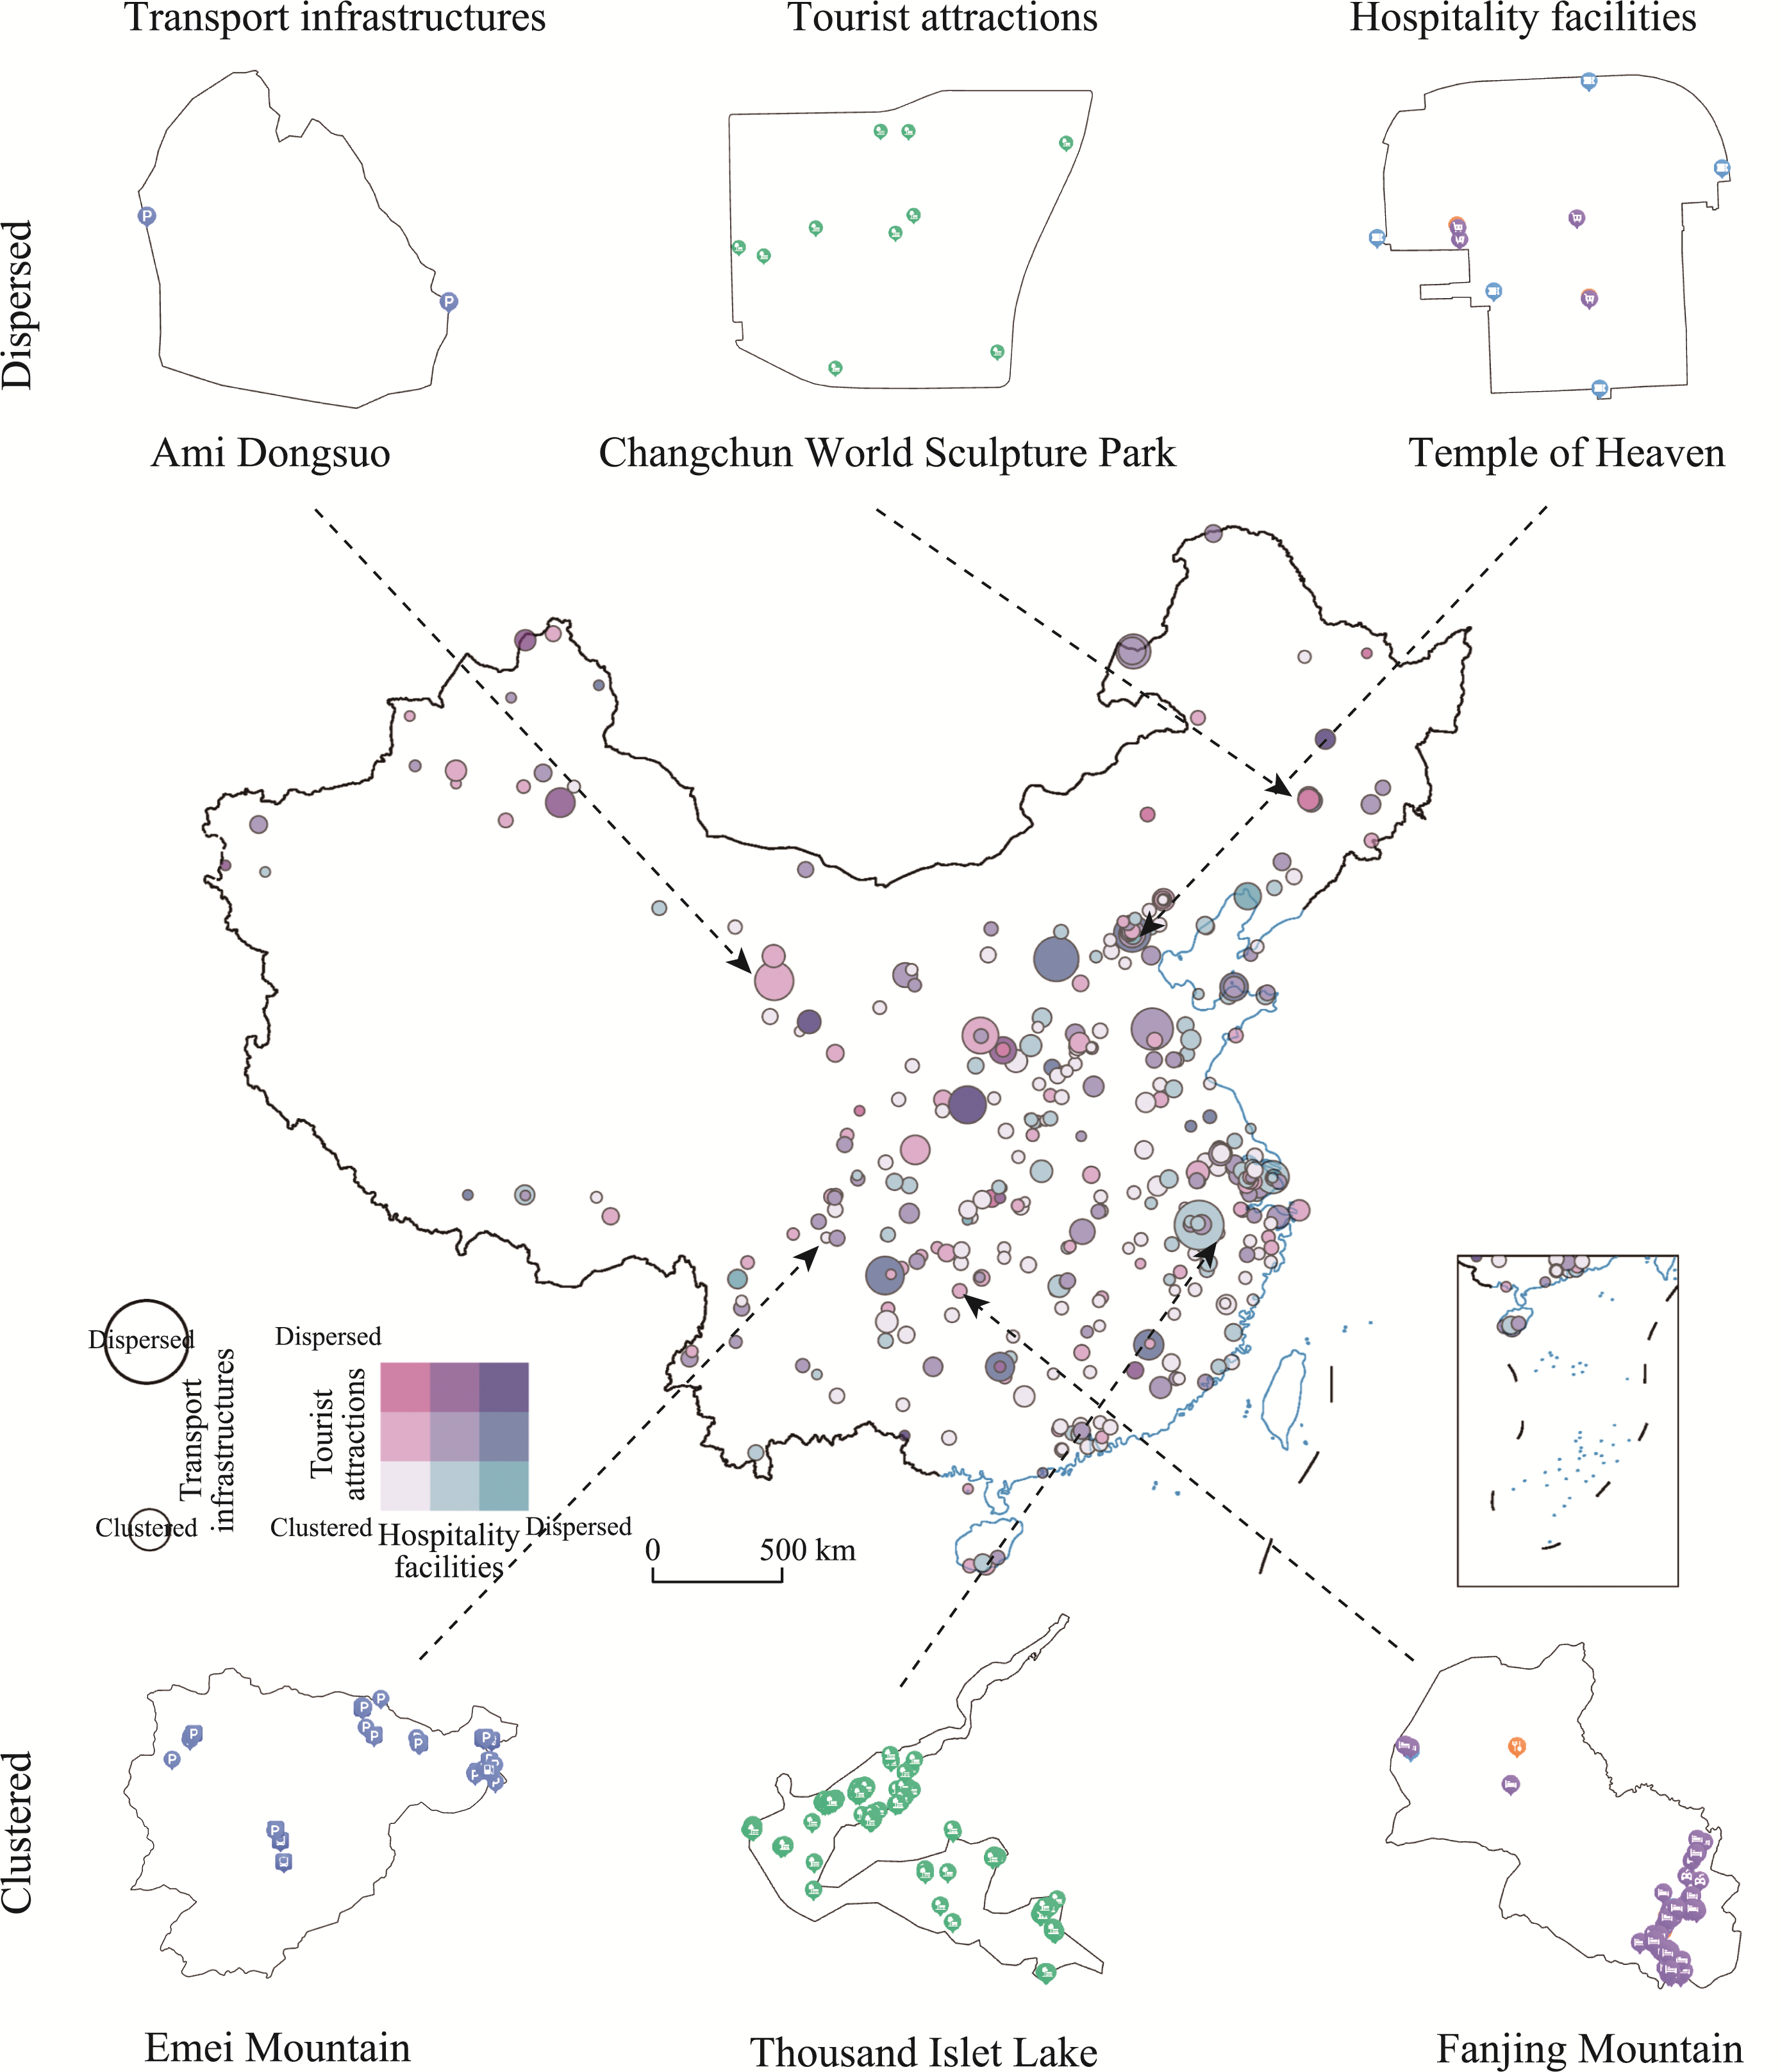
| Points | Tourist Attractions | Average Nearest Neighbor Index | 0.133 (0.783) | 0.038 (0.484) | 0.138 (1.343) | 0.000 (0.000) | 0.084 (0.784) | 0.153 (1.660) | 0.038 (0.446) | -0.007 (-0.052) |
| Hospitality Facilities | Average Nearest Neighbor Index | -0.019 (-0.151) | -0.060 (-0.636) | -0.121 (-1.216) | 0.066 (0.503) | 0.225 (1.340) | -0.123 (-1.399) | -0.055 (-0.492) | -0.013 (-0.123) | |
| Transport Infrastructures | Average Nearest Neighbor Index | -0.095 (-0.832) | -0.116 (-1.299) | -0.030 (-0.330) | -0.161 (-1.382) | -0.341* (-2.275) | -0.052 (-0.650) | -0.071 (-0.801) | -0.107 (-0.866) | |
| Type | Name | Indicator | Grouping by resource | Grouping by economy | Grouping by area size | Grouping by urbanization | ||||
| Cultural | Natural | Developed | Underdeveloped | Large | Small | Extra- urban | Intra- urban | |||
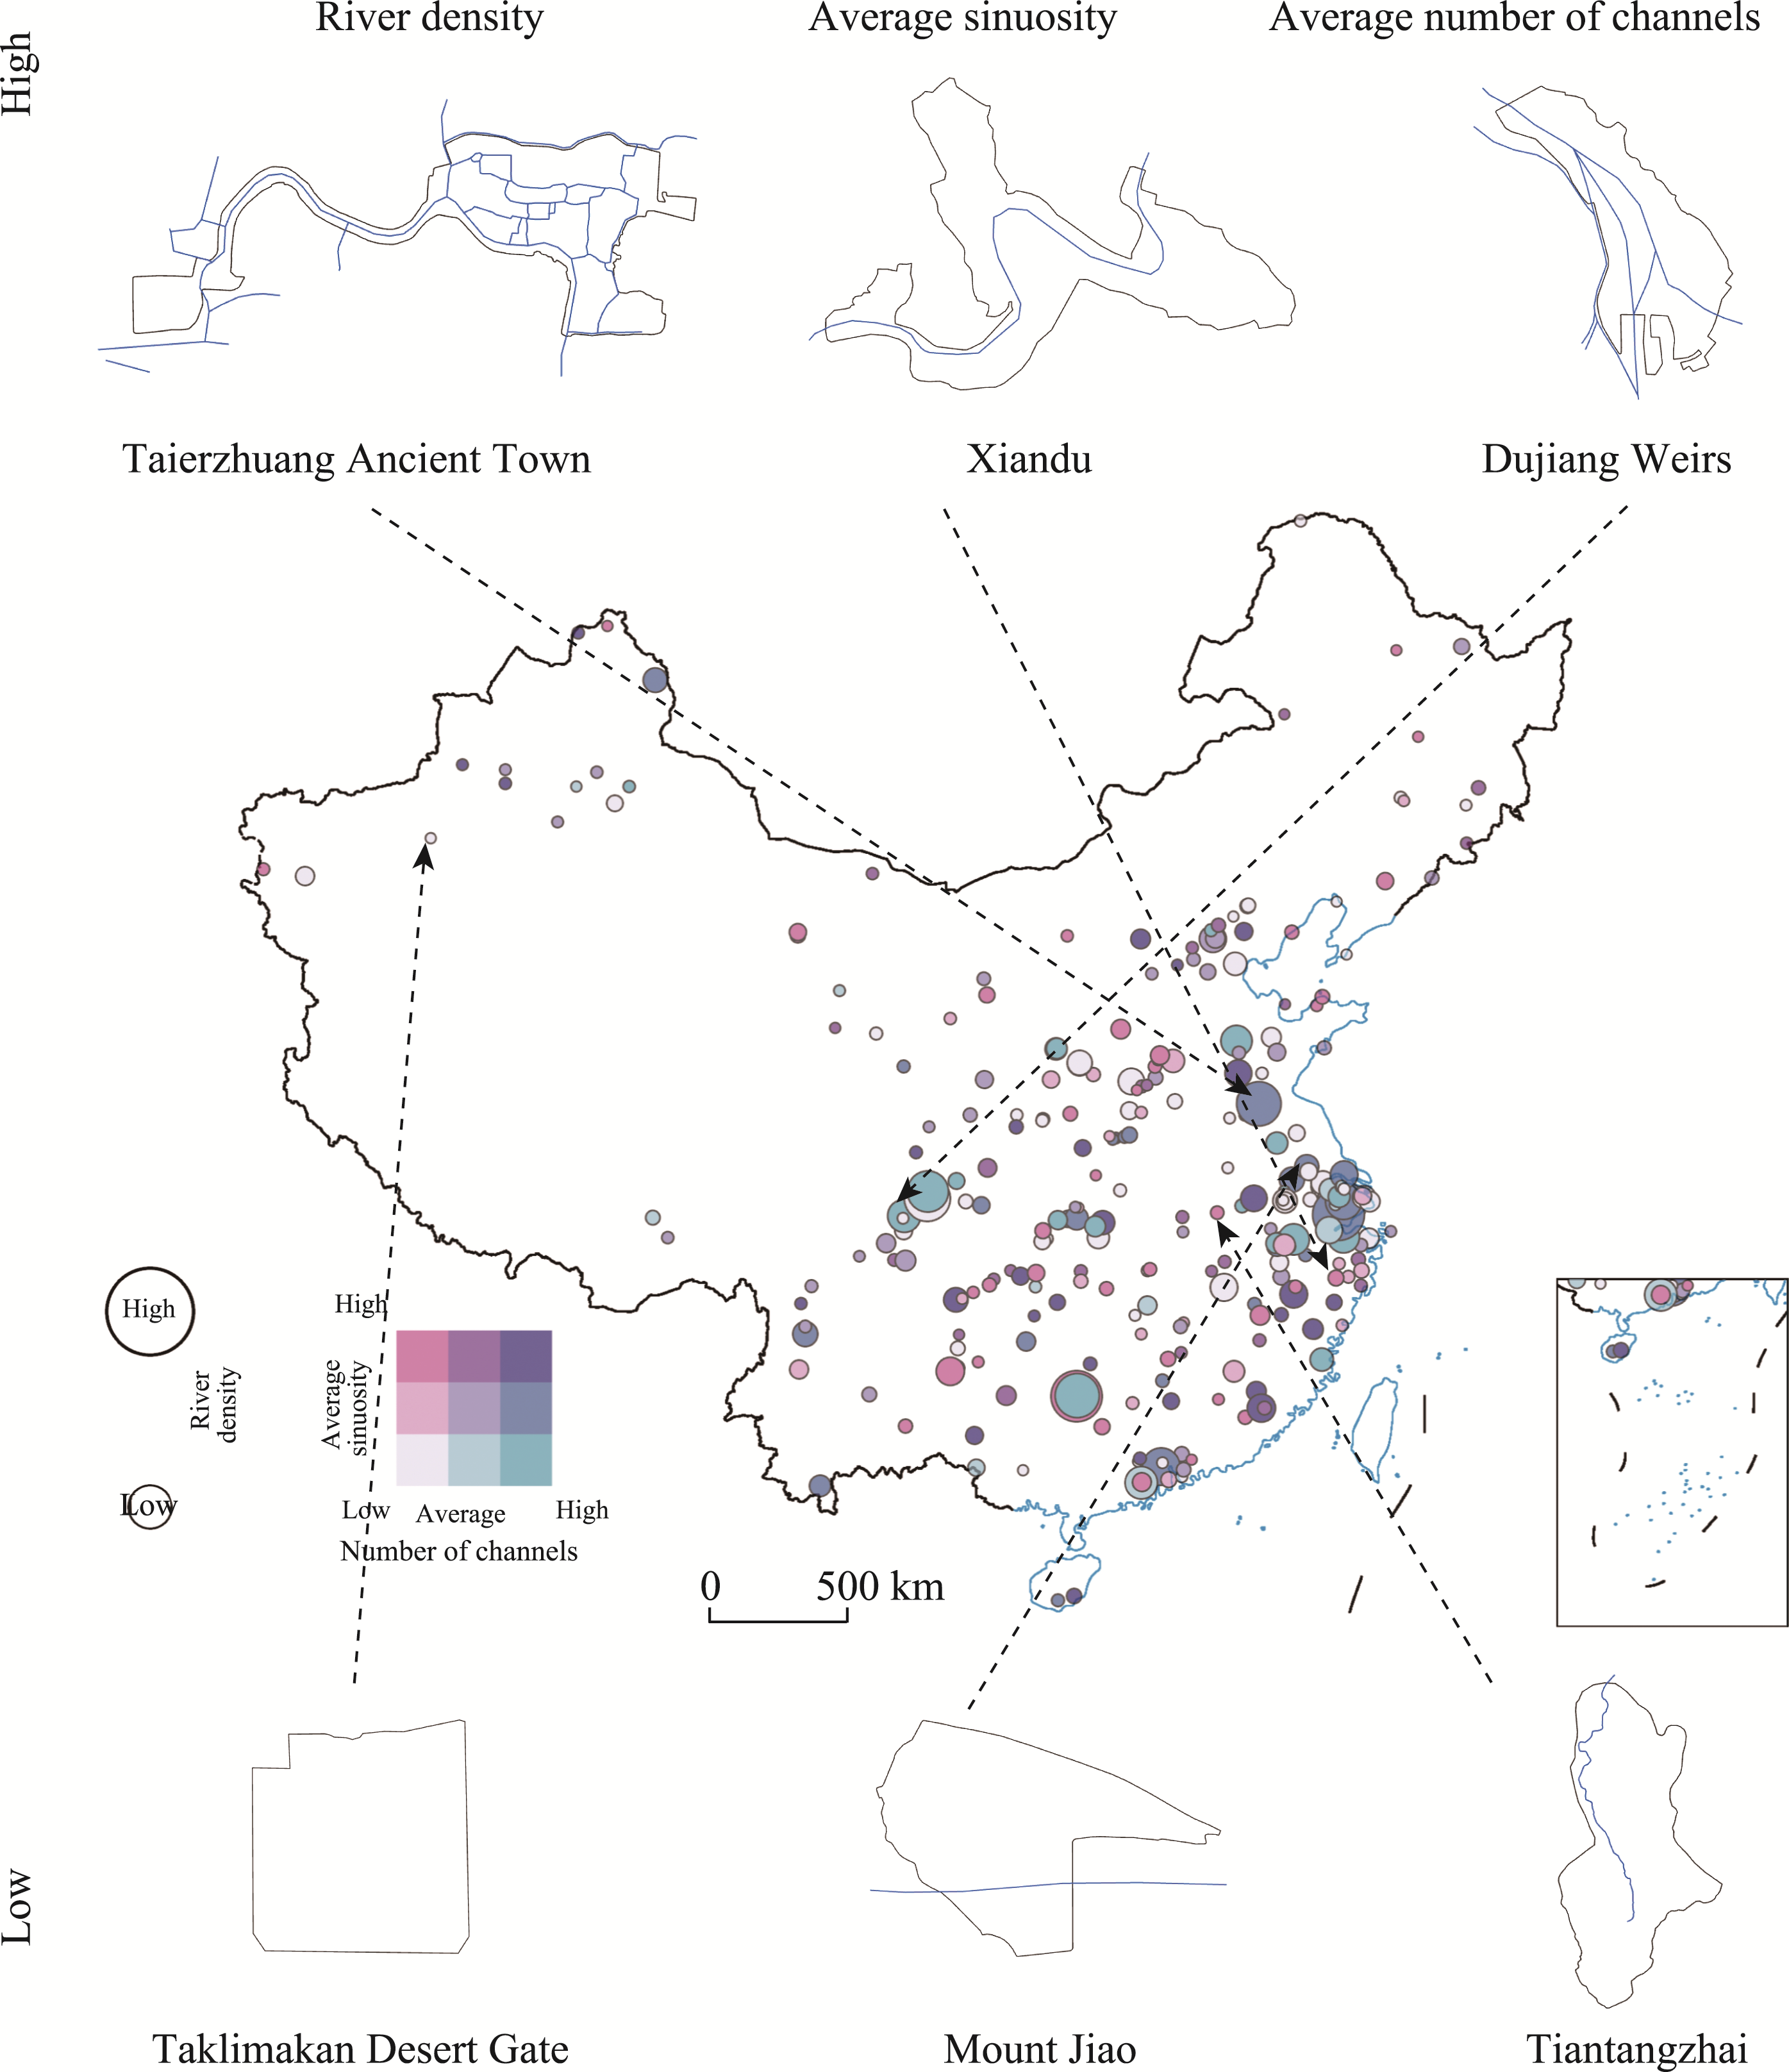
| Lines | Rivers | River Density | 0.134 (1.526) | 0.041 (0.421) | 0.034 (0.462) | 0.074 (0.632) | -0.005 (-0.020) | 0.083 (1.241) | -0.076 (-0.583) | 0.119 (1.609) |
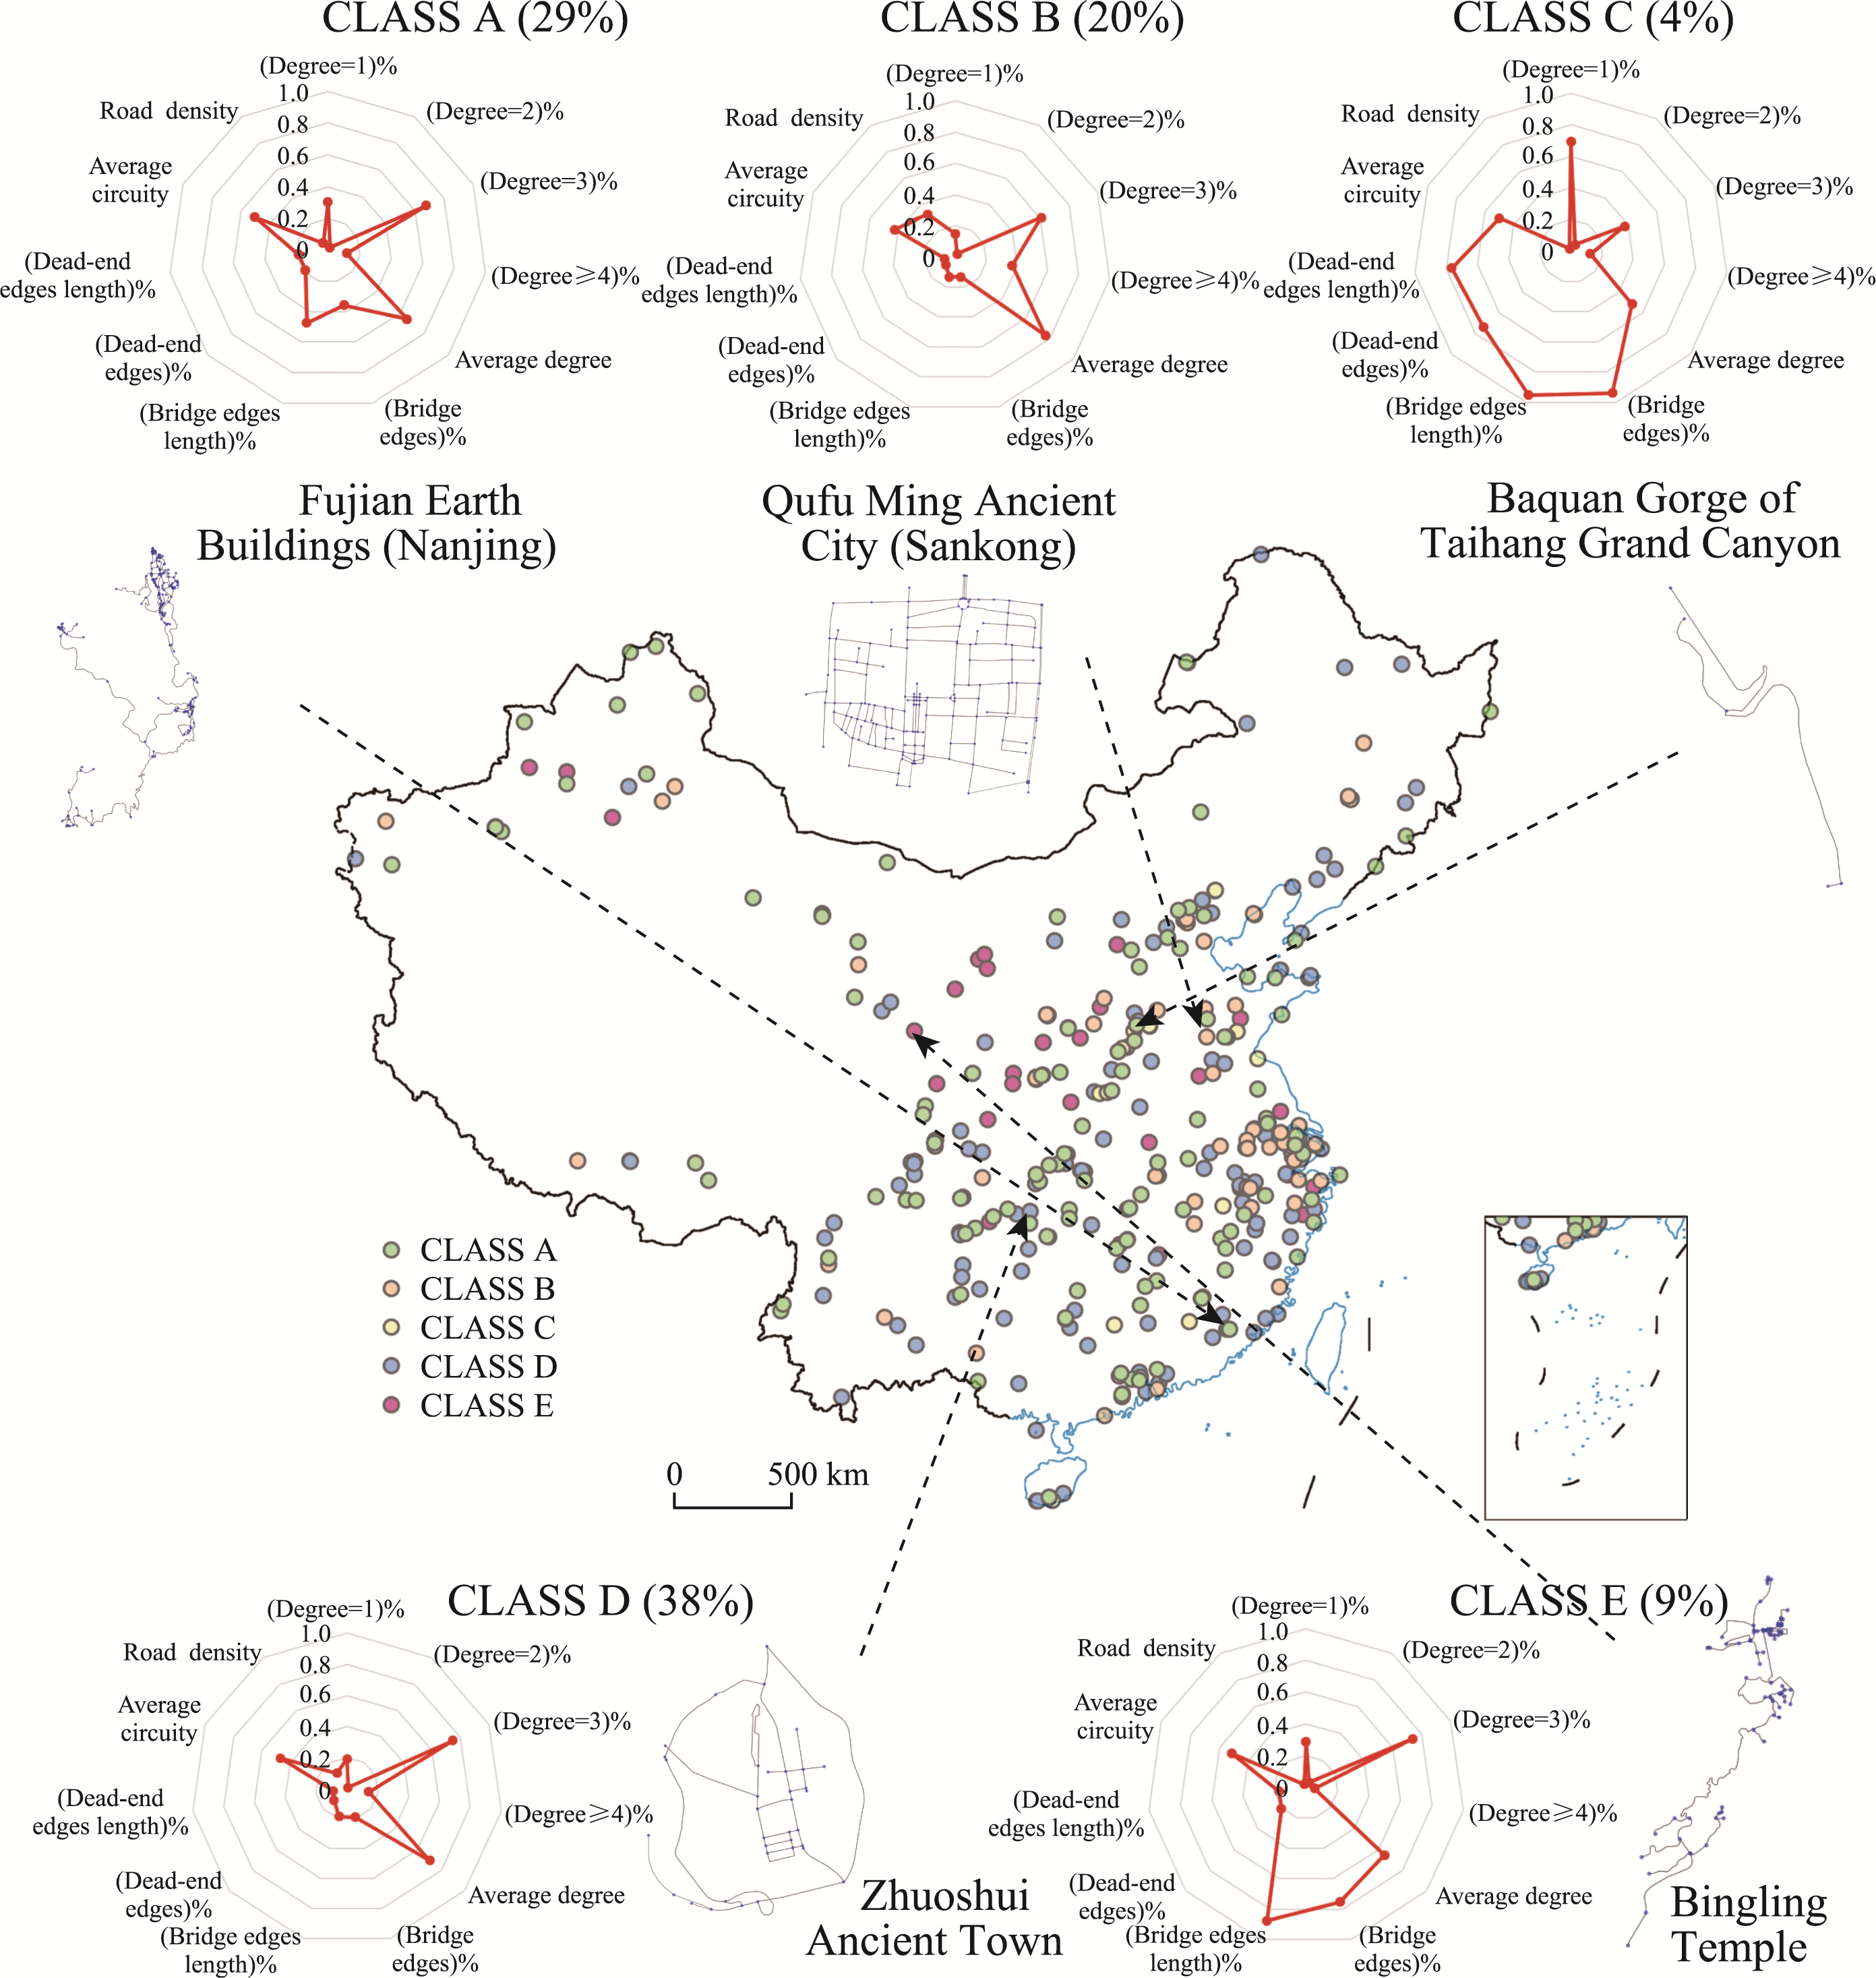
| Roads | Average Degree | 0.176 (0.845) | -0.004 (-0.039) | 0.055 (0.453) | 0.041 (0.264) | -0.953** (-3.308) | 0.184 (1.501) | -0.003 (-0.032) | -0.256 (-1.157) | |
| (Dead-end Edges Length)% | 0.205 (0.644) | -0.081 (-1.176) | -0.144 (-1.512) | -0.042 (-0.433) | -0.259* (-2.478) | -0.153 (-1.484) | -0.100 (-1.344) | -0.175 (-1.134) | ||
| (Bridge Edges Length)% | 0.181* (2.006) | 0.044 (0.932) | 0.060 (1.074) | 0.075 (1.129) | 0.002 (0.029) | 0.110 (1.926) | 0.062 (1.197) | 0.125 (1.440) | ||
| Road Density | 0.129 (1.032) | 0.477** (3.587) | 0.131 (1.459) | 0.414 (1.942) | 0.471* (2.165) | 0.179 (1.925) | 0.804** (2.844) | 0.125 (1.089) | ||
| Average Circuity | -0.620 (-1.921) | -0.166 (-1.362) | -0.303 (-1.945) | -0.150 (-0.860) | -0.447* (-2.381) | -0.354* (-2.168) | -0.215 (-1.729) | 0.234 (0.592) | ||
| Format: B (sig t ) [* p<0.05 ** p<0.01] | ||||||||||
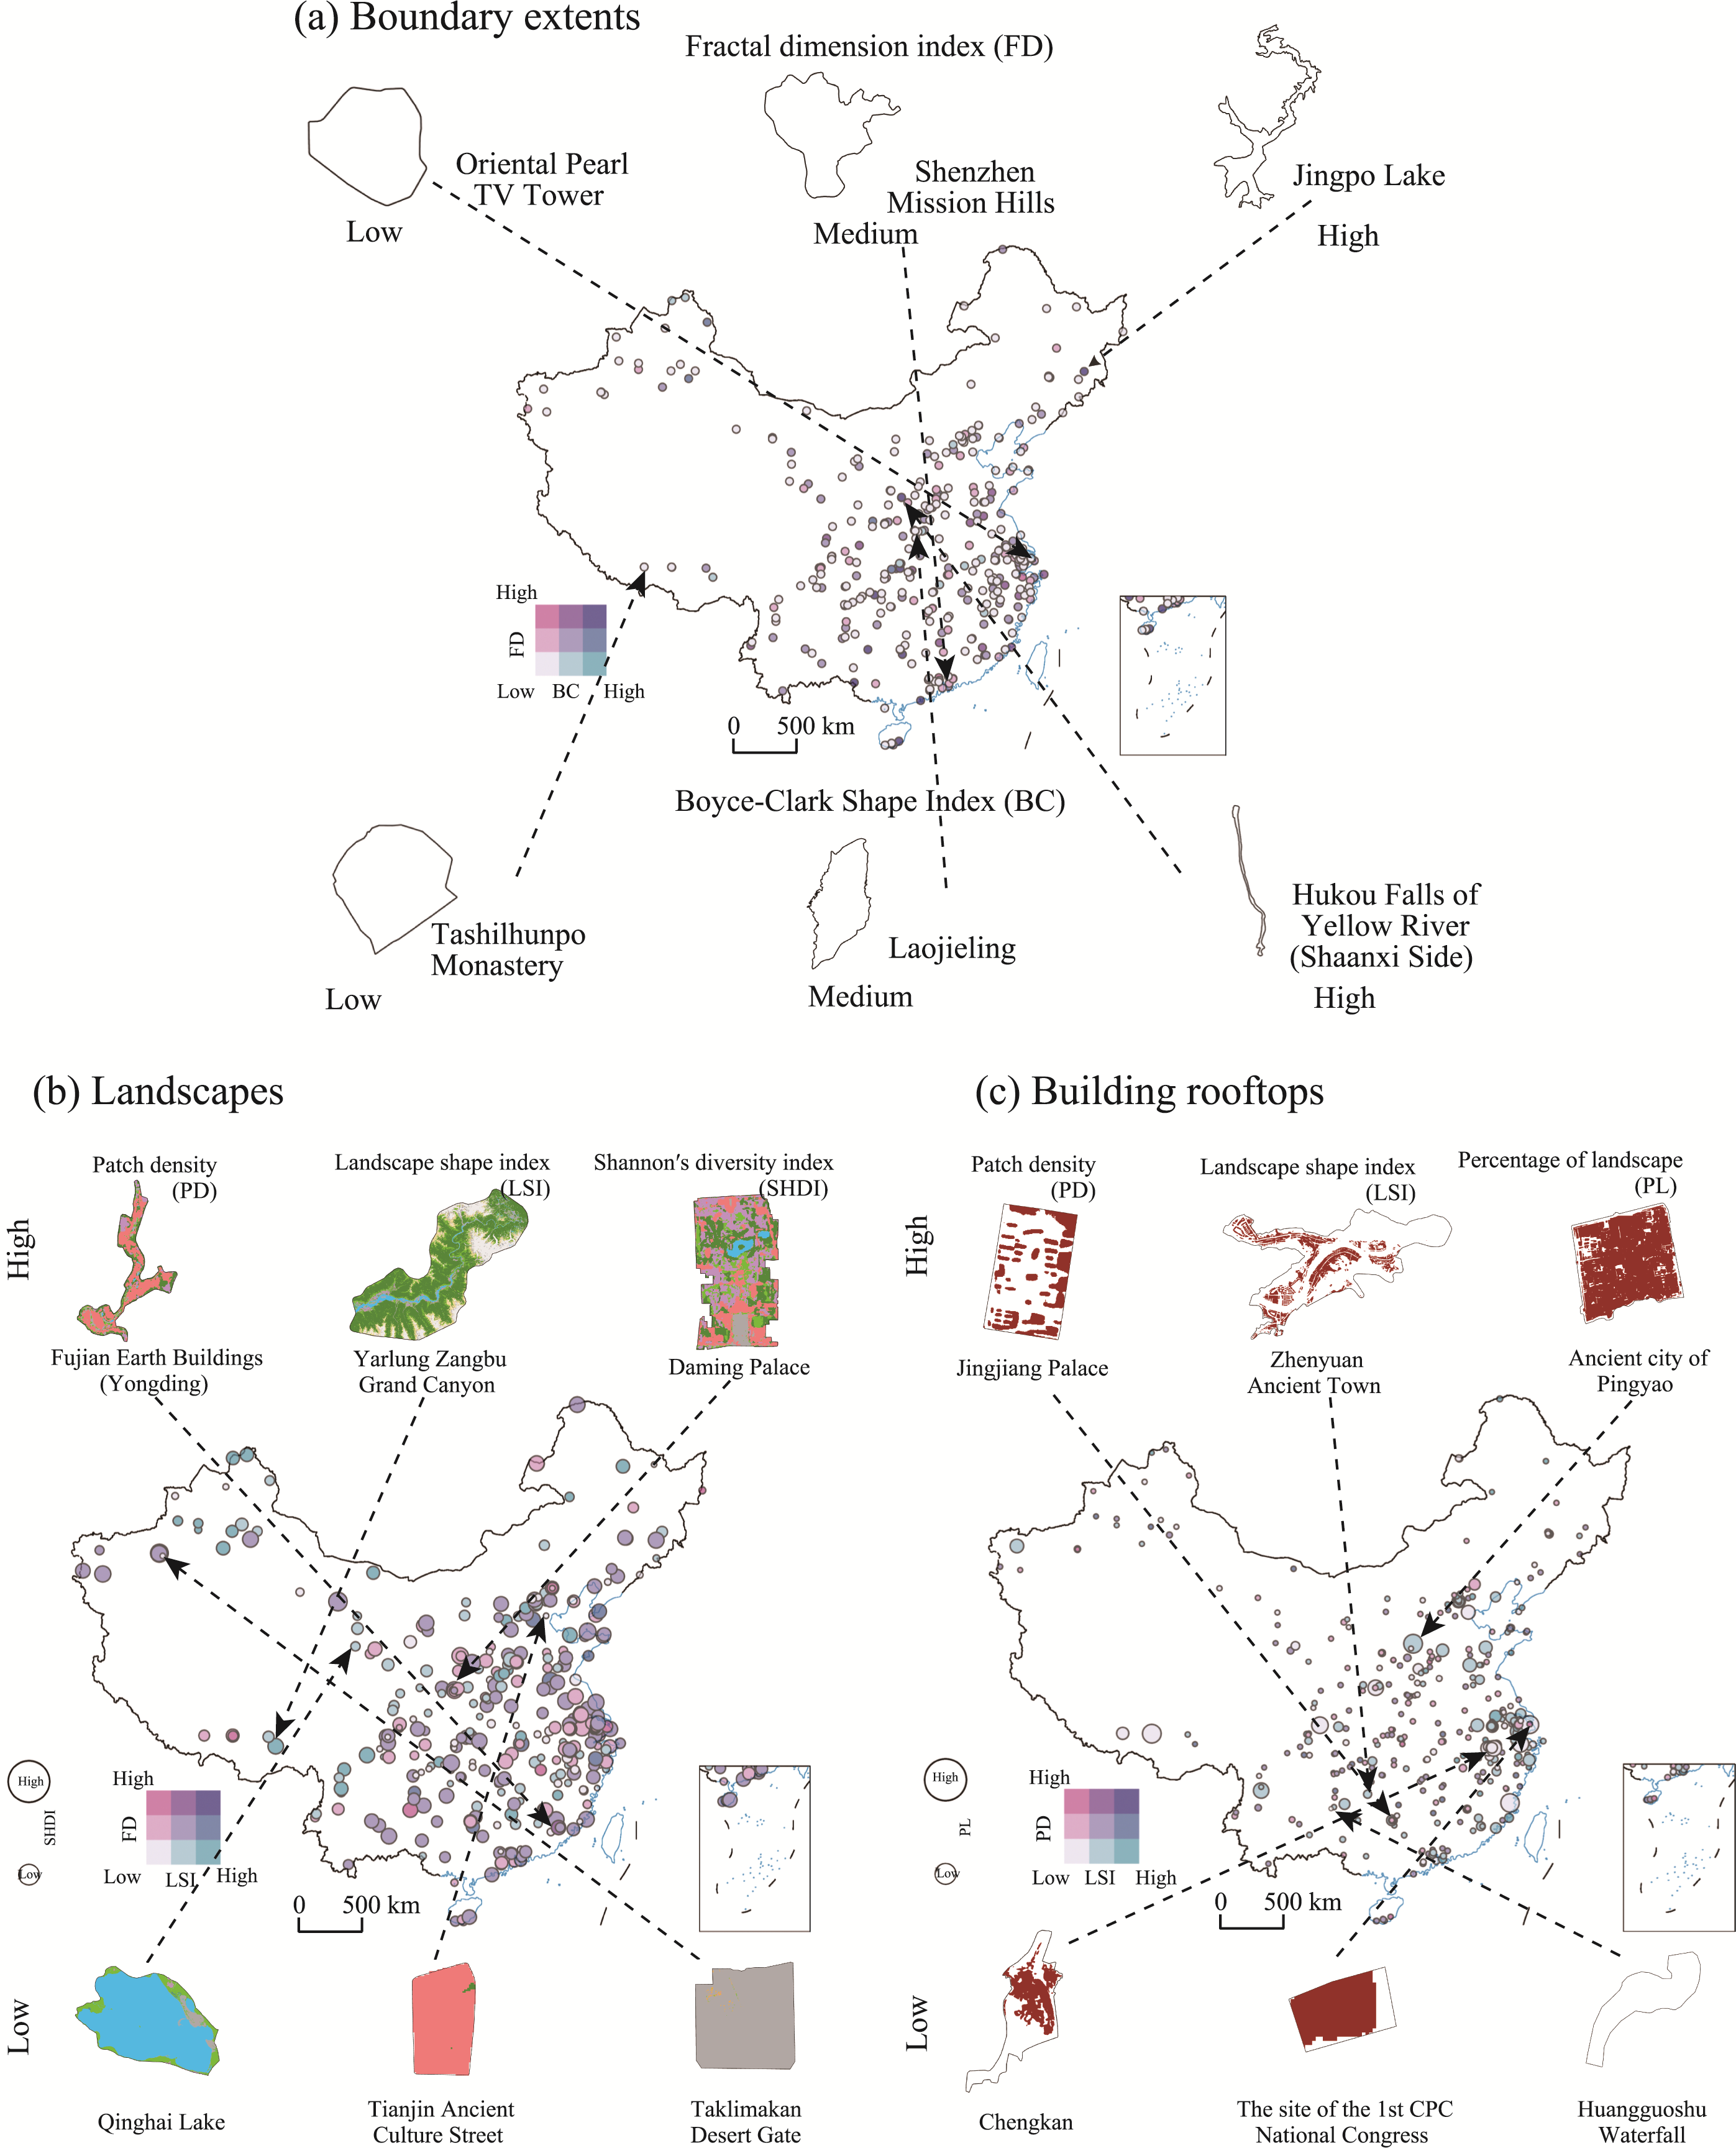
| Planes | Boundary Extends | Fractal Dimension | 0.104 (0.464) | 0.247 (1.455) | 0.301* (2.021) | 0.146 (0.580) | 0.029 (0.131) | 0.329* (2.013) | 0.225 (1.231) | 0.249 (1.255) |
| Boyce-Clark Shape Index | -0.323 (-1.506) | -0.136 (-1.137) | -0.344** (-2.875) | 0.005 (0.026) | -0.075 (-0.459) | -0.290* (-2.333) | -0.110 (-0.824) | -0.297 (-1.769) | ||
| Landscapes | Patch Density | -0.382 (-0.756) | -1.059* (-1.989) | -0.102 (-0.272) | -0.948 (-1.613) | 1.325 (0.716) | -0.496 (-1.362) | 0.224 (0.428) | -0.694 (-1.577) | |
| Landscape Shape Index | 1.598 (1.337) | 0.030 (0.236) | -0.631* (-2.331) | 0.006 (0.033) | 0.011 (0.085) | -0.483 (-0.715) | 0.035 (0.269) | 0.037 (0.038) | ||
| Shannon’s Diversity Index | 0.013 (0.080) | -0.079 (-1.111) | 0.008 (0.103) | -0.110 (-1.051) | -0.211 (-1.759) | 0.018 (0.199) | -0.148 (-1.914) | -0.086 (-0.751) | ||
| Building Rooftops | Patch Density | 2.776 (1.656) | 0.069 (0.248) | 0.392 (0.892) | 0.209 (0.545) | -0.044 (-0.042) | -0.082 (-0.309) | 0.100 (0.241) | -0.037 (-0.111) | |
| Landscape Shape Index | -0.663 (-1.689) | 0.020 (0.185) | 0.233 (1.775) | 0.067 (0.308) | 0.045 (0.402) | -0.243 (-0.876) | 0.079 (0.721) | -0.365 (-1.016) | ||
| Percentage of Landscape | 0.135 (1.072) | 0.258 (0.571) | -0.018 (-0.225) | -0.037 (-0.247) | 0.358 (0.626) | 0.018 (0.232) | -0.140 (-0.733) | -0.022 (-0.248) | ||
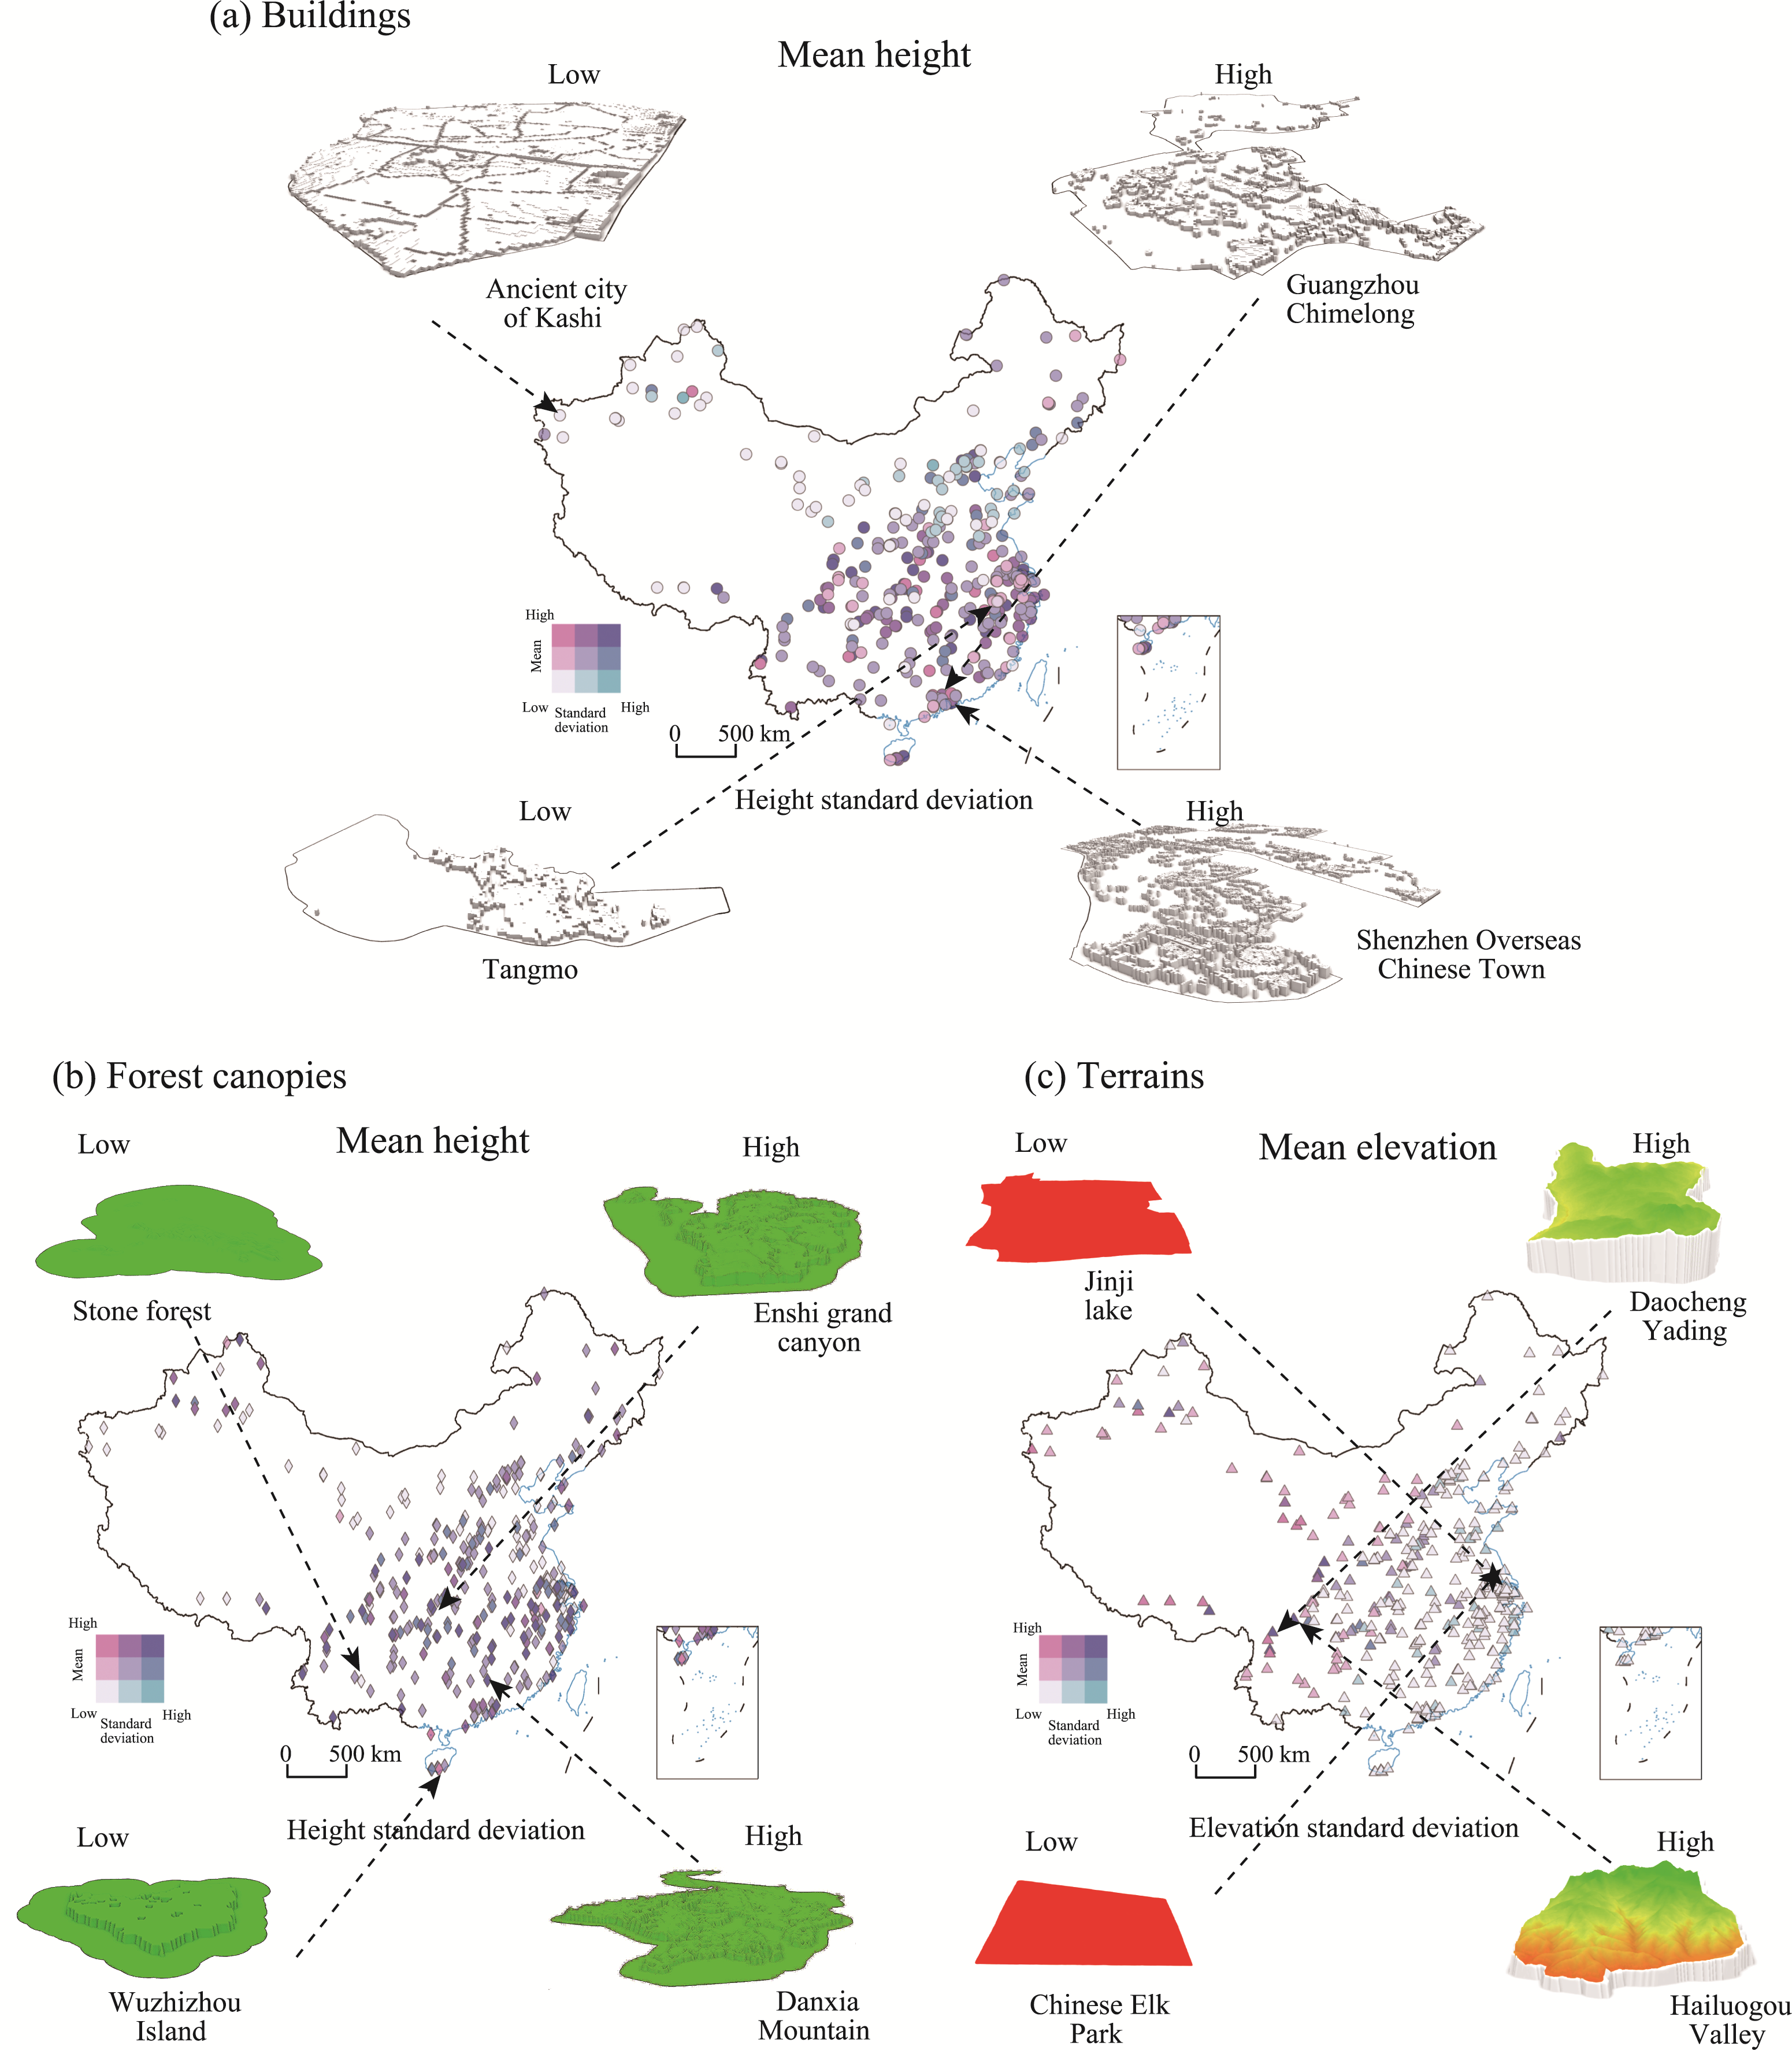
| Solids | Buildings | Mean Height | 0.025 (0.119) | -0.074 (-0.808) | 0.042 (0.339) | -0.281* (-2.179) | -0.218 (-1.597) | 0.003 (0.025) | -0.143 (-1.398) | -0.101 (-0.650) |
| Height Standard Deviation | 0.043 (0.273) | 0.145 (1.942) | 0.036 (0.402) | 0.225* (2.139) | 0.204* (2.031) | 0.051 (0.534) | 0.159* (1.997) | 0.129 (0.878) | ||
| Forest Canopies | Mean Height | -0.084 (-0.489) | 0.165* (2.479) | 0.096 (1.131) | 0.157 (1.638) | 0.133 (1.436) | 0.113 (1.340) | 0.180* (2.452) | -0.078 (-0.660) | |
| Height Standard Deviation | 0.201 (0.840) | -0.057 (-0.685) | -0.035 (-0.327) | -0.027 (-0.217) | 0.076 (0.716) | -0.057 (-0.491) | -0.030 (-0.325) | 0.213 (1.314) | ||
| Terrains | Mean Elevation | 0.034 (0.333) | 0.052 (0.789) | 0.105 (1.186) | 0.049 (0.689) | 0.059 (0.766) | 0.095 (1.313) | 0.088 (1.264) | 0.084 (0.940) | |
| Elevation Standard Deviation | 4.567 (1.865) | 0.034 (0.252) | 0.046 (0.190) | 0.028 (0.164) | 0.027 (0.198) | 0.570 (1.163) | 0.037 (0.260) | -1.508 (-1.017) | ||
| R2 | 0.247 | 0.199 | 0.171 | 0.214 | 0.346 | 0.144 | 0.178 | 0.210 | ||
| Adjusted R2 | 0.013 | 0.120 | 0.066 | 0.069 | 0.202 | 0.047 | 0.088 | 0.018 | ||
| Chow test | F=1.394,p=0.106 | F=1.064,p=0.384 | F=1.450,p=0.082 | F=1.012,p=0.450 | ||||||