| Name | Definition | Formula |
|---|---|---|
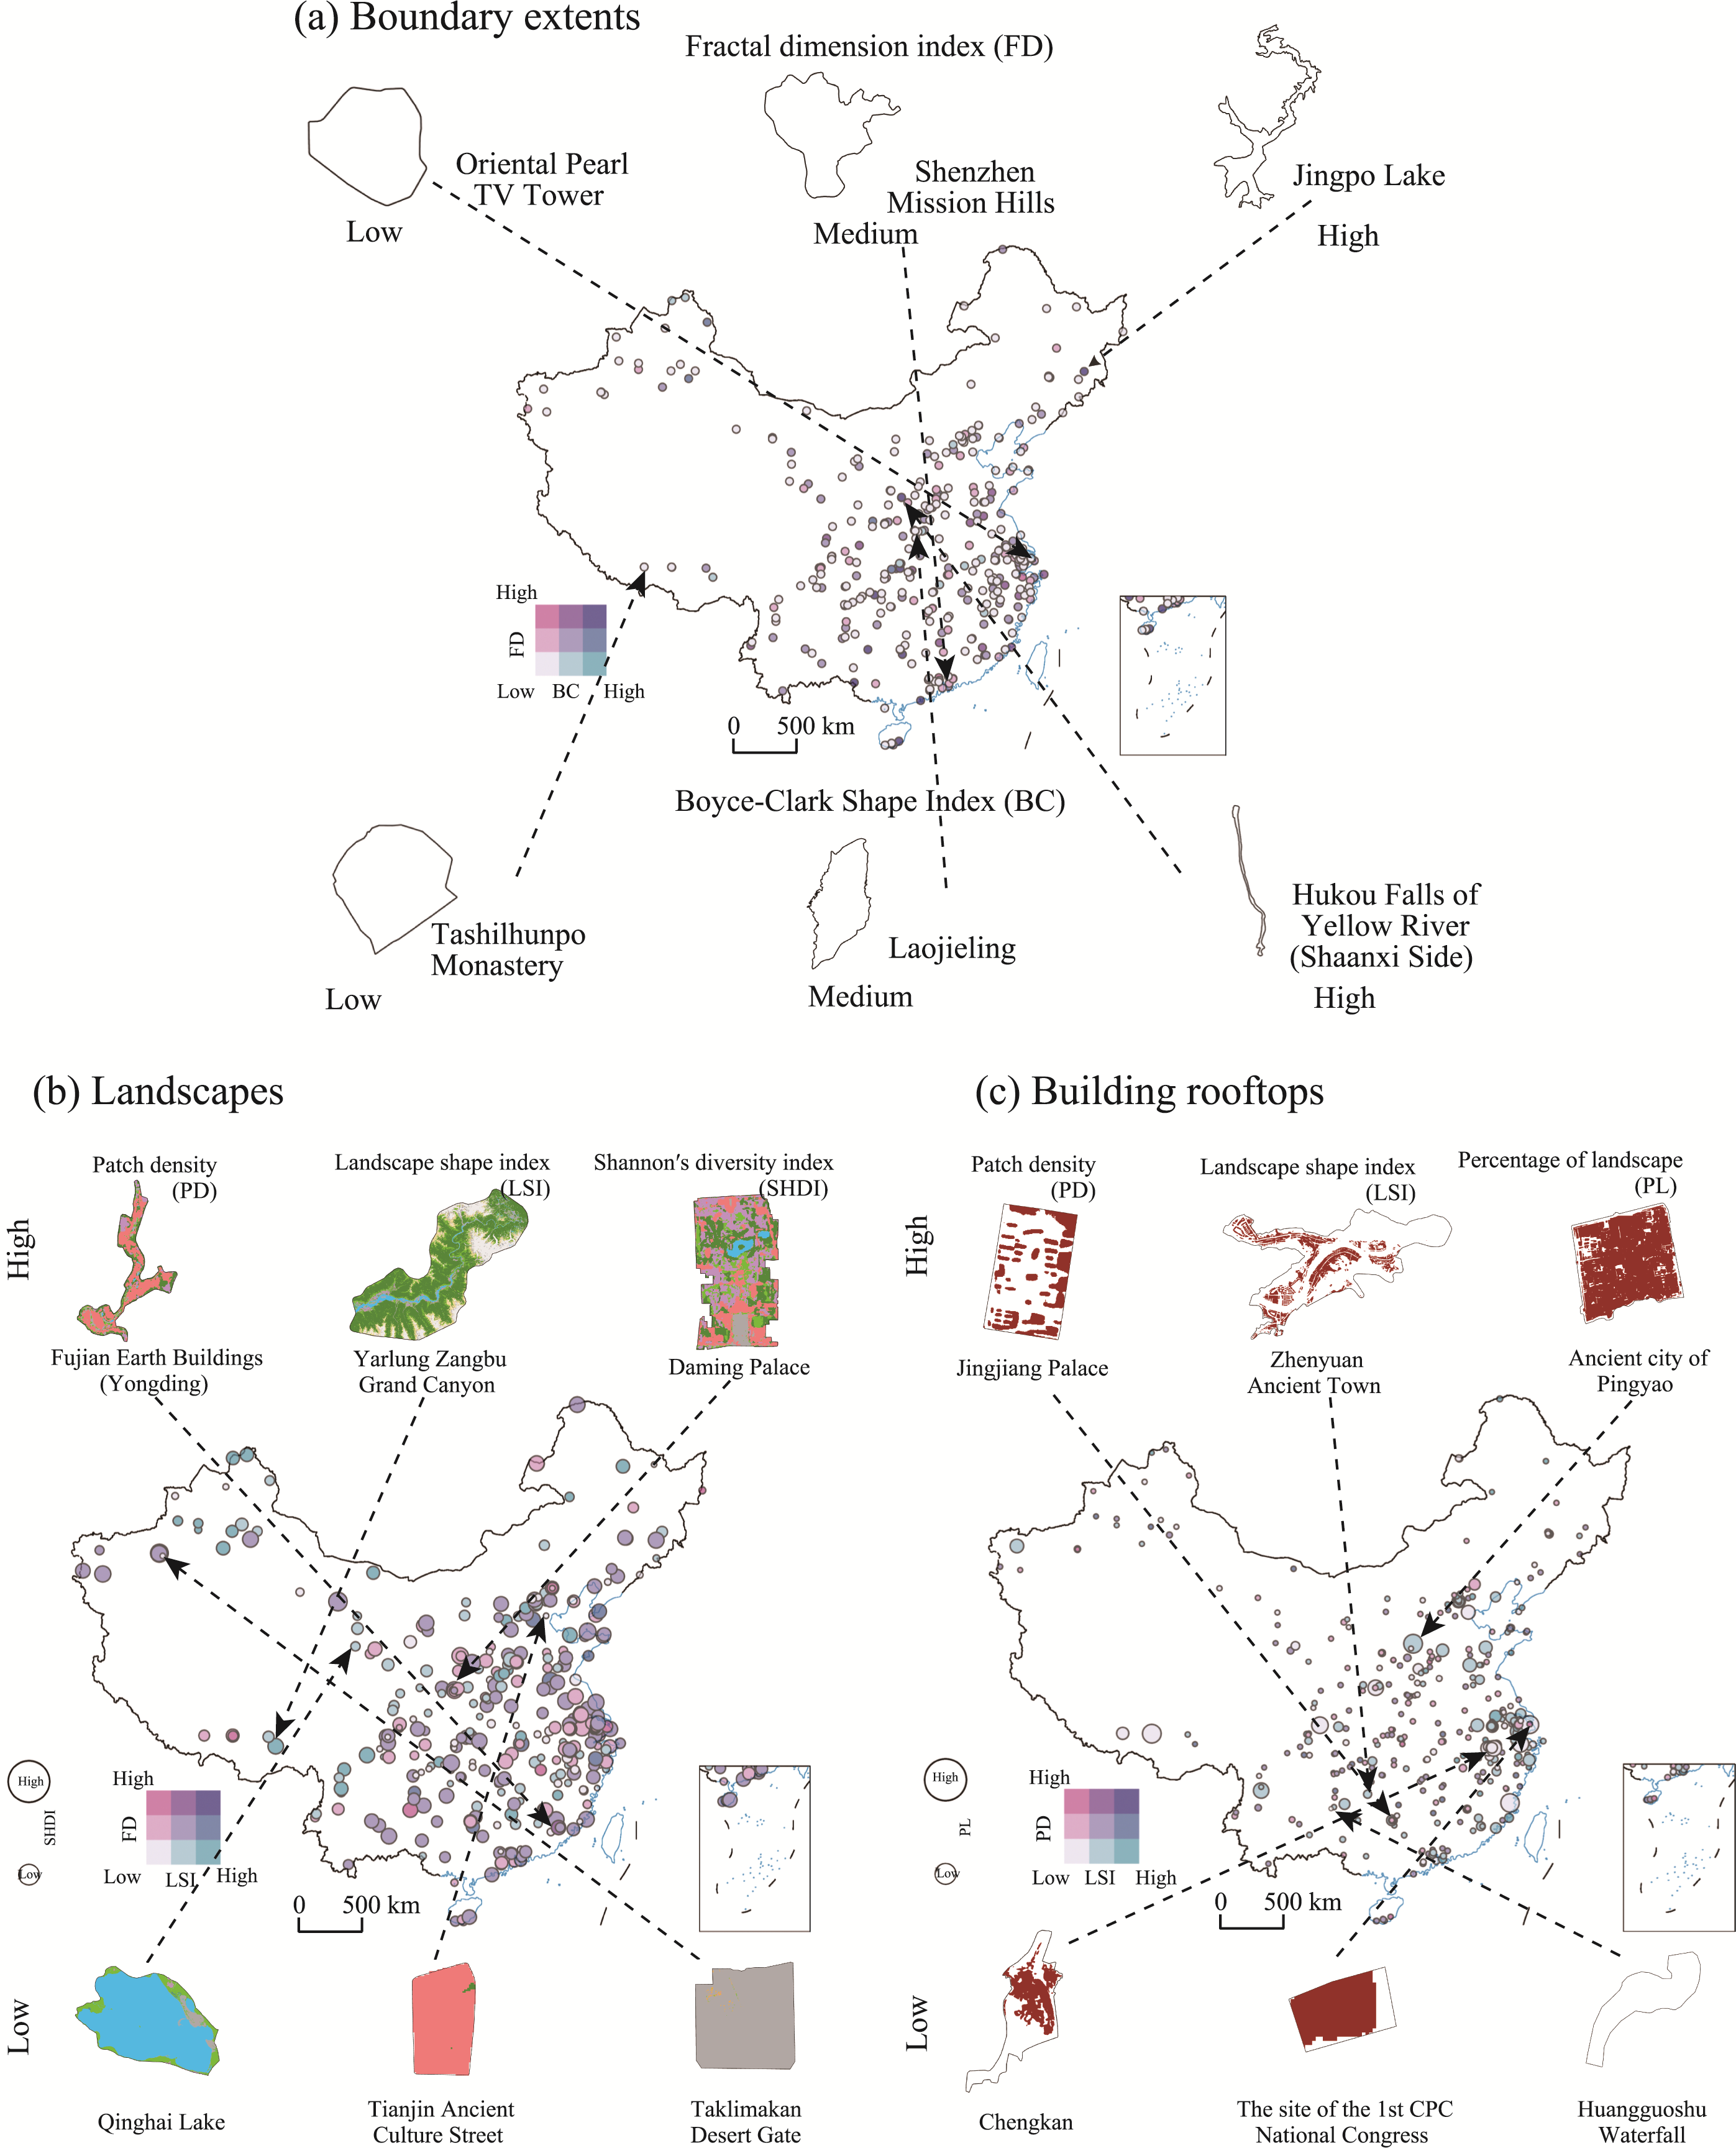
| Patch density (PD) | Reflecting the fragmentation of the landscape. The higher the PD, the higher the number of patches per unit area within the region. | $PD=\frac{N}{A}$ (3) where N is the total number of patches, and A is the total landscape area. |
| Landscape shape index (LSI) | Reflecting the shape complexity of the landscape. The higher the LSI, the more complex the overall shape of the landscape elements. | $LSI=\frac{{}^{E}/{}_{4}}{\sqrt{A}}$ (4) where E is the total length of the landscape edges, and A is the total landscape area. |
| Shannon’s diversity index (SHDI) | Measuring the diversity of the landscape. The higher the SHDI, the more diverse the landscape. | $SHDI=-\sum\limits_{i=1}^{m}{\left( {{P}_{i}}\cdot \ln {{P}_{i}} \right)}$ (5) where Pi is the percentage of the landscape occupied by patch type i, and m is the total number of patch types. |
| Percentage of landscape (PL) | Quantifying the proportional abundance of the target patch type in the total landscape. The higher the PL, the more abundant the patch type. | ${{P}_{i}}=\frac{\sum\limits_{j=1}^{n}{{{a}_{ij}}}}{A}$ (6) where aij is the area of the patch j belonging to type i, n is the total number of patches of type i, and A is the total landscape area. |