| Type | Name | Indicator | B | t | p |
|---|---|---|---|---|---|
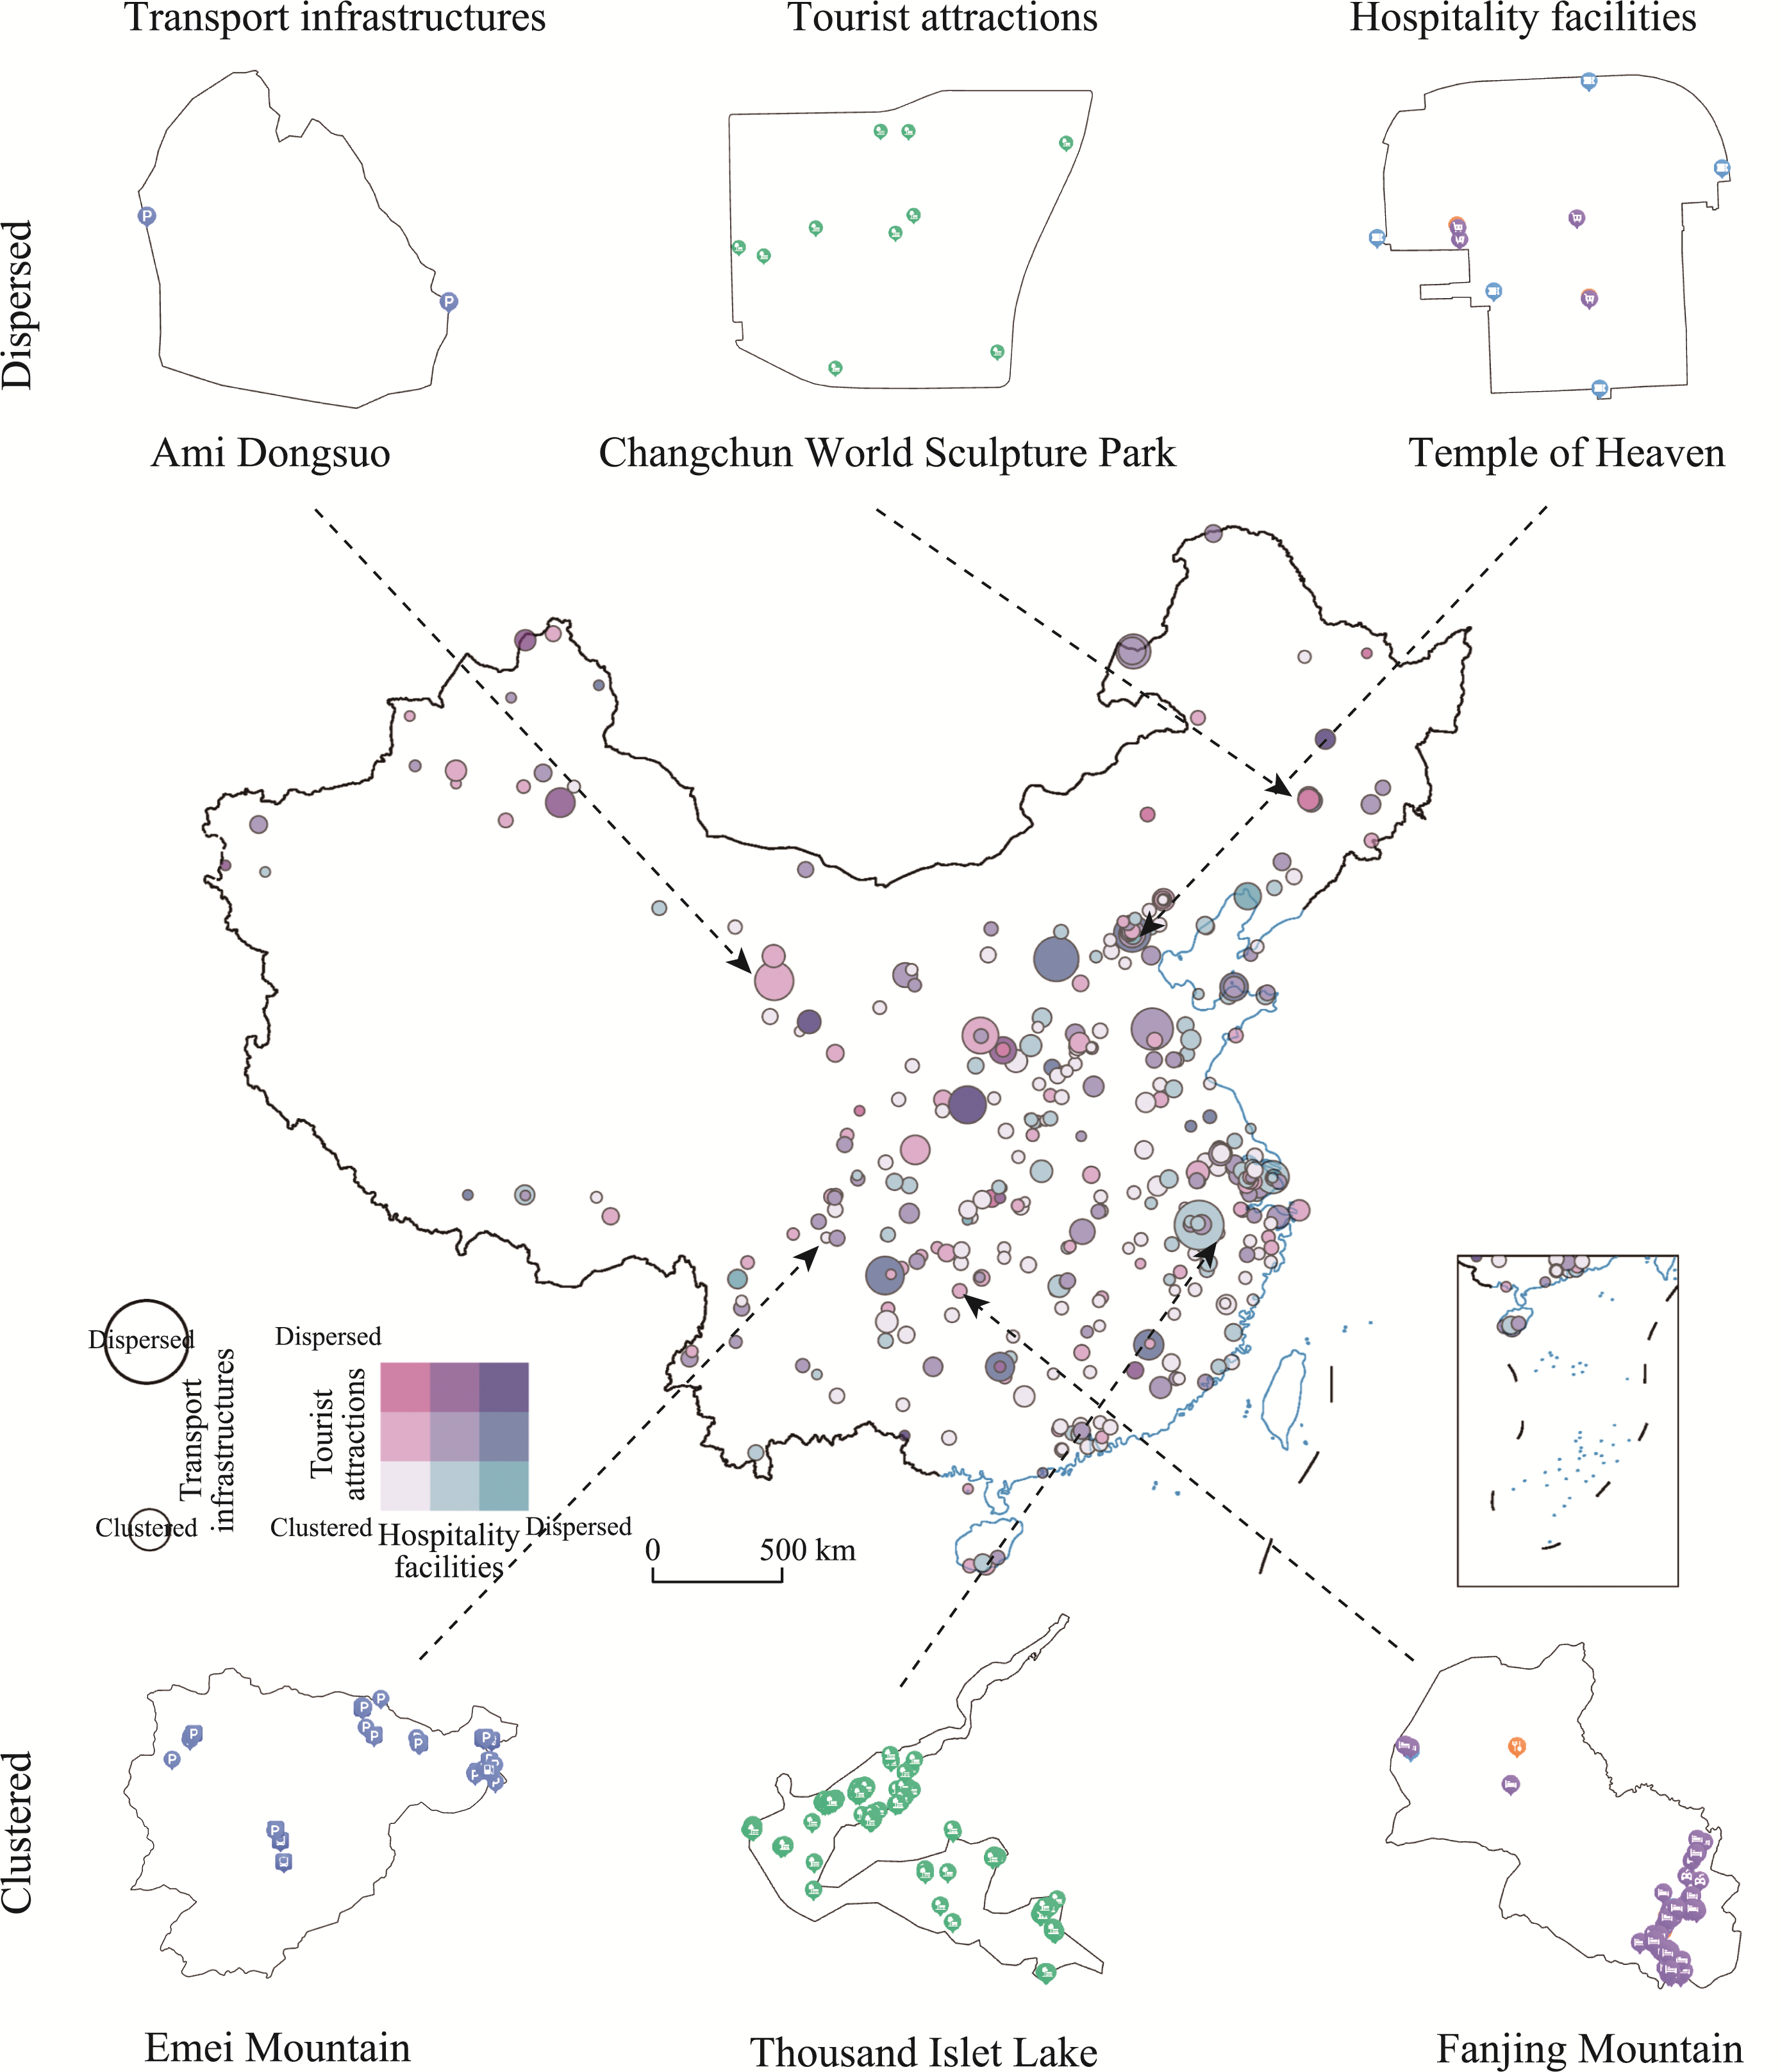
| Points | Tourist attractions | Average nearest neighbor index | 0.064 | 0.929 | 0.354 |
| Hospitality facilities | Average nearest neighbor index | -0.032 | -0.433 | 0.666 | |
| Transport infrastructures | Average nearest neighbor index | -0.092 | -1.336 | 0.182 | |
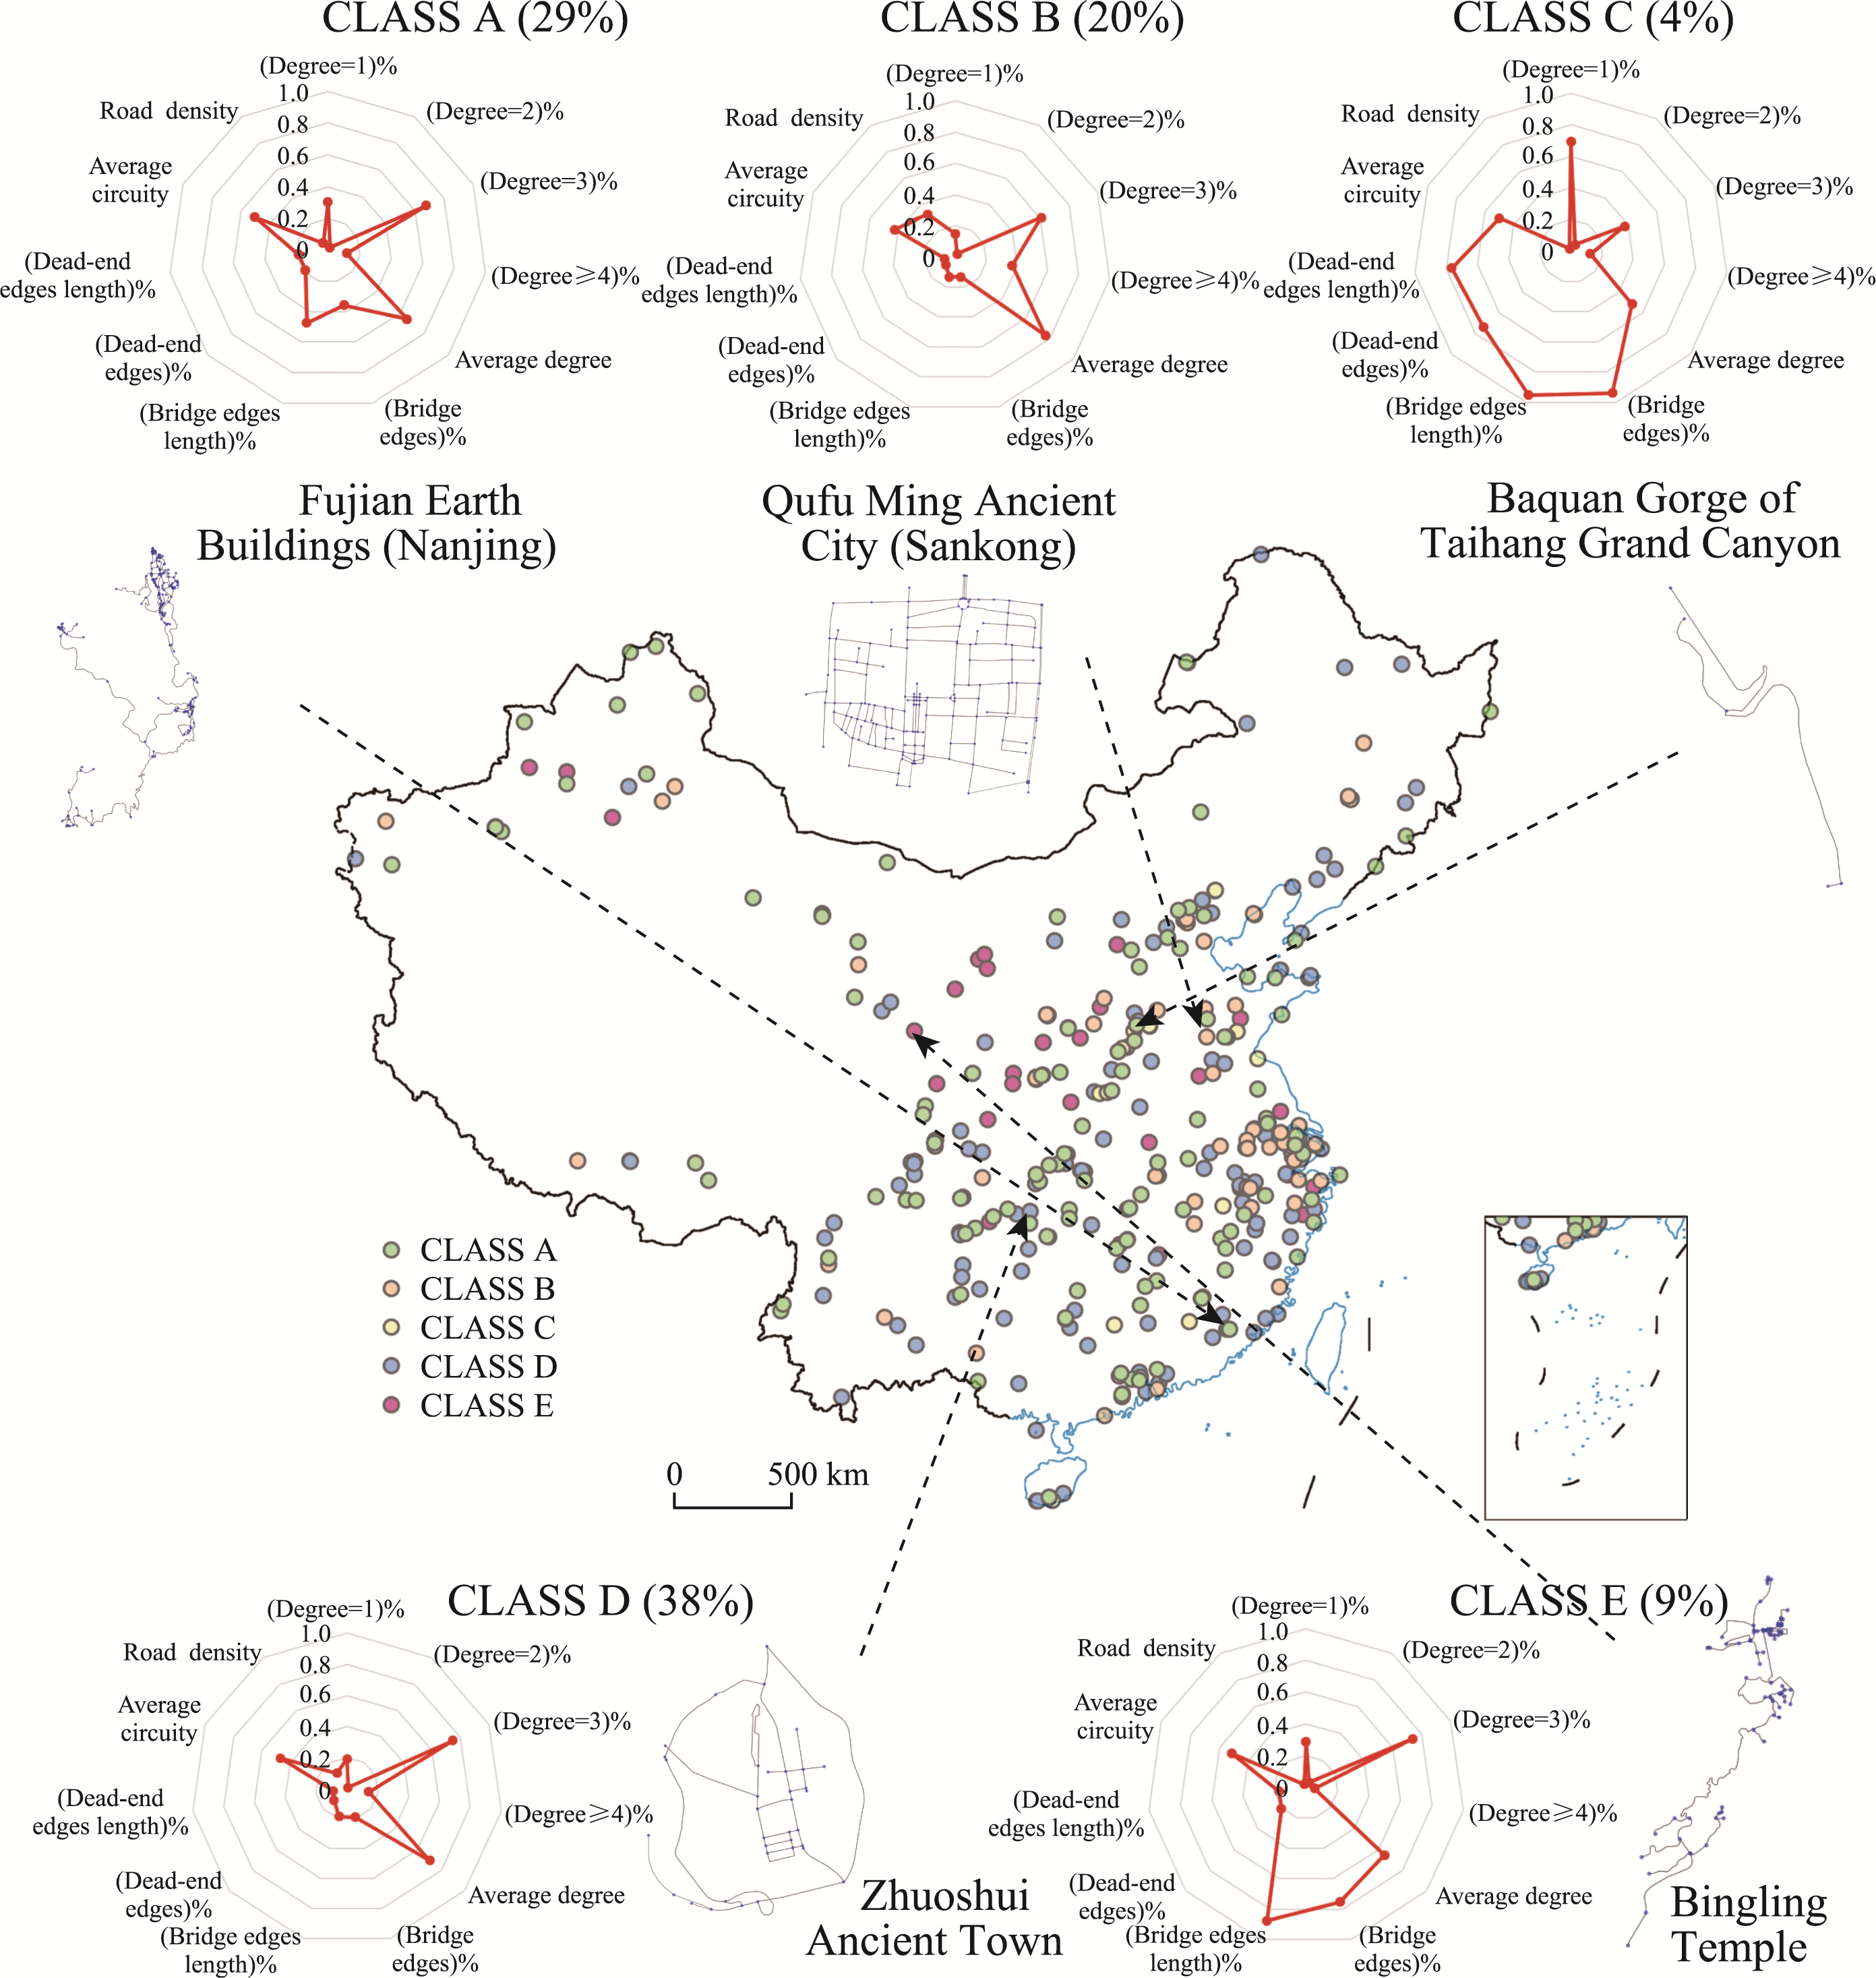
| Lines | Roads | Average degree | 0.036 | 0.401 | 0.689 |
| (Bridge edges length)% | 0.059 | 1.408 | 0.160 | ||
| (Dead-end edges length)% | -0.103 | -1.576 | 0.116 | ||
| Average circuity | -0.202 | -1.849 | 0.065 | ||
| Road density* | 0.207 | 2.571 | 0.011 | ||
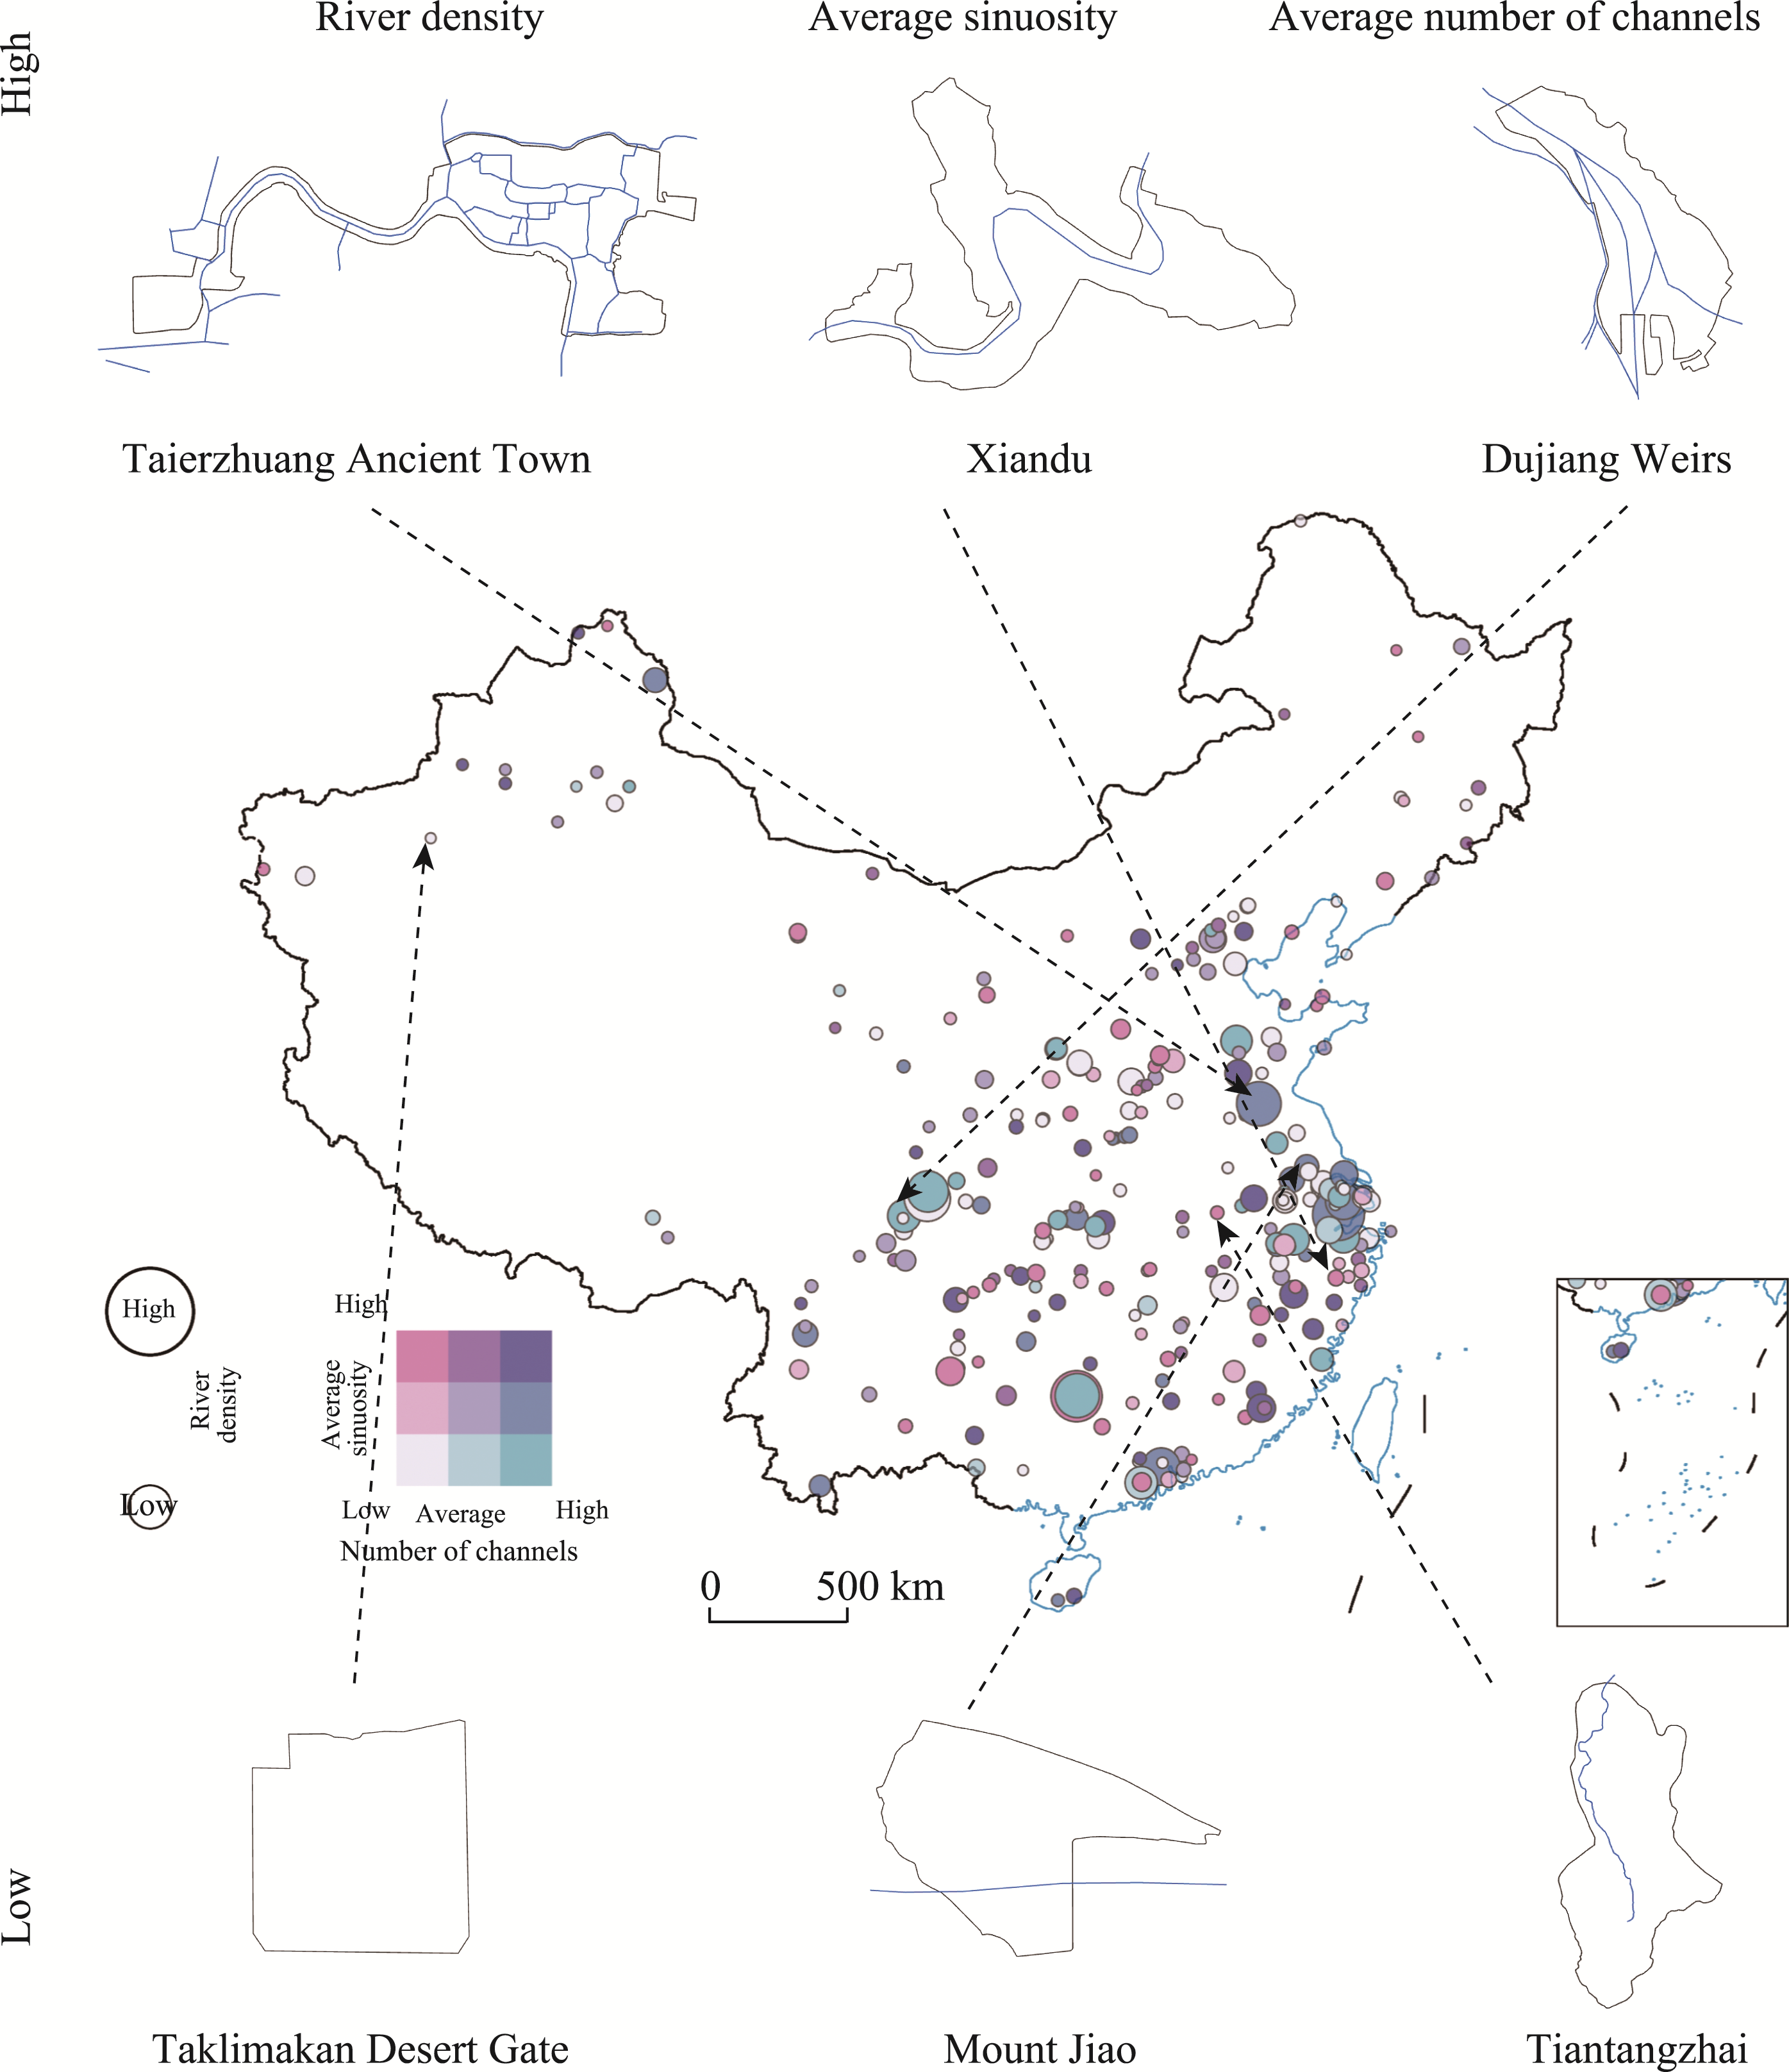
| Rivers | River density | 0.07 | 1.131 | 0.259 | |
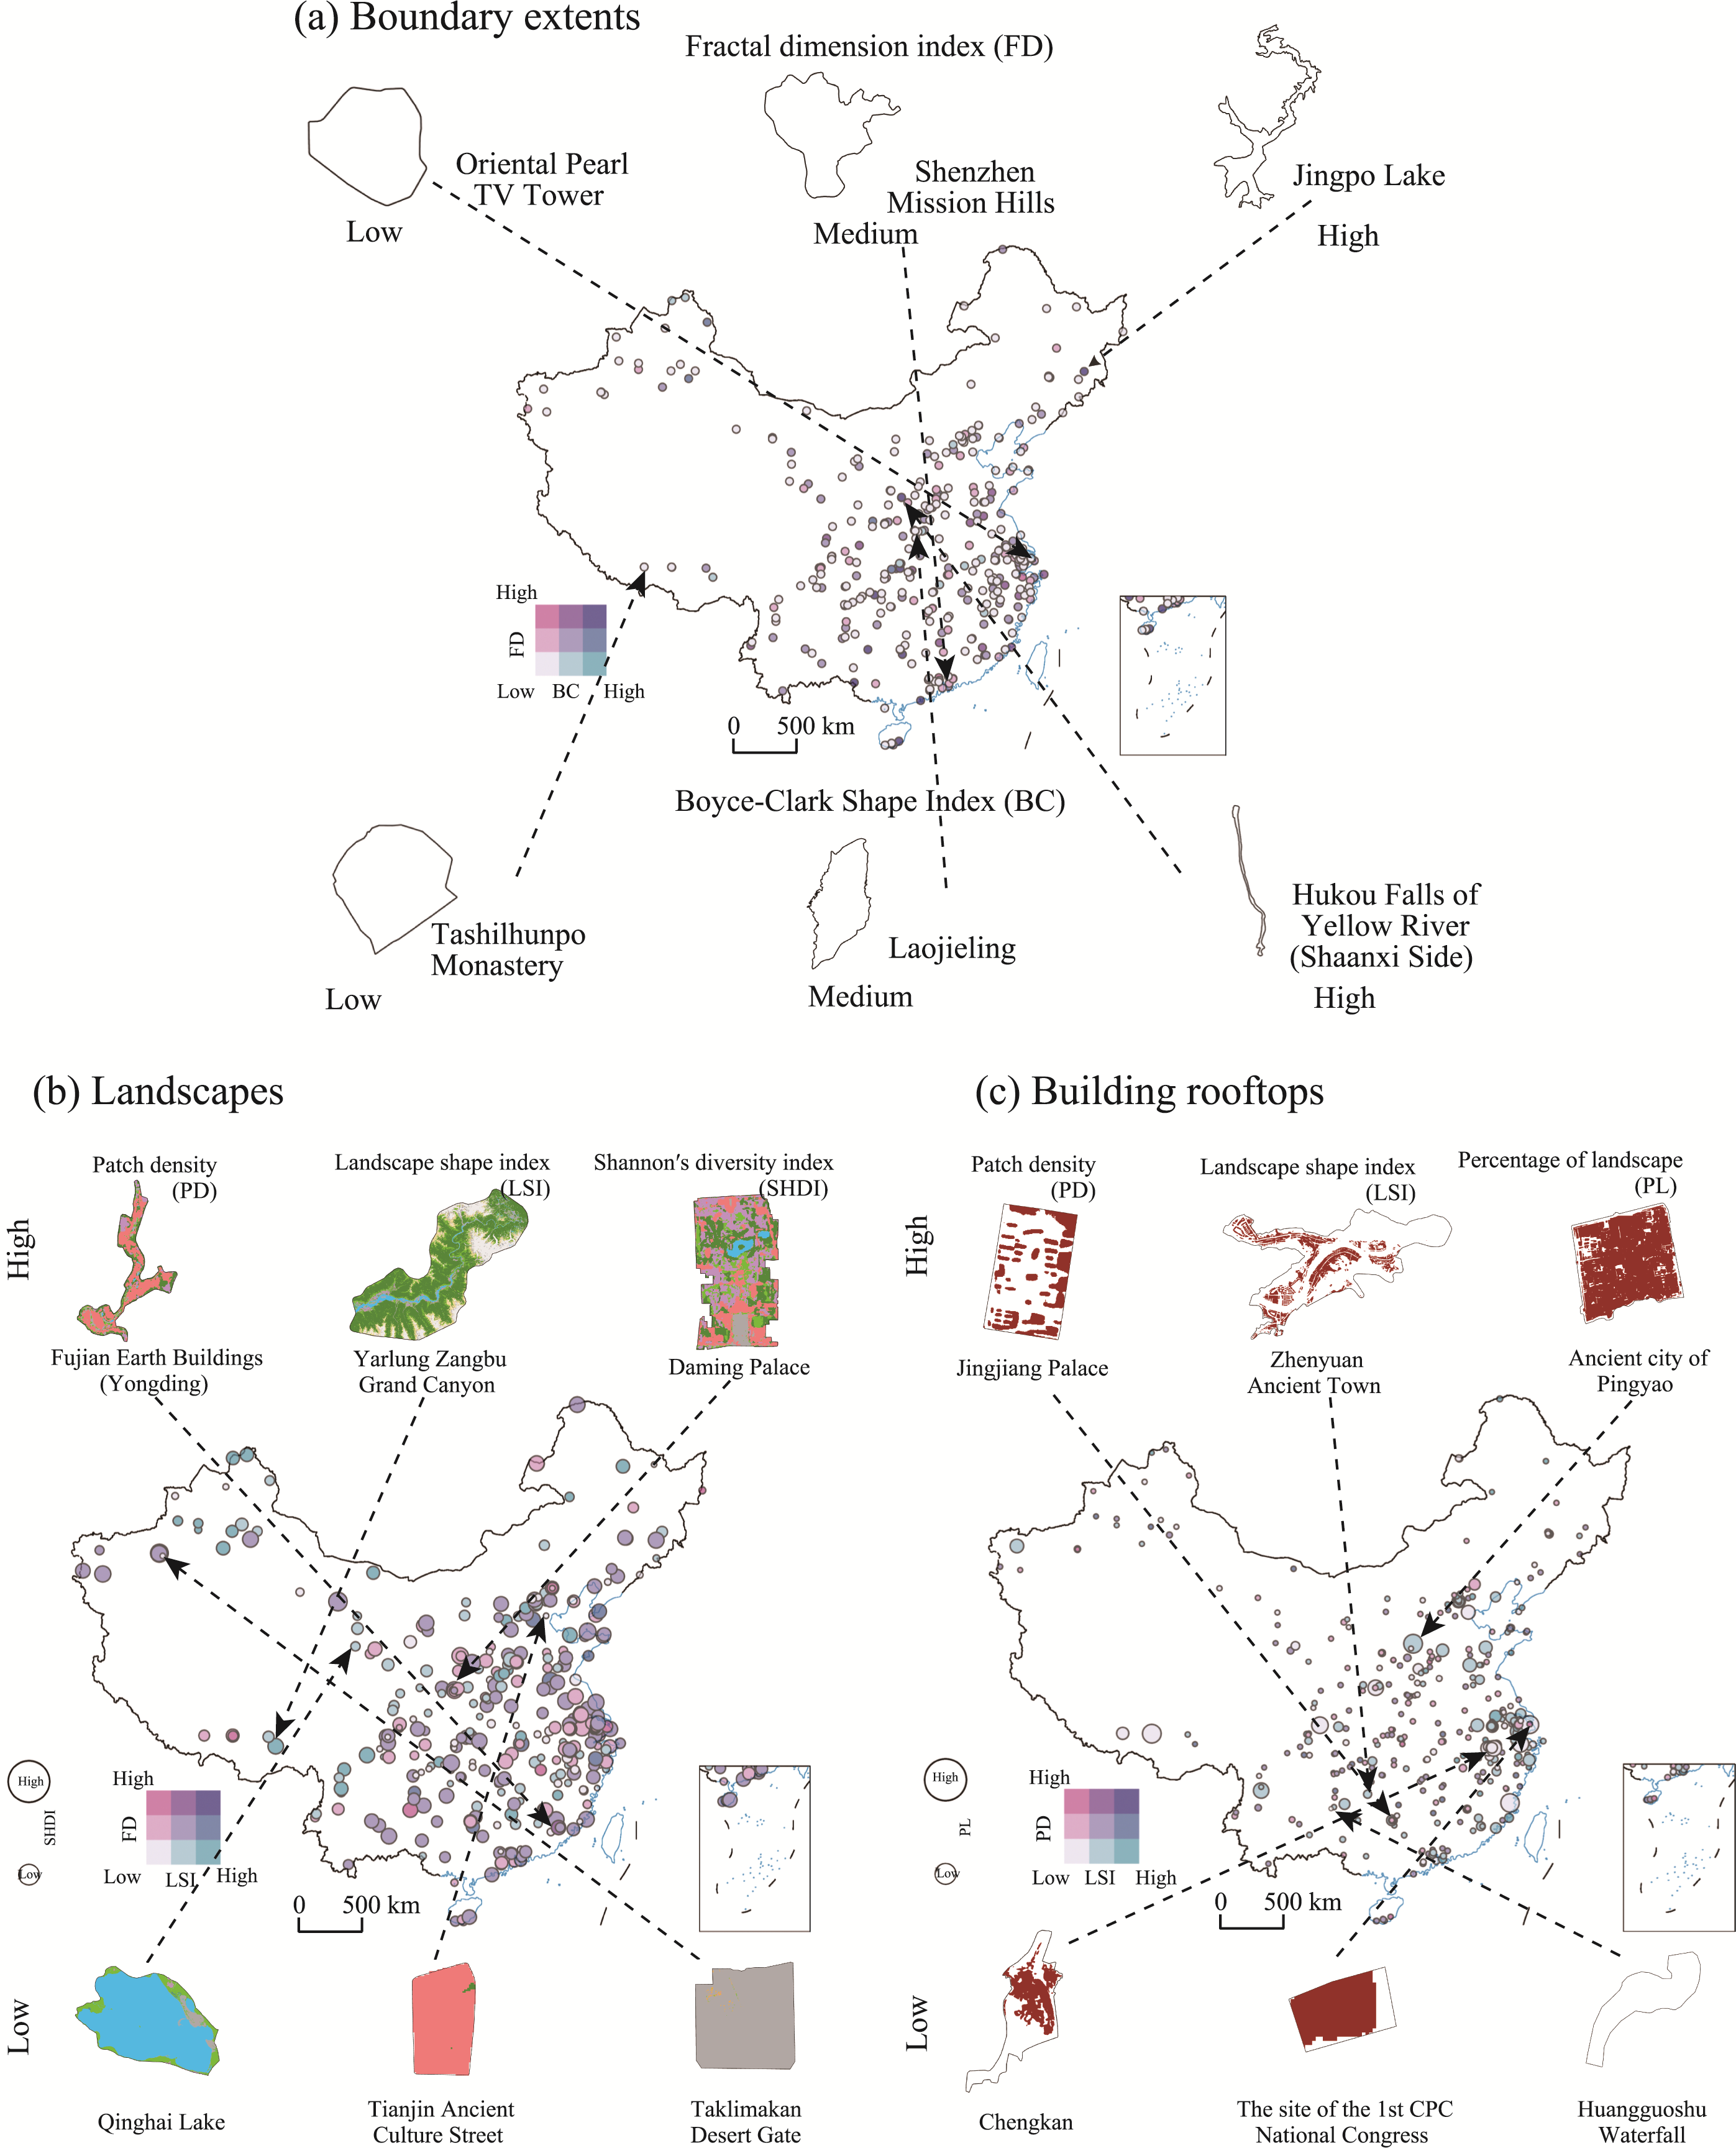
| Planes | Boundary extends | Fractal dimension | 0.219 | 1.759 | 0.08 |
| Boyce-Clark shape index* | -0.213 | -2.191 | 0.029 | ||
| Landscapes | Patch density | -0.128 | -0.424 | 0.672 | |
| Landscape shape index | -0.037 | -0.318 | 0.751 | ||
| Shannon’s diversity index | -0.086 | -1.489 | 0.137 | ||
| Building rooftops | Patch density | -0.04 | -0.165 | 0.869 | |
| Landscape shape index | 0.045 | 0.473 | 0.636 | ||
| Percentage of landscape | -0.005 | -0.081 | 0.936 | ||
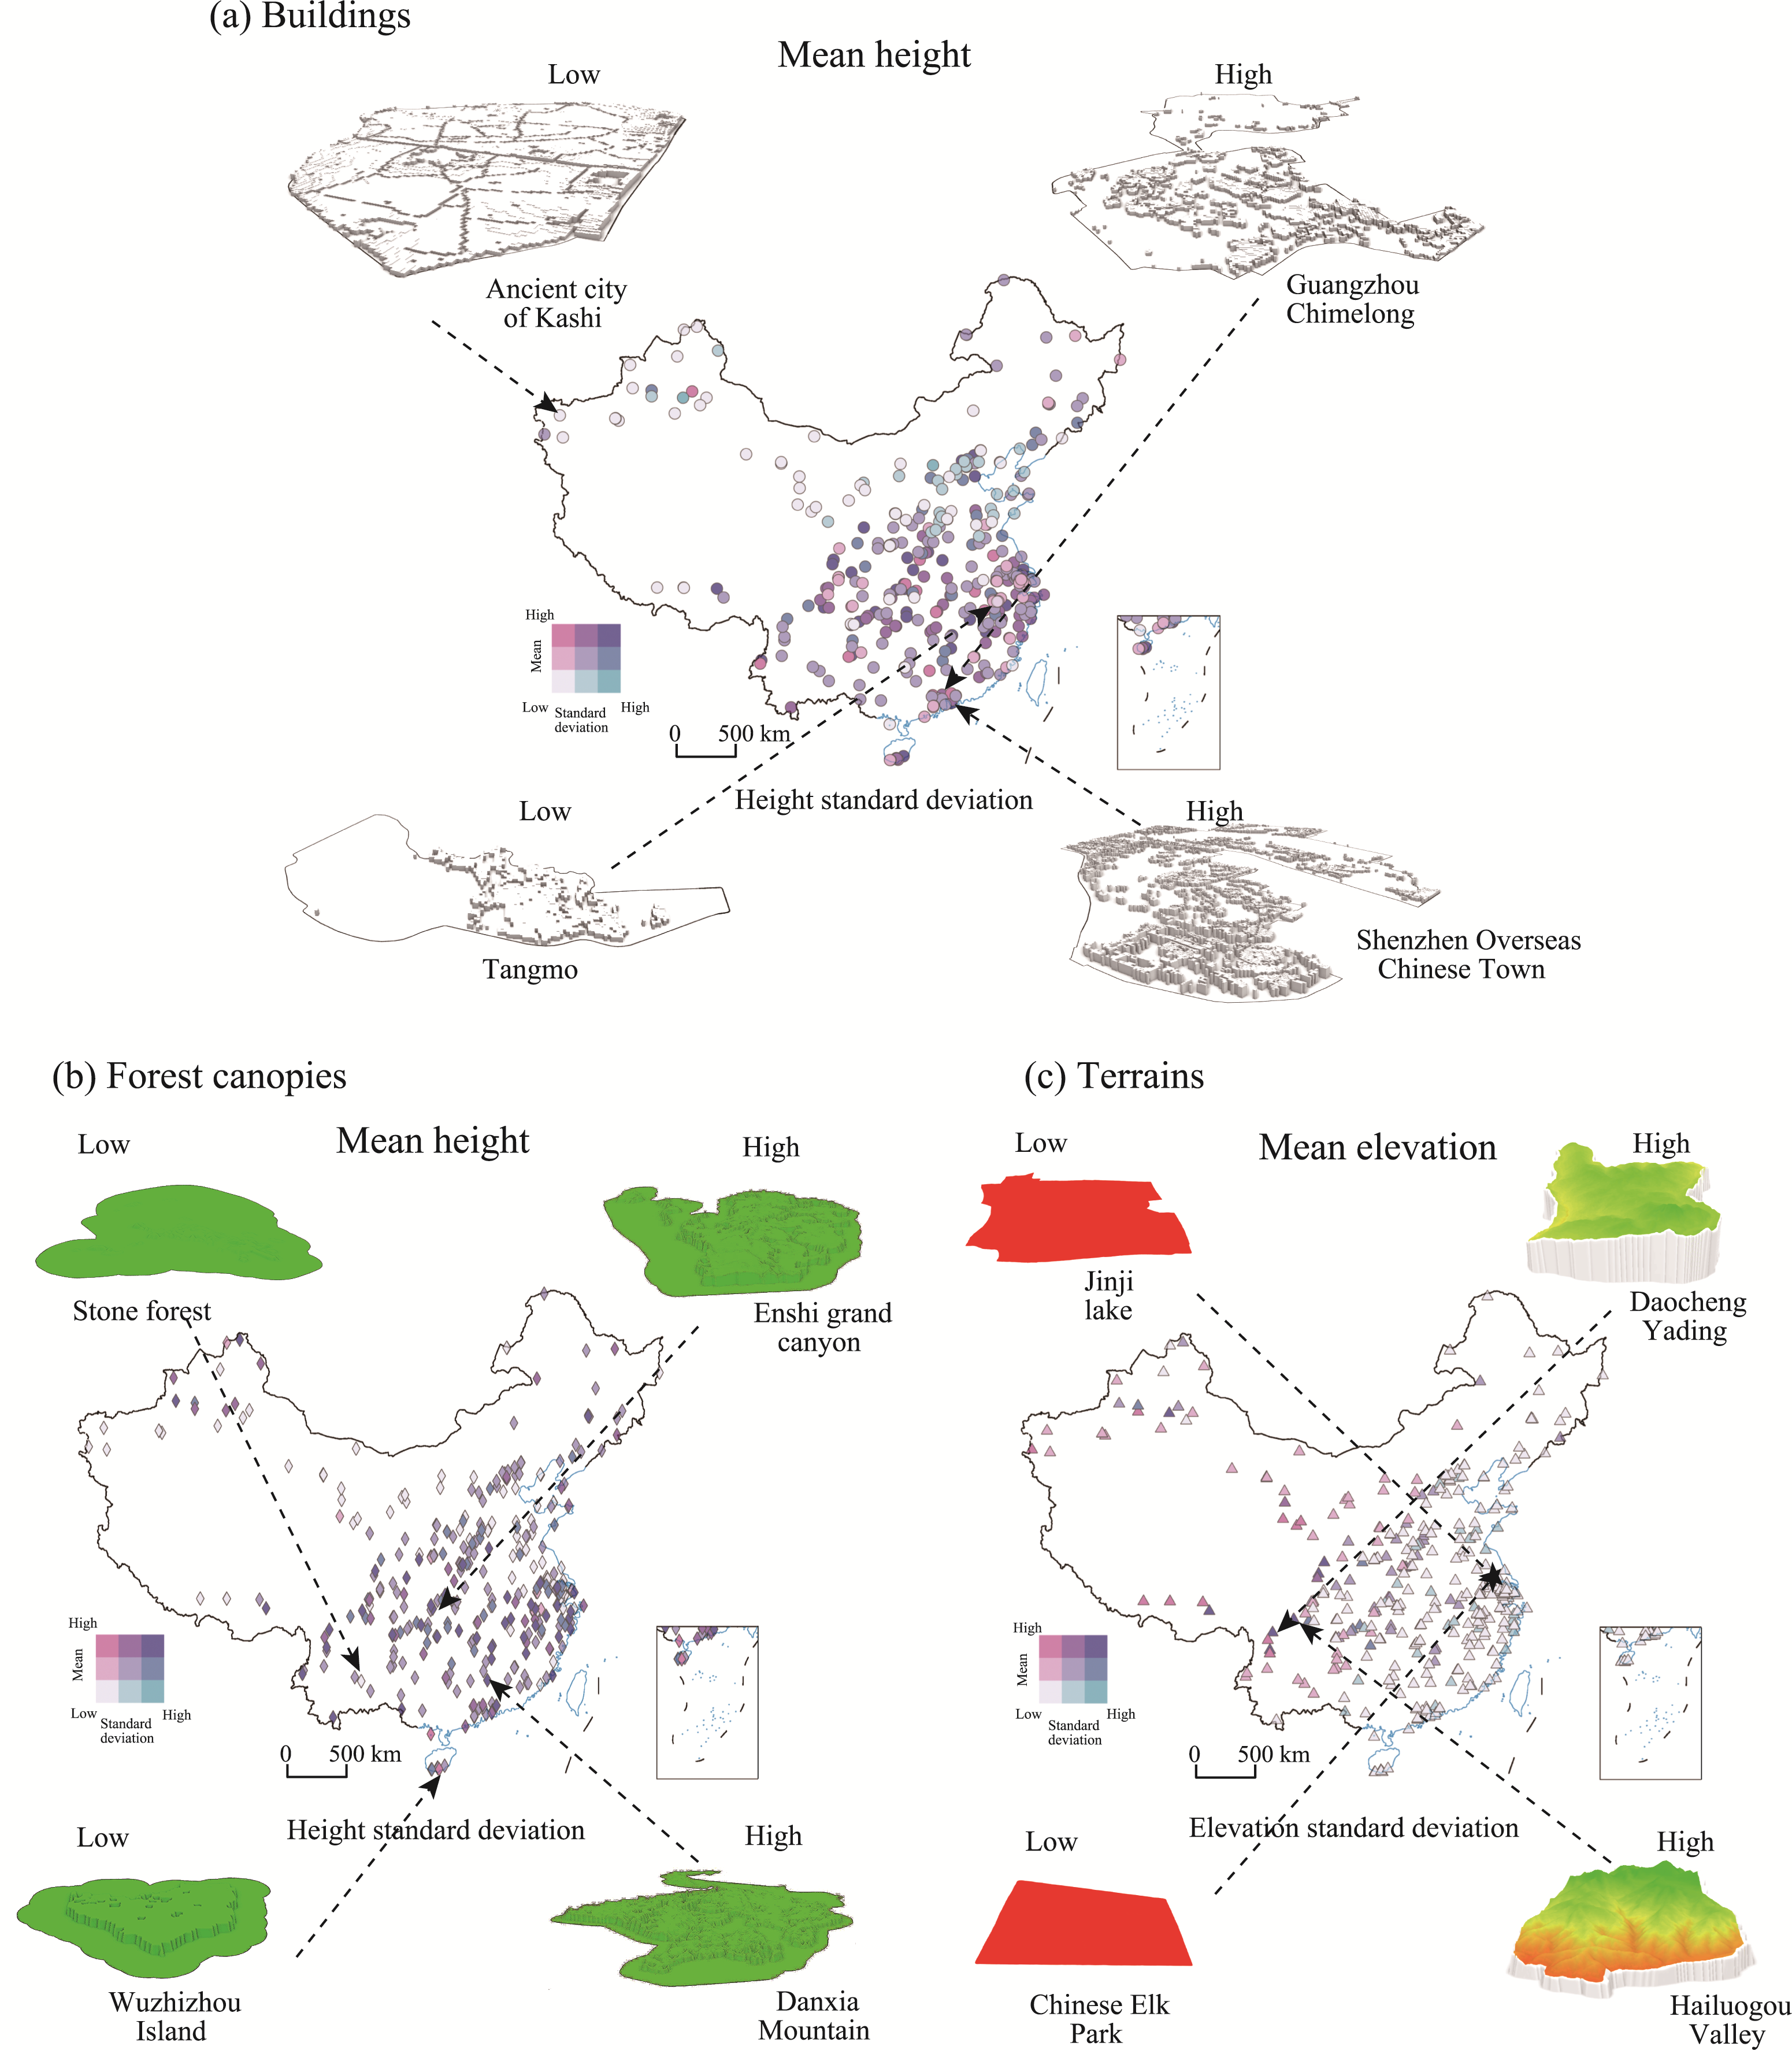
| Solids | Buildings | Mean height | -0.089 | -1.077 | 0.282 |
| Height standard deviation | 0.114 | 1.733 | 0.084 | ||
| Forest canopies | Mean height | 0.105 | 1.782 | 0.076 | |
| Height standard deviation | 0.007 | 0.089 | 0.929 | ||
| Terrains | Mean elevation | 0.057 | 1.095 | 0.274 | |
| Elevation standard deviation | 0.021 | 0.168 | 0.866 | ||
| * p<0.05 ** p<0.01 | |||||
| R2 | 0.125 | ||||
| Adjusted R2 | 0.064 | ||||