| Type | Name | Indicator | Grouping by resource | Grouping by economy | Grouping by area size | Grouping by urbanization | |||||
|---|---|---|---|---|---|---|---|---|---|---|---|
| Cultural | Natural | Developed | Underdeveloped | Large | Small | Extra- urban | Intra- urban | ||||
| Format: B (sig t ) [* p<0.05 ** p<0.01] | |||||||||||
| Points | Tourist Attractions | Average Nearest Neighbor Index | -0.064 (-0.342) | -0.091 (-1.274) | 0.150 (1.292) | -0.162* (-2.139) | -0.106 (-1.055) | 0.014 (0.157) | 0.034 (0.430) | -0.233 (-1.686) | |
| Hospitality Facilities | Average Nearest Neighbor Index | -0.024 (-0.171) | -0.062 (-0.738) | -0.087 (-0.776) | -0.058 (-0.633) | -0.010 (-0.077) | -0.088 (-0.976) | -0.076 (-0.779) | -0.015 (-0.122) | ||
| Transport Infrastructures | Average Nearest Neighbor Index | 0.118 (0.930) | 0.010 (0.124) | 0.097 (0.955) | 0.038 (0.429) | -0.088 (-0.634) | 0.136 (1.668) | 0.006 (0.073) | 0.214 (1.620) | ||
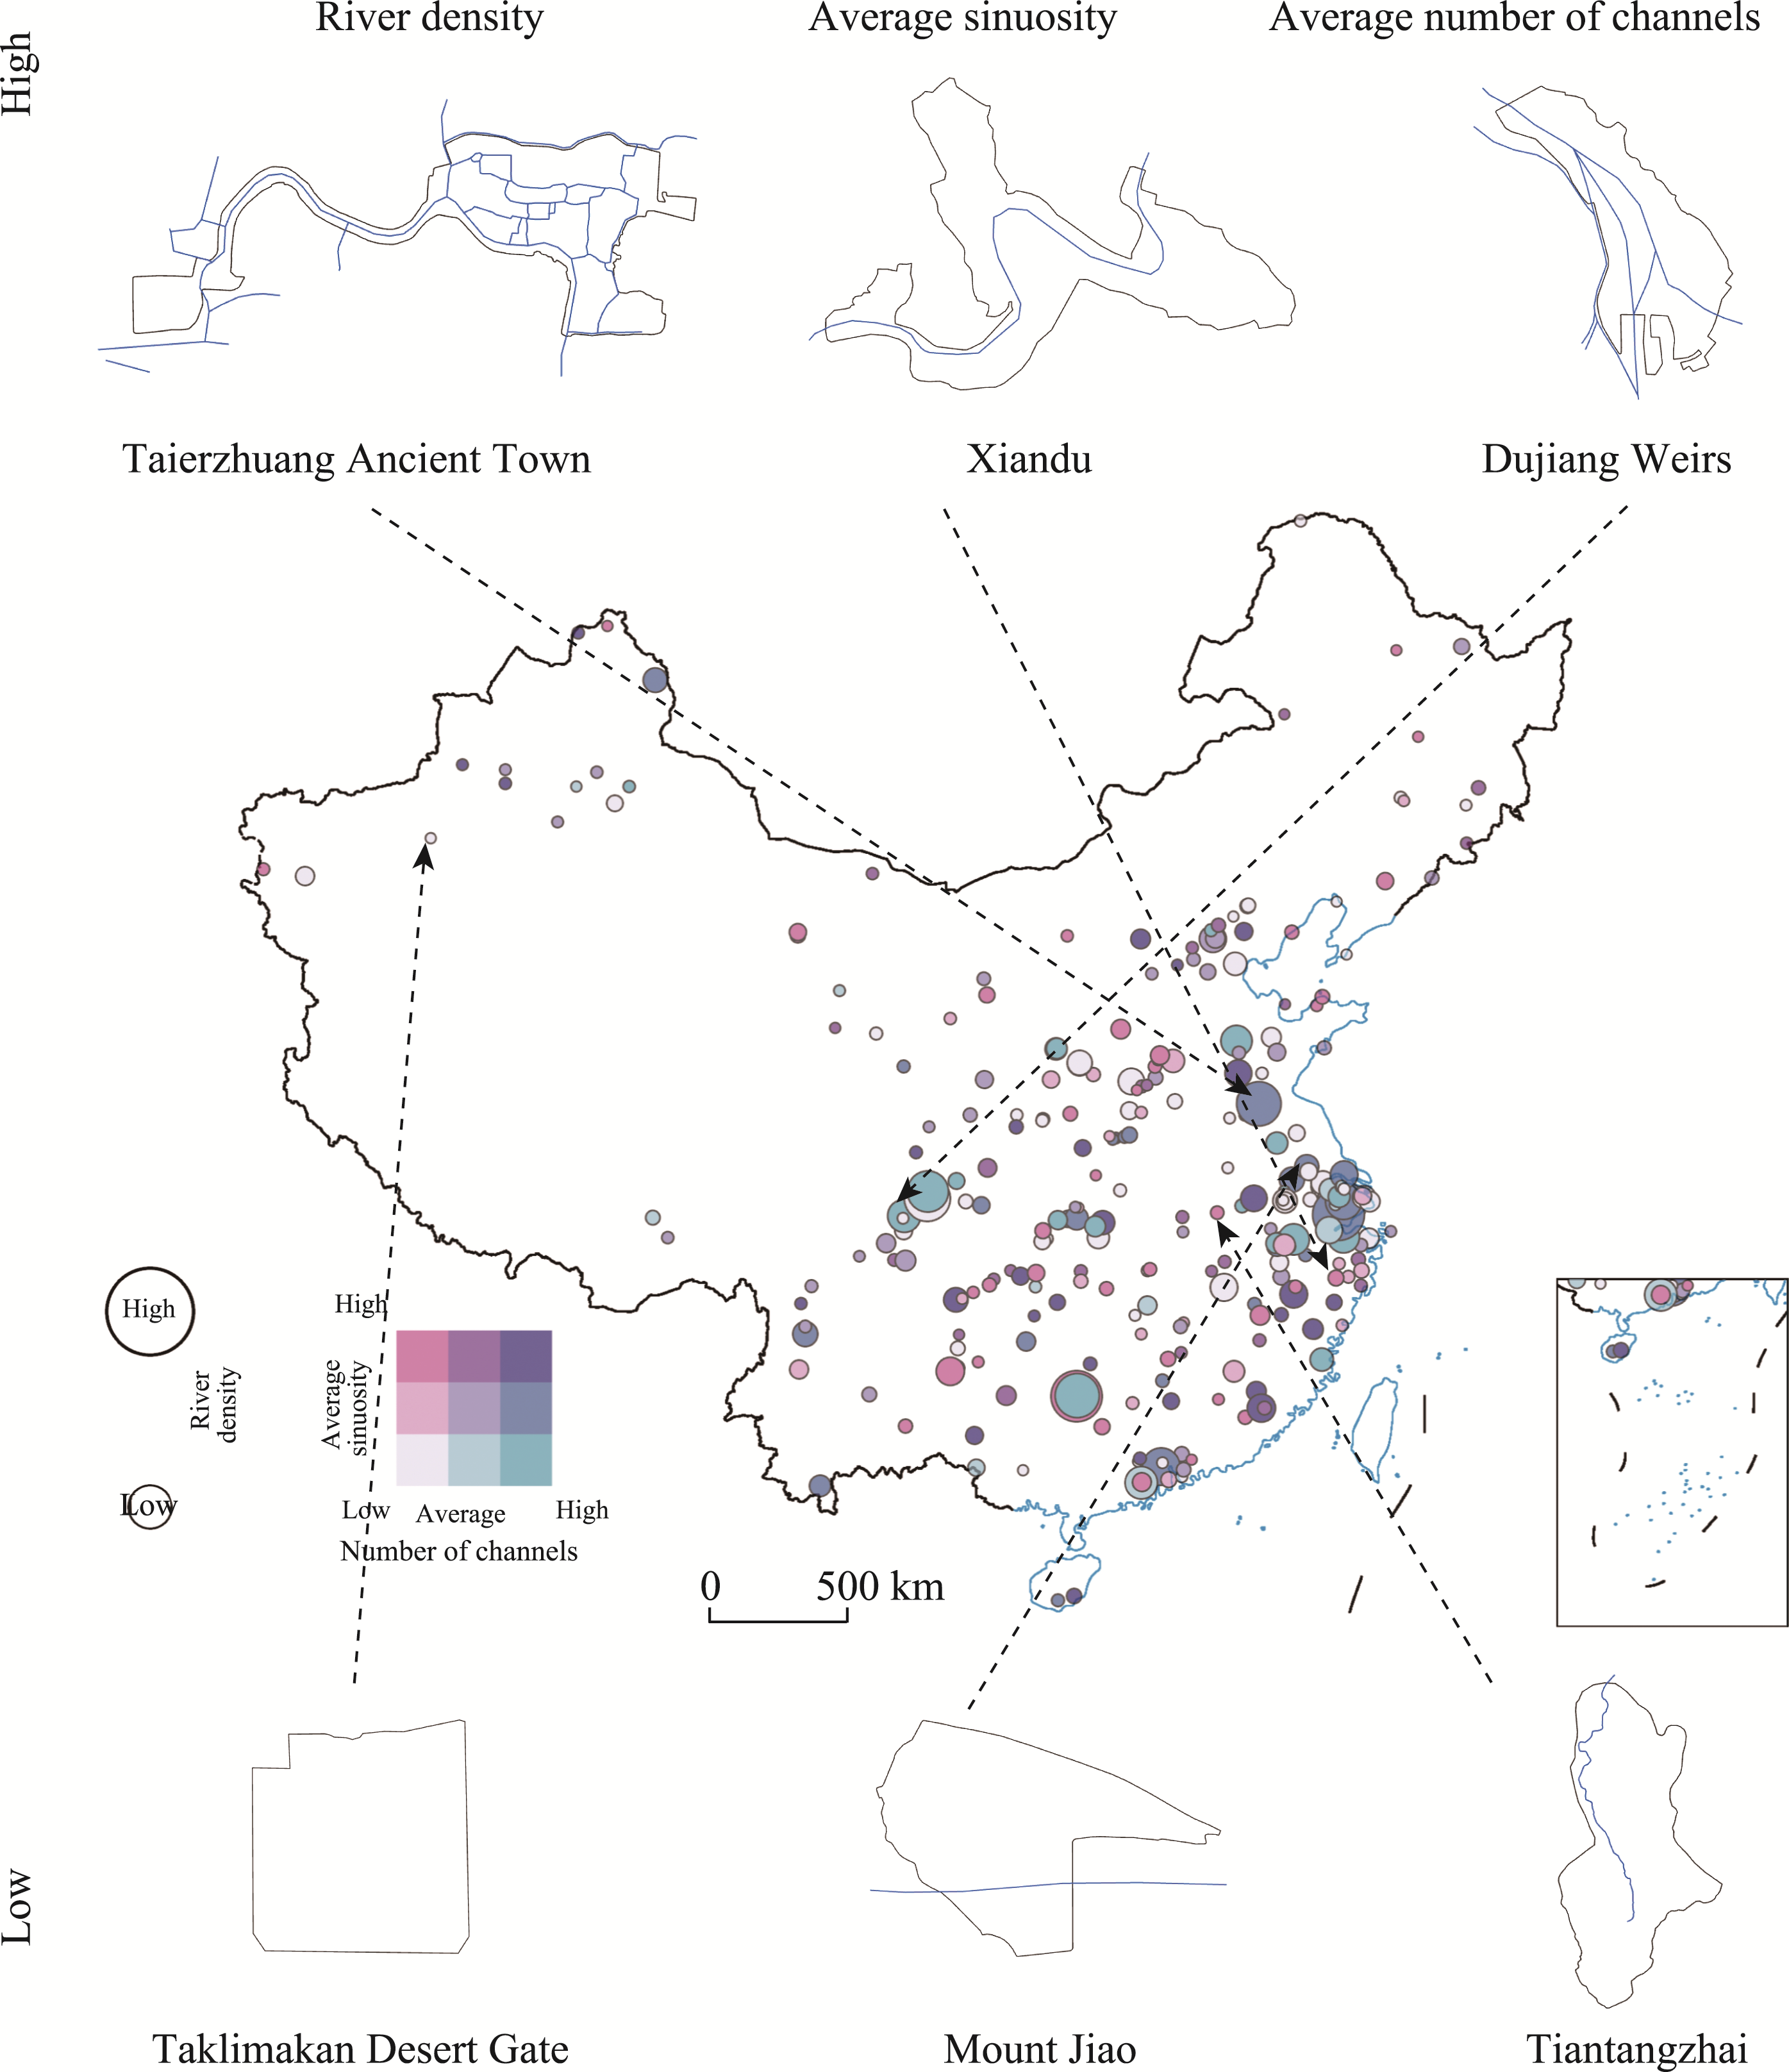
| Lines | Rivers | River Density | 0.131 (1.345) | 0.062 (0.690) | 0.013 (0.158) | 0.204* (2.258) | 0.089 (0.395) | 0.129 (1.862) | -0.042 (-0.352) | 0.174* (2.082) | |
| Roads | Average Degree | -0.340 (-1.486) | -0.059 (-0.601) | -0.101 (-0.752) | -0.072 (-0.598) | -0.516 (-1.913) | -0.206 (-1.643) | -0.096 (-0.945) | -0.394 (-1.656) | ||
| (Dead-end Edges Length)% | 0.103 (0.293) | -0.053 (-0.814) | -0.011 (-0.098) | -0.101 (-1.309) | -0.214* (-2.170) | -0.053 (-0.499) | -0.130 (-1.850) | 0.119 (0.675) | |||
| (Bridge Edges Length)% | 0.031 (0.314) | 0.031 (0.687) | 0.090 (1.417) | -0.019 (-0.358) | -0.011 (-0.191) | 0.044 (0.740) | 0.053 (1.102) | -0.040 (-0.407) | |||
| Road Density | 0.370** (2.721) | 0.564** (4.496) | 0.330** (3.260) | 0.322 (1.953) | 0.363 (1.764) | 0.358** (3.733) | 0.597* (2.245) | 0.307* (2.400) | |||
| Average Circuity | 0.372 (1.047) | 0.032 (0.281) | -0.034 (-0.193) | 0.127 (0.933) | -0.281 (-1.591) | 0.277 (1.642) | 0.049 (0.417) | 0.715 (1.631) | |||
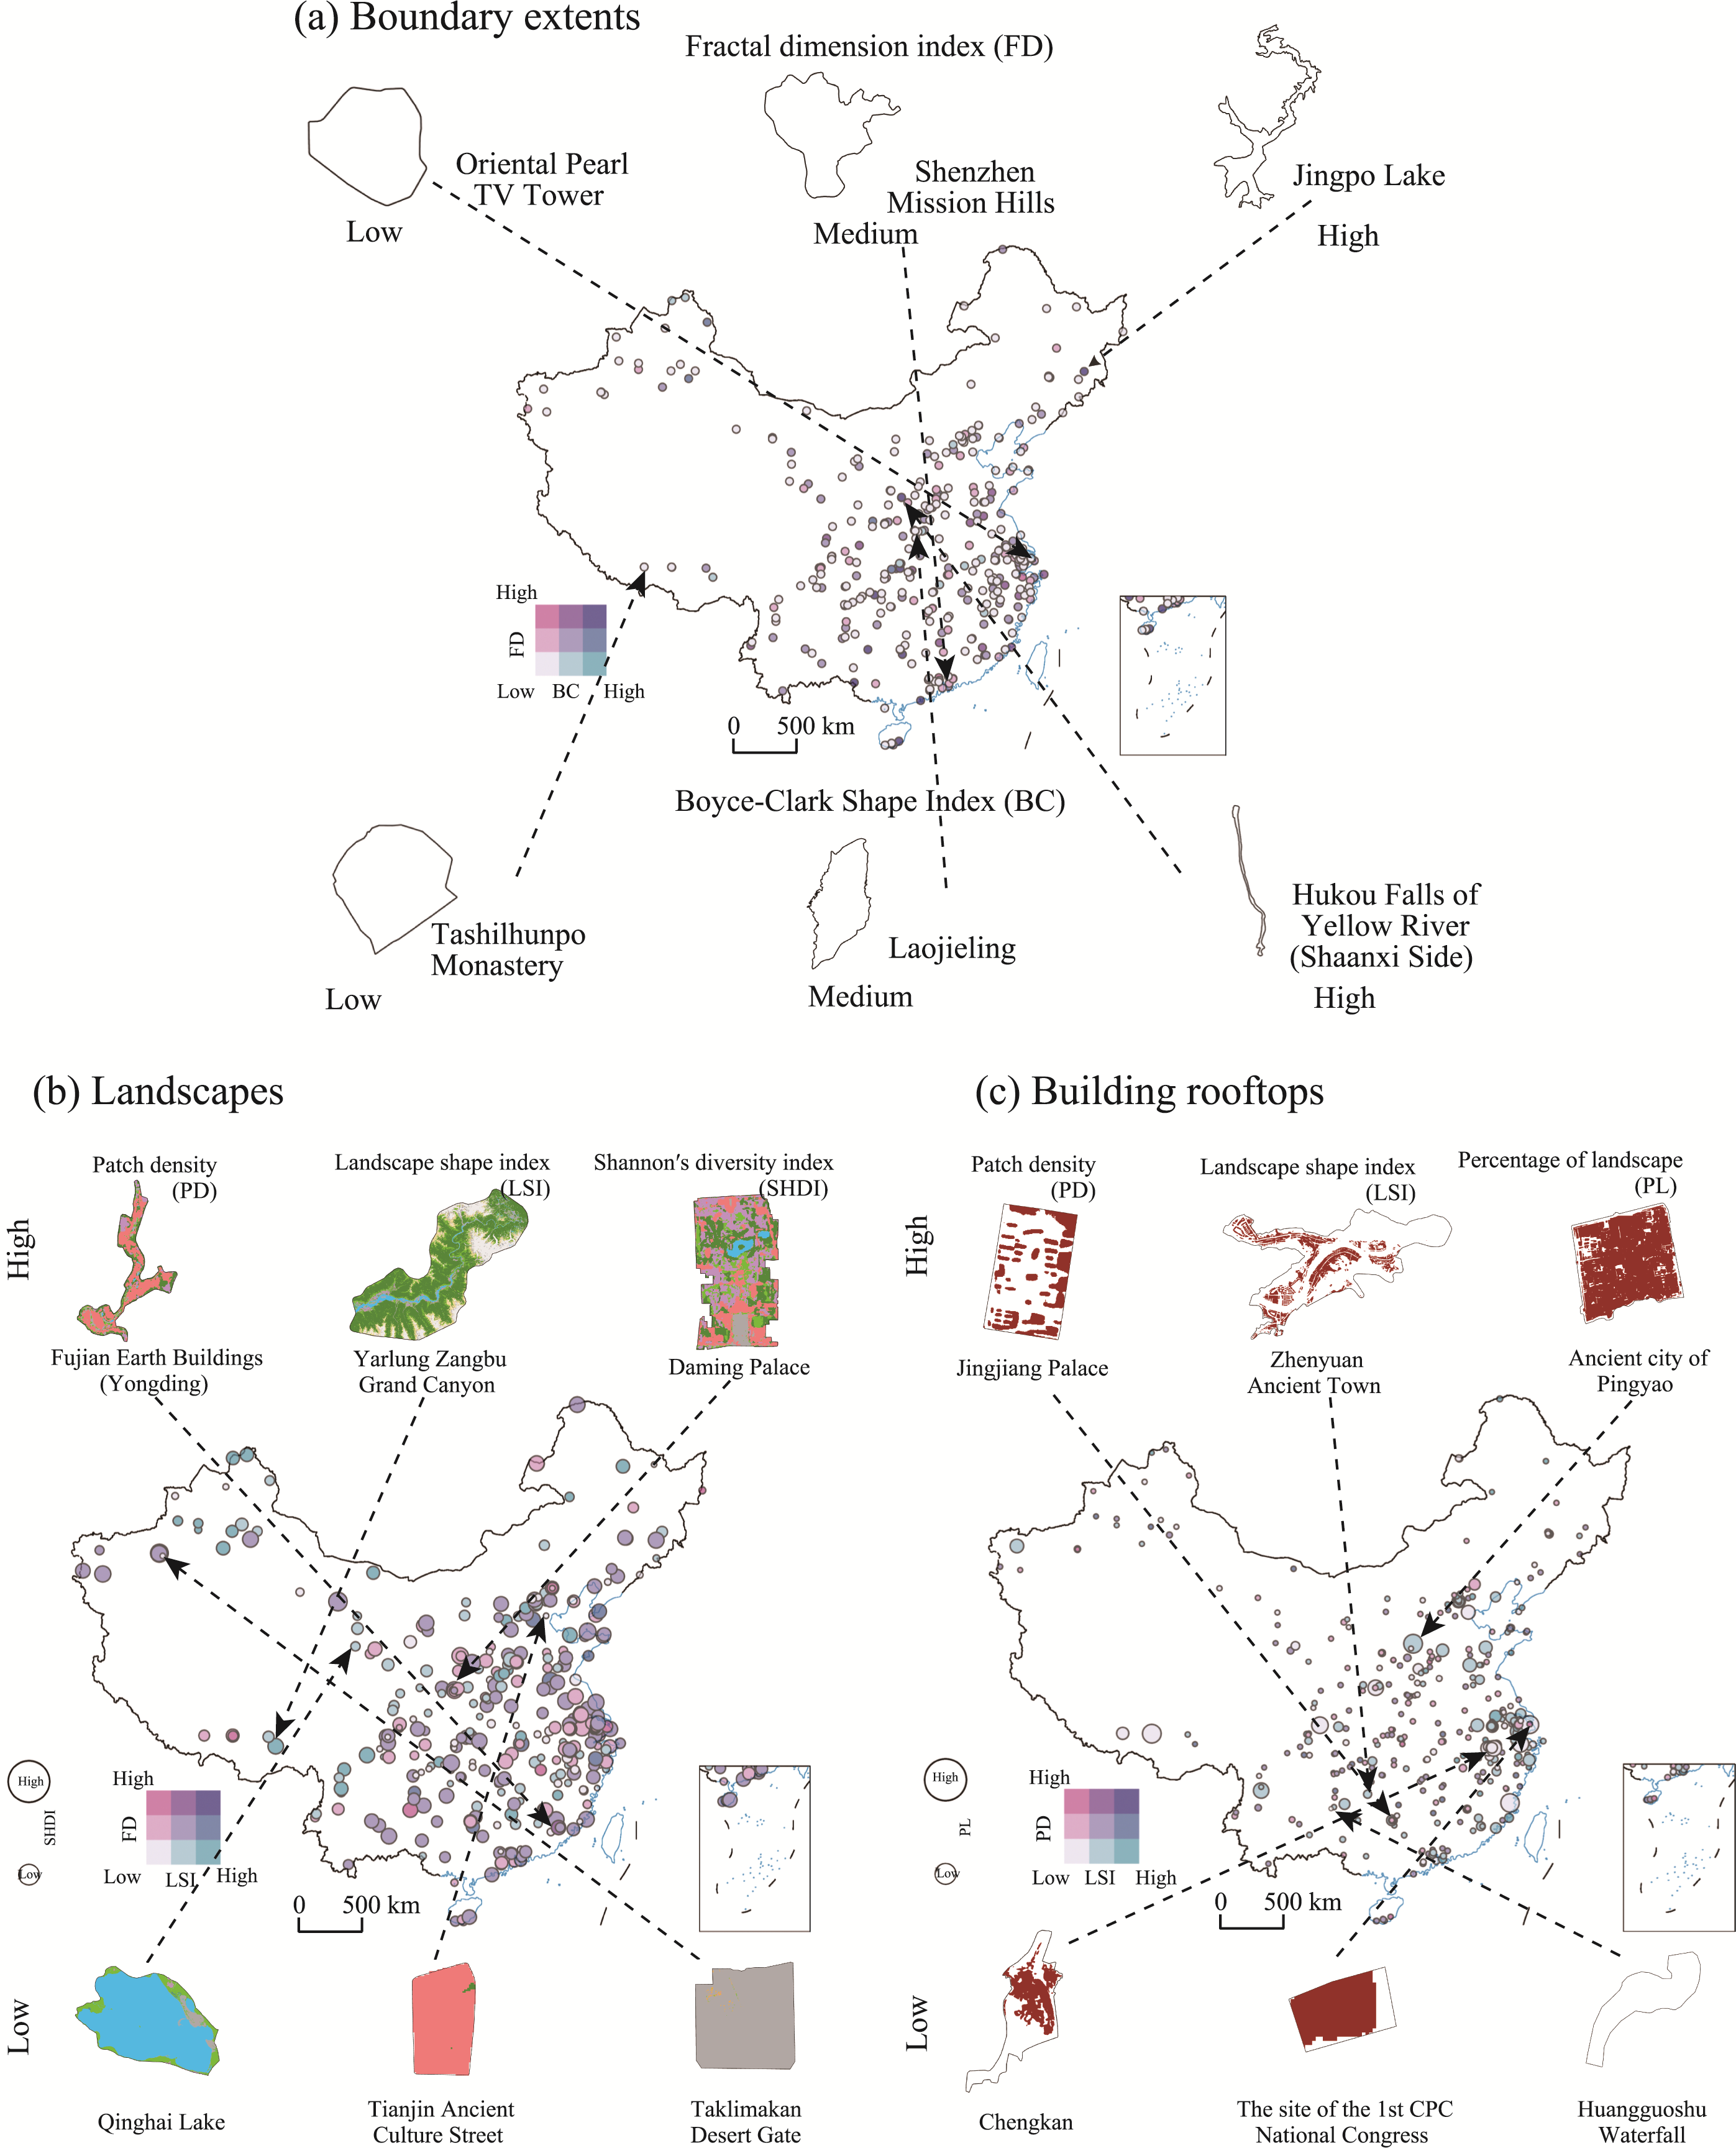
| Planes | Boundary Extends | Fractal Dimension | 0.102 (0.415) | 0.309 (1.928) | 0.294 (1.749) | 0.313 (1.575) | 0.314 (1.488) | 0.237 (1.406) | 0.393* (2.287) | 0.034 (0.153) | |
| Boyce-Clark Shape Index | -0.167 (-0.715) | -0.011 (-0.098) | -0.176 (-1.294) | -0.041 (-0.292) | -0.274 (-1.777) | -0.004 (-0.030) | -0.135 (-1.087) | 0.046 (0.244) | |||
| Landscapes | Patch Density | 0.325 (0.595) | -1.027* (-2.148) | -0.356 (-0.852) | -0.896* (-1.998) | 0.855 (0.496) | -0.742* (-1.982) | -0.824 (-1.687) | -0.309 (-0.630) | ||
| Landscape Shape Index | 1.532 (1.156) | -0.200 (-1.678) | -0.121 (-0.446) | -0.156 (-1.053) | -0.102 (-0.814) | 0.267 (0.381) | -0.135 (-1.113) | 1.899 (1.724) | |||
| Shannon’s Diversity Index | -0.120 (-0.648) | 0.055 (0.832) | 0.024 (0.259) | 0.006 (0.080) | -0.036 (-0.334) | 0.017 (0.181) | 0.034 (0.473) | -0.120 (-0.924) | |||
| Building Rooftops | Patch Density | 0.290 (0.160) | -0.235 (-0.892) | 0.036 (0.072) | 0.074 (0.247) | -0.996 (-1.015) | -0.121 (-0.439) | 0.150 (0.384) | -0.323 (-0.861) | ||
| Landscape Shape Index | -0.362 (-0.832) | 0.273** (2.629) | 0.166 (1.192) | 0.269 (1.576) | 0.198 (1.876) | -0.311 (-1.077) | 0.220* (2.142) | -0.634 (-1.553) | |||
| Percentage of Landscape | 0.066 (0.486) | -1.452** (-3.447) | 0.045 (0.514) | 0.009 (0.081) | -0.638 (-1.179) | 0.091 (1.160) | 0.067 (0.372) | 0.055 (0.566) | |||
| Format: B (sig t ) [* p<0.05 ** p<0.01] | |||||||||||
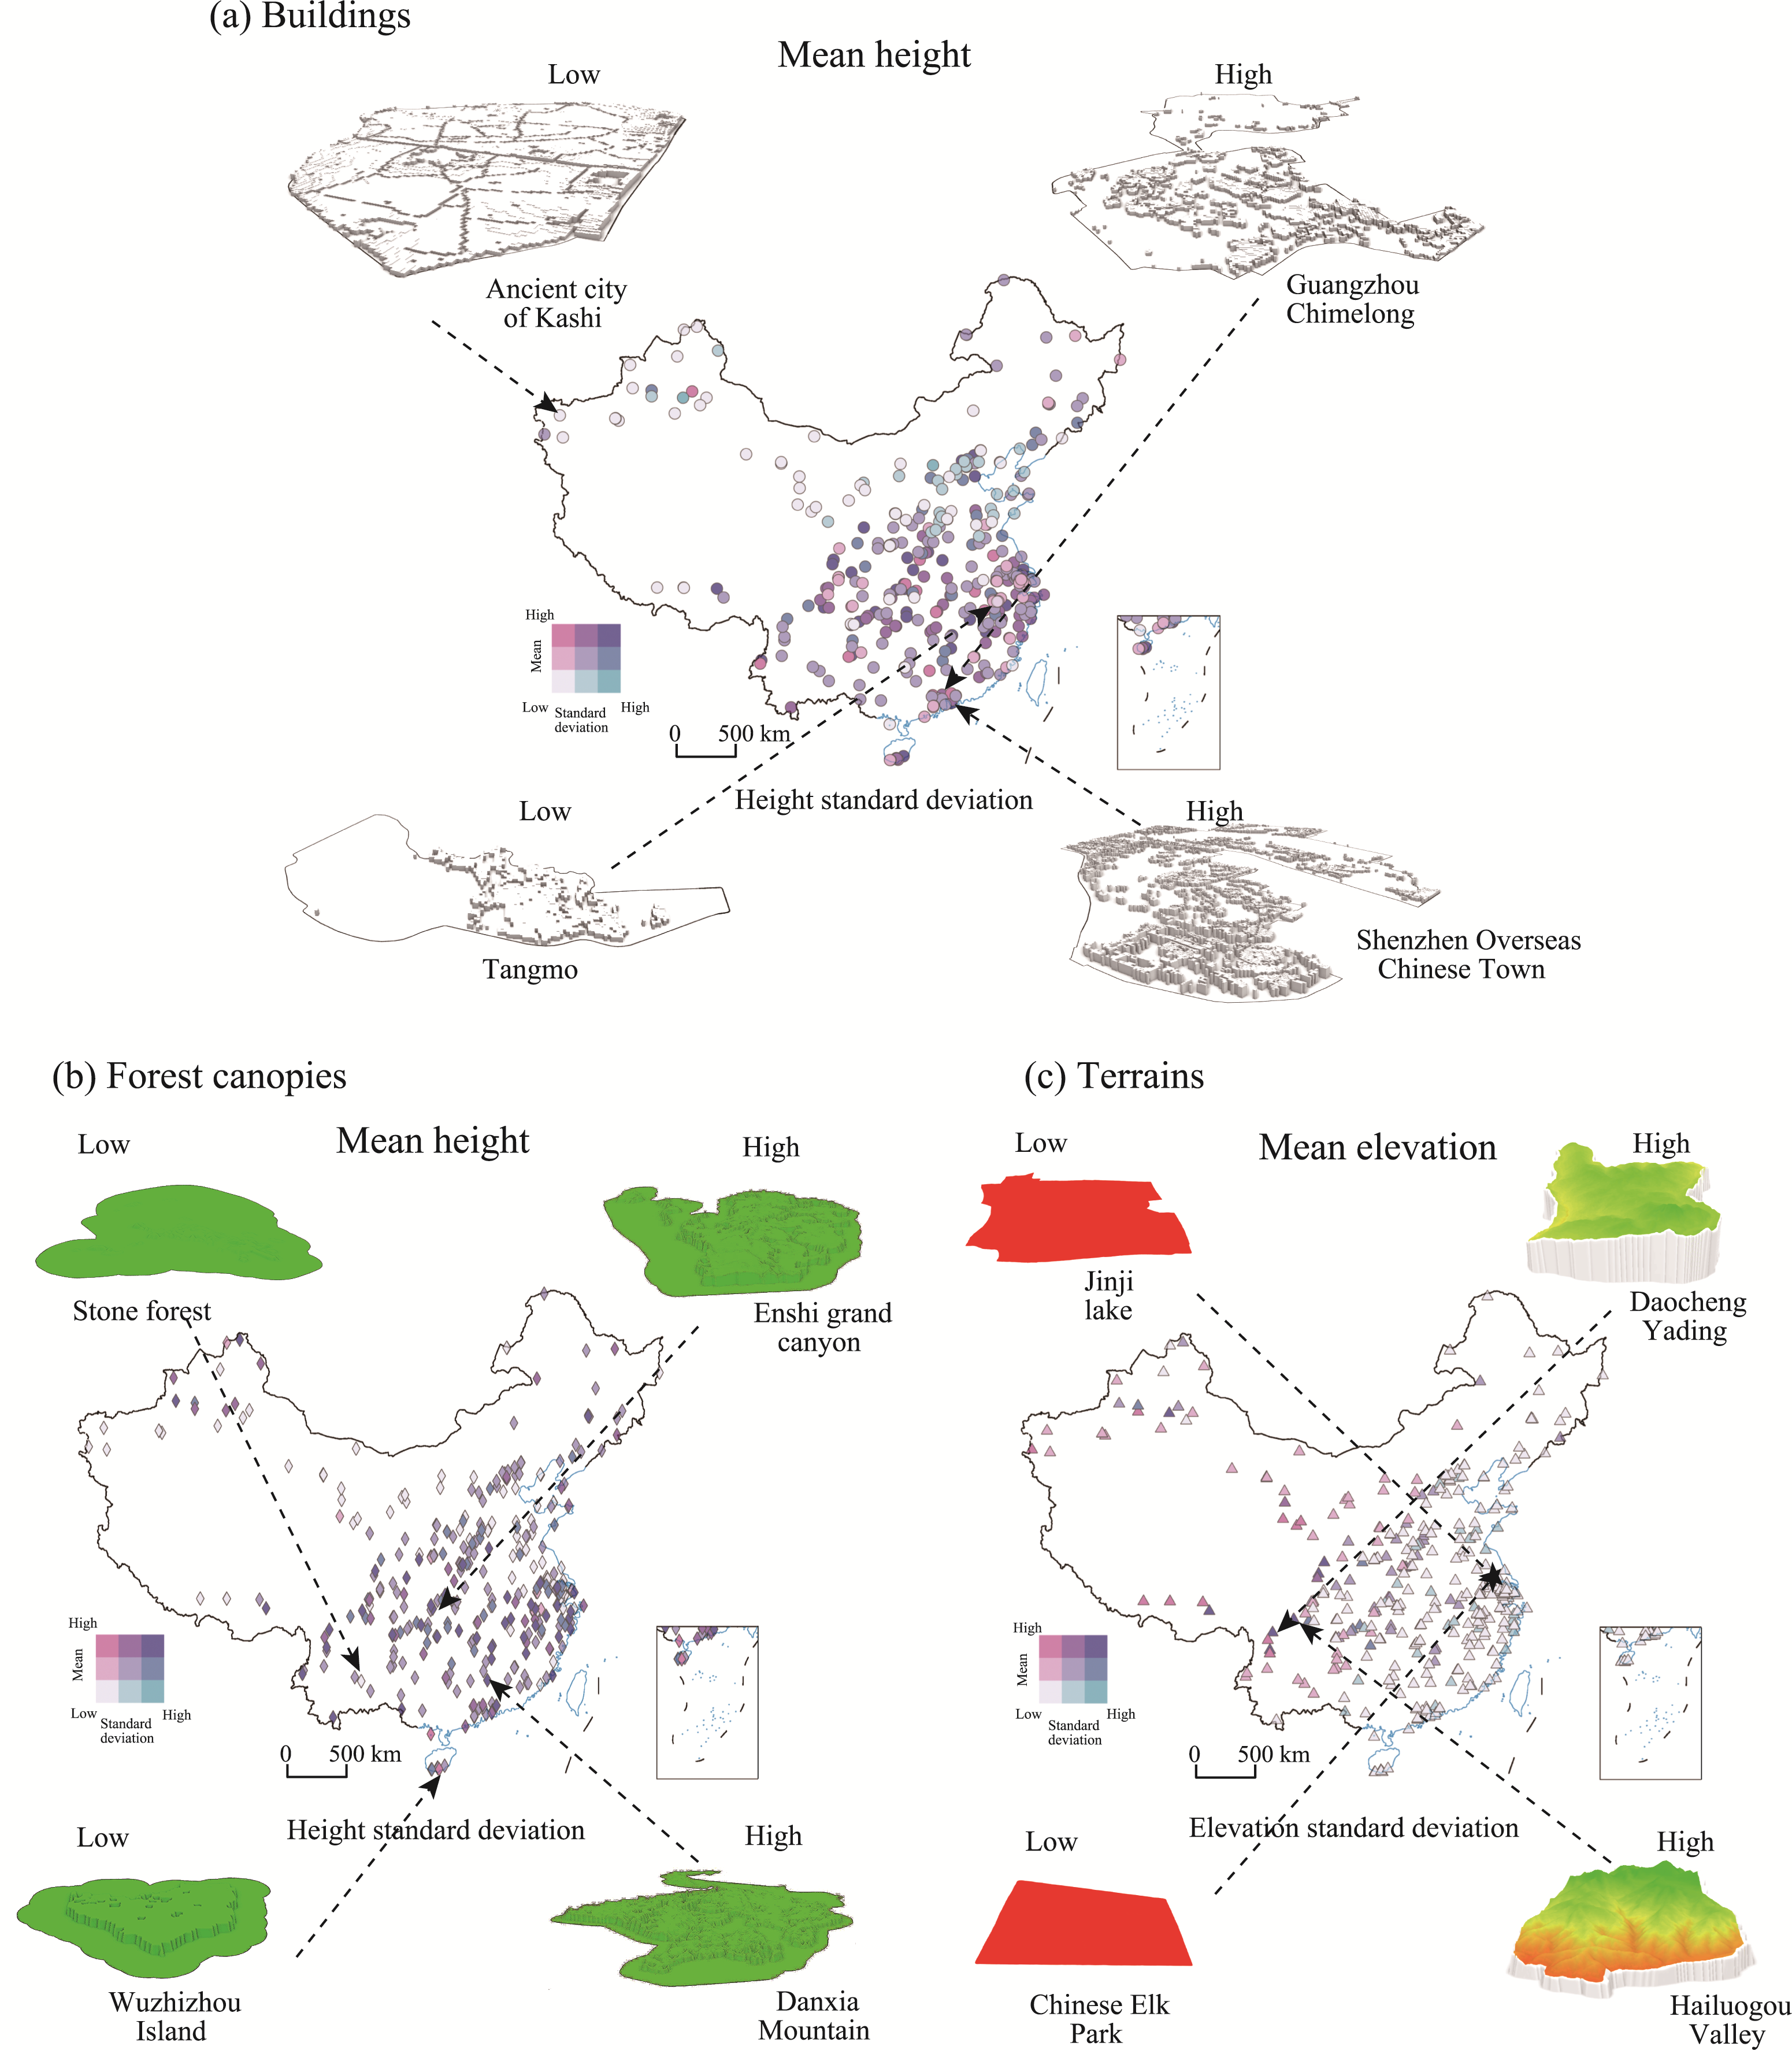
| Solids | Buildings | Mean Height | -0.270 (-1.181) | -0.102 (-1.224) | -0.214 (-1.532) | -0.112 (-1.192) | -0.093 (-0.805) | -0.197 (-1.765) | -0.121 (-1.303) | -0.162 (-0.961) | |
| Height Standard Deviation | 0.070 (0.410) | 0.120 (1.761) | 0.202* (2.007) | 0.041 (0.521) | 0.072 (0.818) | 0.187 (1.916) | 0.180* (2.491) | 0.020 (0.124) | |||
| Forest Canopies | Mean Height | -0.091 (-0.486) | 0.220** (3.484) | 0.138 (1.452) | 0.190* (2.546) | 0.147 (1.688) | 0.107 (1.227) | 0.171* (2.493) | -0.009 (-0.064) | ||
| Height Standard Deviation | 0.136 (0.517) | -0.255** (-3.202) | -0.197 (-1.616) | -0.133 (-1.372) | -0.082 (-0.813) | -0.107 (-0.889) | -0.204* (-2.337) | 0.059 (0.322) | |||
| Terrains | Mean Elevation | 0.021 (0.189) | 0.130* (2.086) | 0.142 (1.413) | 0.212** (3.759) | 0.153* (2.130) | 0.169* (2.252) | 0.148* (2.273) | 0.119 (1.165) | ||
| Elevation Standard Deviation | 2.671 (0.986) | 0.152 (1.176) | 0.180 (0.671) | 0.058 (0.436) | 0.144 (1.102) | -0.085 (-0.169) | 0.144 (1.063) | -0.742 (-0.442) | |||
| R2 | 0.259 | 0.276 | 0.182 | 0.369 | 0.310 | 0.222 | 0.192 | 0.323 | |||
| Adjusted R2 | 0.034 | 0.207 | 0.081 | 0.258 | 0.163 | 0.136 | 0.106 | 0.168 | |||
| Chow test | F=1.689,p=0.025 | F=1.143,p=0.295 | F=1.042,p=0.412 | F=1.022,p=0.438 | |||||||