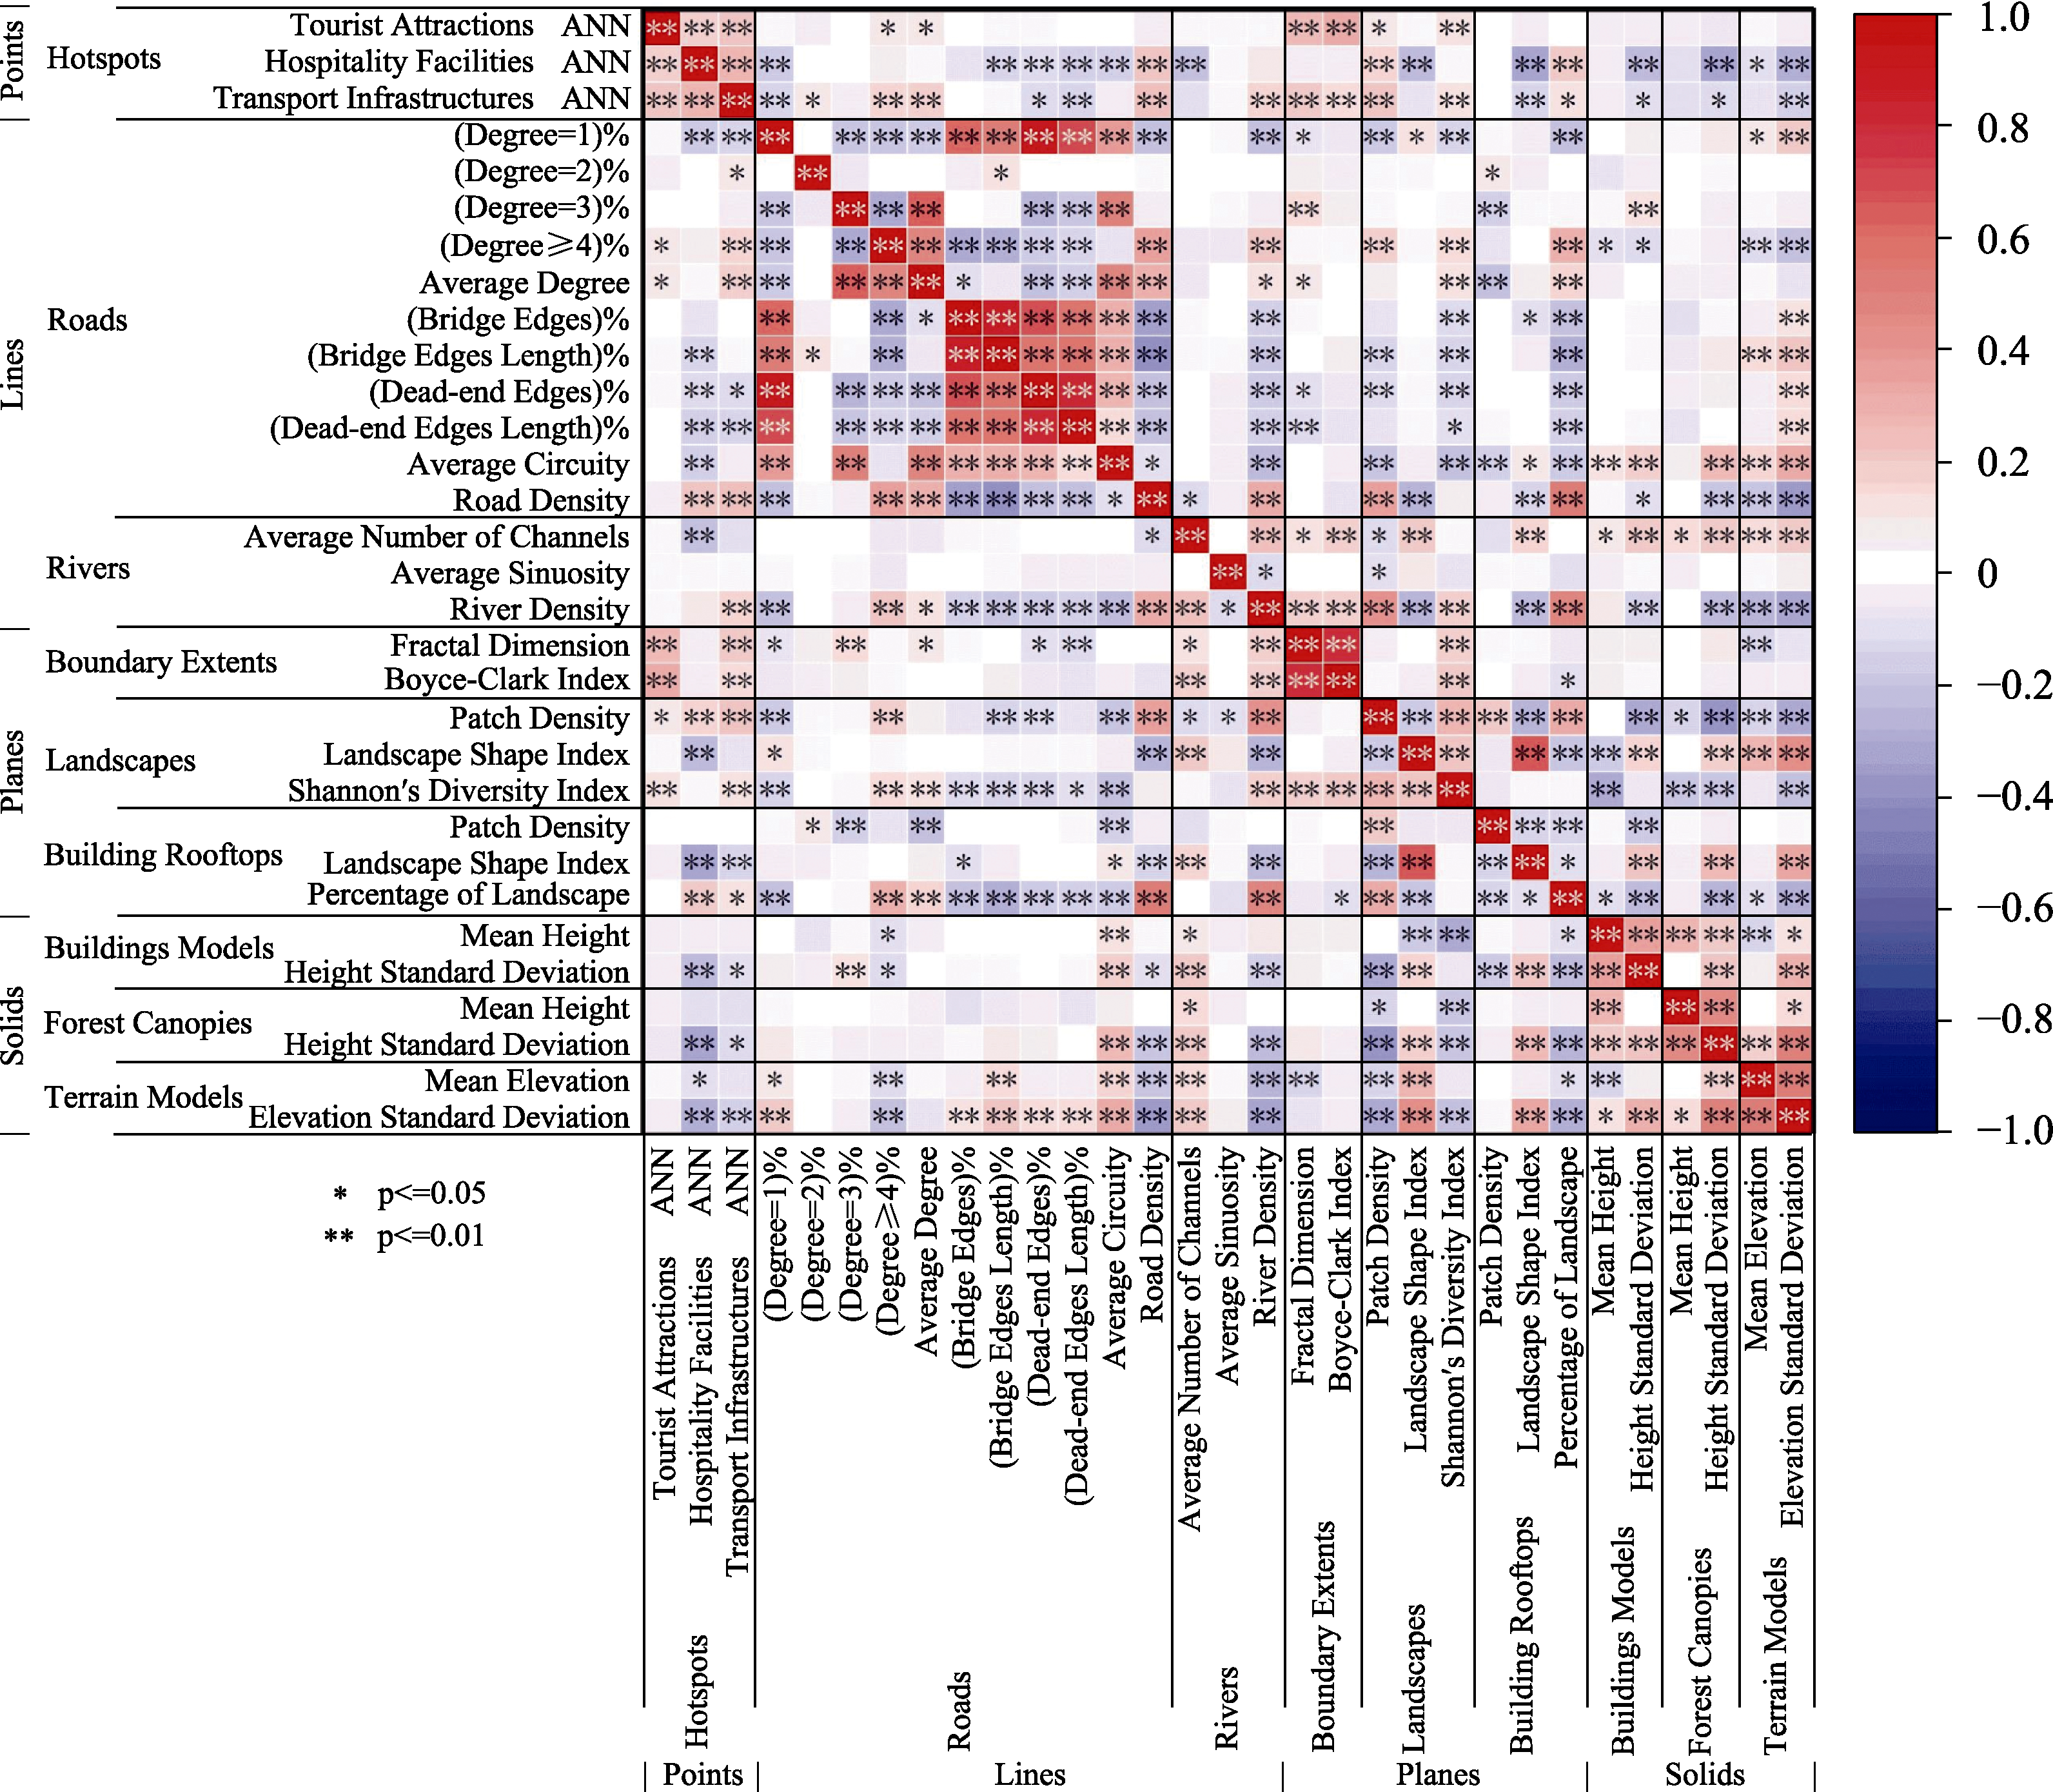
| Type | Name | Indicator | B | t | p |
|---|---|---|---|---|---|
| Points | Tourist attractions | Average nearest neighbor index | -0.048 | -0.727 | 0.468 |
| Hospitality facilities | Average nearest neighbor index | -0.047 | -0.662 | 0.509 | |
| Transport infrastructures | Average nearest neighbor index | 0.088 | 1.312 | 0.191 | |
| Lines | Roads | Average degree | -0.132 | -1.491 | 0.137 |
| (Bridge edges length)% | 0.031 | 0.746 | 0.456 | ||
| (Dead-end edges length)% | -0.070 | -1.076 | 0.283 | ||
| Average circuity | 0.117 | 1.076 | 0.283 | ||
| Road density** | 0.356 | 4.479 | <0.001 | ||
| Rivers | River density | 0.111 | 1.826 | 0.069 | |
| Planes | Boundary extends | Fractal dimension* | 0.306 | 2.477 | 0.014 |
| Boyce-Clark shape index | -0.109 | -1.136 | 0.257 | ||
| Landscapes | Patch density | -0.500 | -1.709 | 0.088 | |
| Landscape shape index | -0.117 | -1.020 | 0.309 | ||
| Shannon’s diversity index | 0.018 | 0.326 | 0.745 | ||
| Building rooftops | Patch density | -0.127 | -0.521 | 0.603 | |
| Landscape shape index* | 0.200 | 2.109 | 0.036 | ||
| Percentage of landscape | 0.023 | 0.346 | 0.729 | ||
| Solids | Buildings | Mean height | -0.142 | -1.798 | 0.073 |
| Height standard deviation* | 0.129 | 2.027 | 0.043 | ||
| Forest canopies | Mean height* | 0.133 | 2.282 | 0.023 | |
| Height standard deviation | -0.145 | -1.905 | 0.058 | ||
| Terrains | Mean elevation** | 0.156 | 3.047 | 0.002 | |
| Elevation standard deviation | 0.110 | 0.879 | 0.380 | ||
| * p<0.05 ** p<0.01 | |||||
| R2 | 0.187 | ||||
| Adjusted R2 | 0.132 | ||||