×
模态框(Modal)标题
在这里添加一些文本
Close
Close
Submit
Cancel
Confirm
×
模态框(Modal)标题
×
Journal
Article
Figure
Search
EN
中文
Home
About Journal
About Journal
Indexed in
Awards
Editorial Board
Guide for Authors
Browse
Current Issue
Online First
Archive
Highlights
Topic
Archive by Subject
Most Viewed
Most Download
Most Cited
E-mail Alert
RSS
Subscribe
Advertisement
Contact us
EN
中文
Figure/Table detail
Spatiotemporal heterogeneities in vegetation phenophase responses to climate extremes in arid mountains of Central Asia
ZHENG Lilin, CHEN Ruishan, XU Jianhua, JIA Nan, LI Yinshuai, LUO Yaxue
Journal of Geographical Sciences
, 2025, 35(
9
): 1900-1922. DOI:
10.1007/s11442-025-2396-2
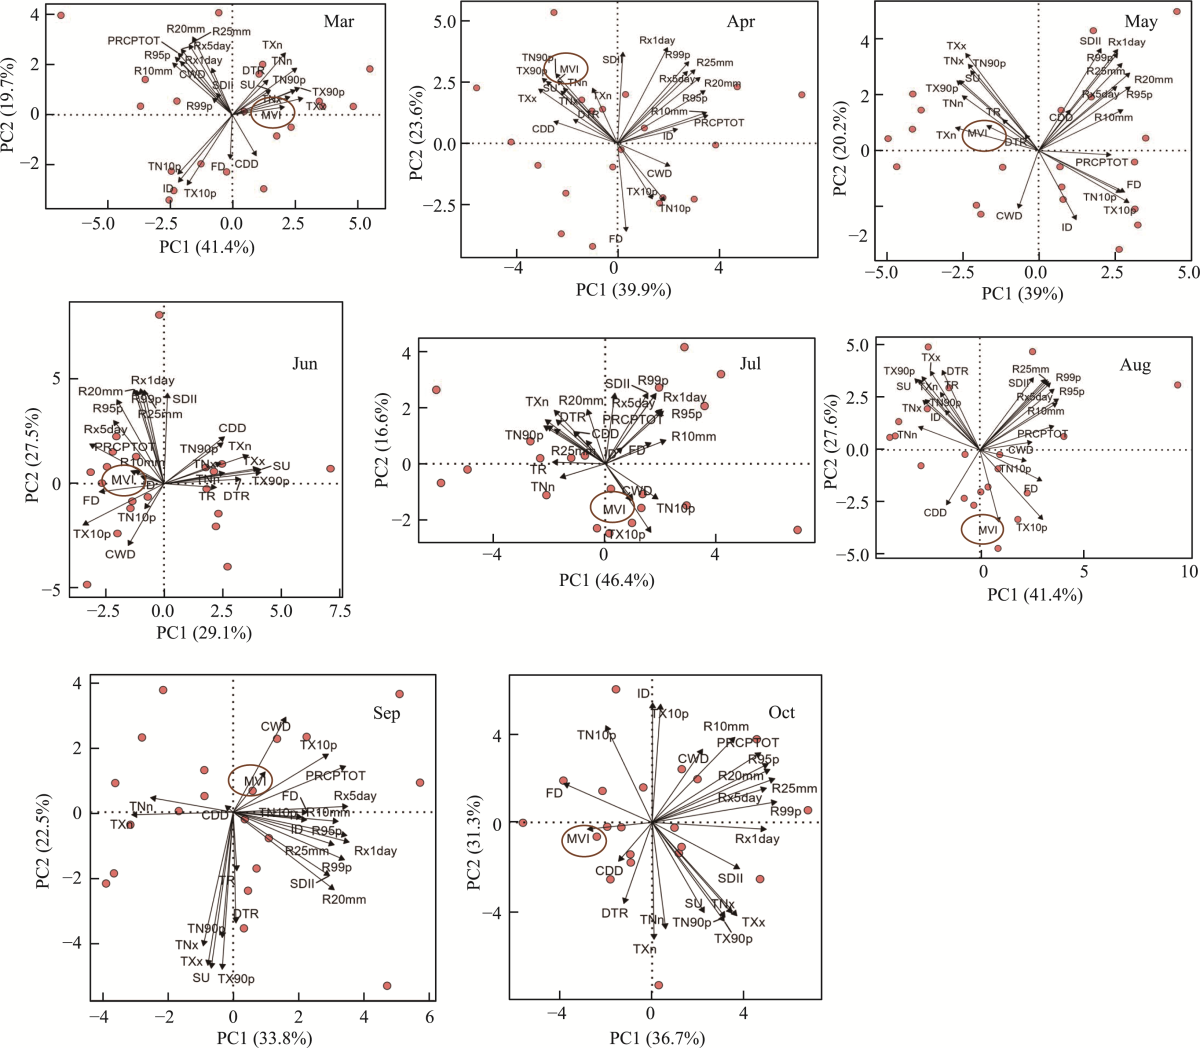
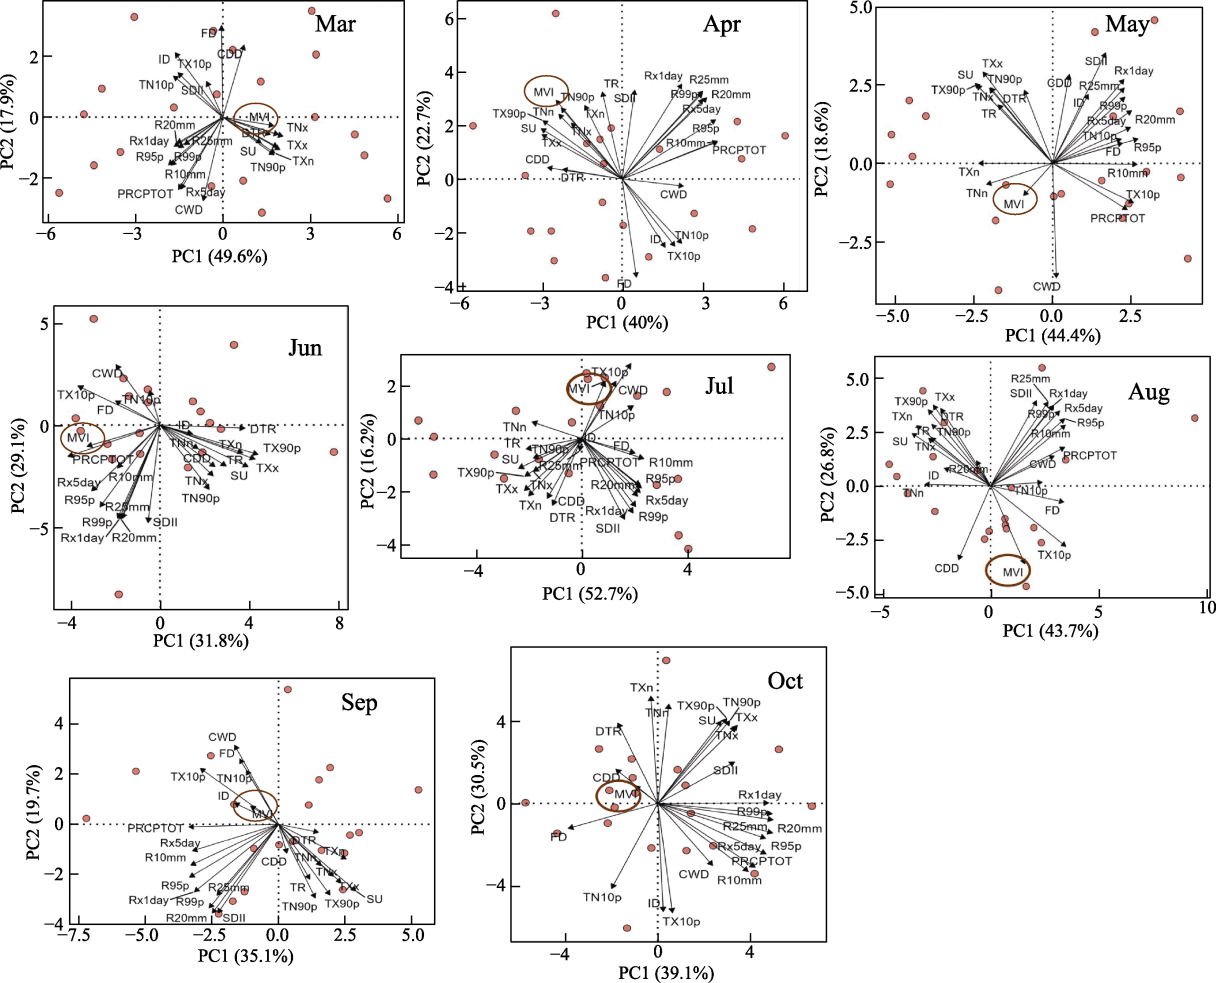
Figure 7
Principal Component Analysis loading diagram of monthly maximum NDPI (MVI) values of forest and extreme climate indices in each month during growing season (from March to October)
Other figure/table from this article
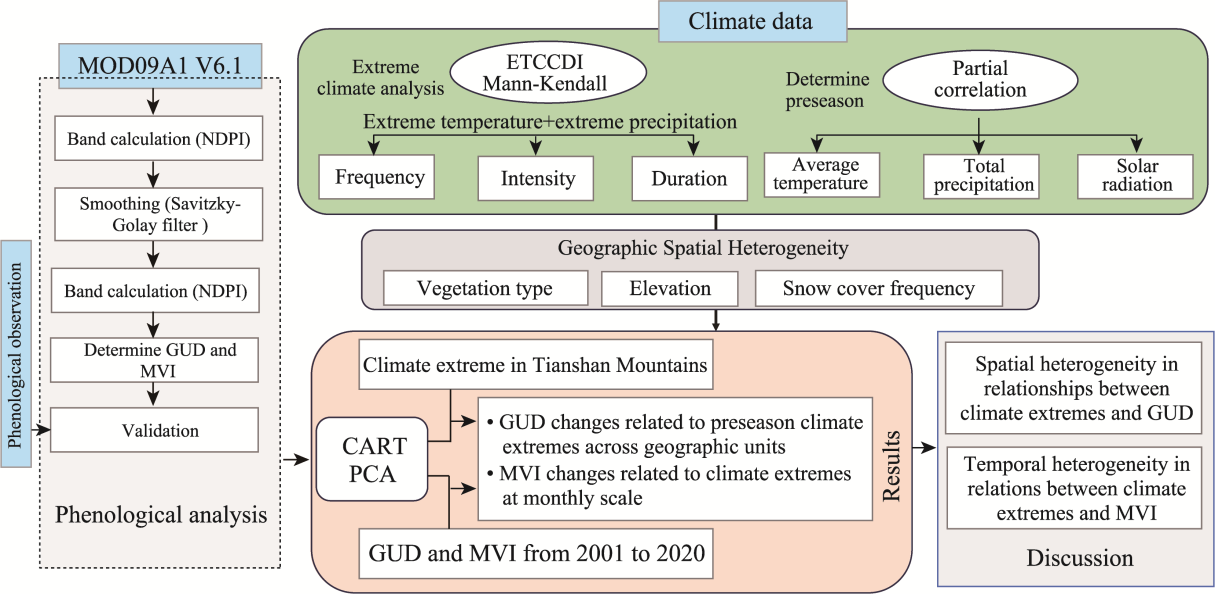
Figure 1
Flowchart showing the research methodology and structure of this article
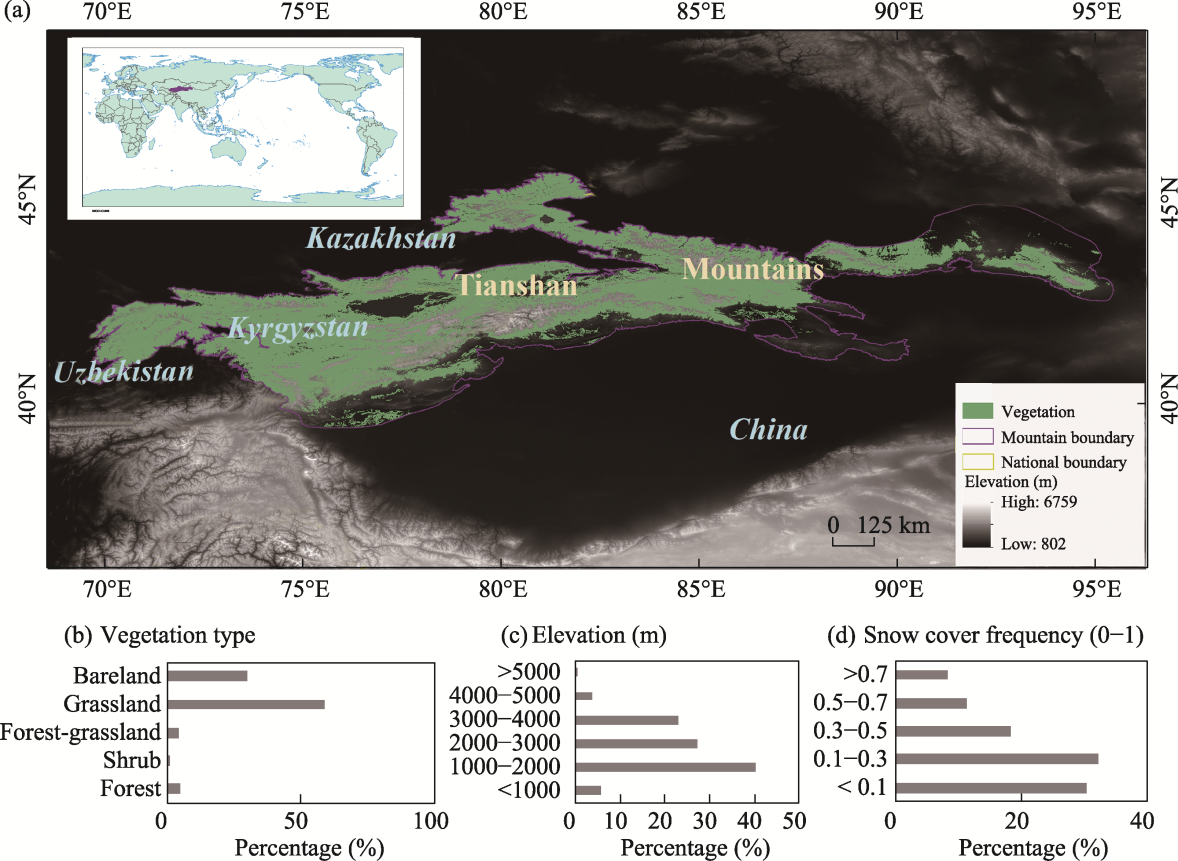
Figure 2
Location of the study area (a. Location of Tianshan Mountains; b. Vegetation type; c. Elevation; d. snow cover frequency)
Table 1
List of the ETCCDI core climate indices and their definitions (available online at
http://etccdi.pacificclimate.org/software.shtml
)
Table S1
Validation of extreme temperature indices from 1982 to 2020
Table S2
Validation of extreme precipitation indices from 1982 to 2020
Table 2
The mean values and change trends in climate extreme indices in the Tianshan Mountains during 1982-2020
Table S3
Details about the phenological stations and the validation results
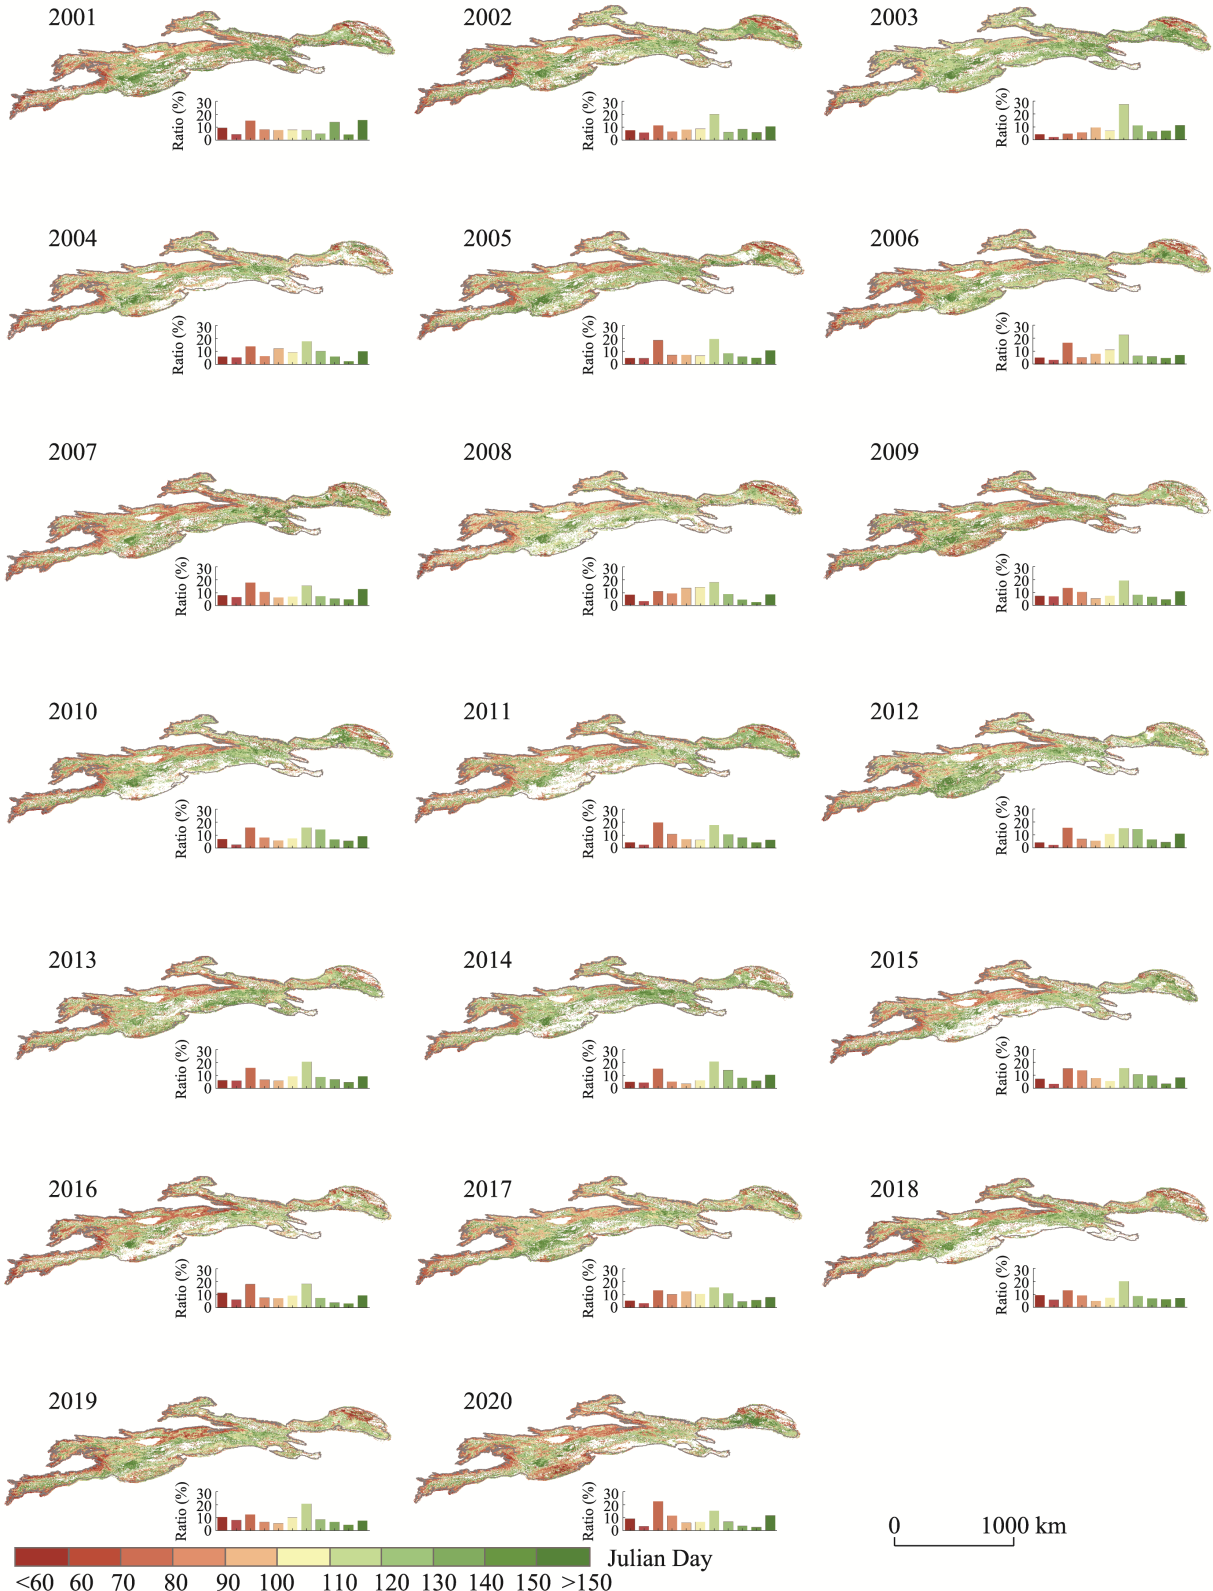
Figure 3
Spatial distributions of the vegetation green-up date in the Tianshan Mountains from 2001 to 2020 (The inset at the bottom left corner of each subfigure displays the frequency distributions of the corresponding green-up dates.)
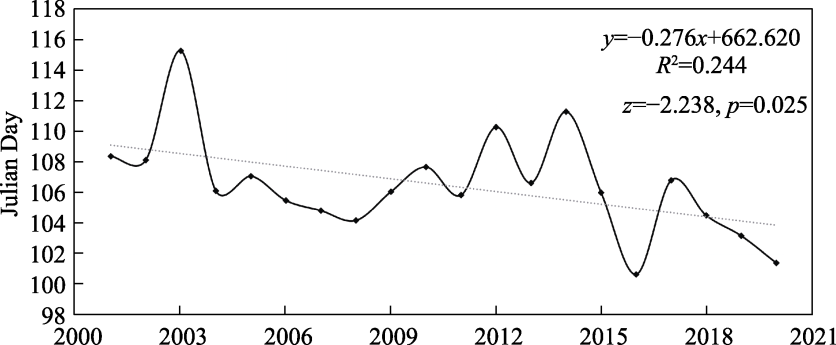
Figure 4
Interannual variations of vegetation green-up date in the Tianshan Mountains from 2001 to 2020
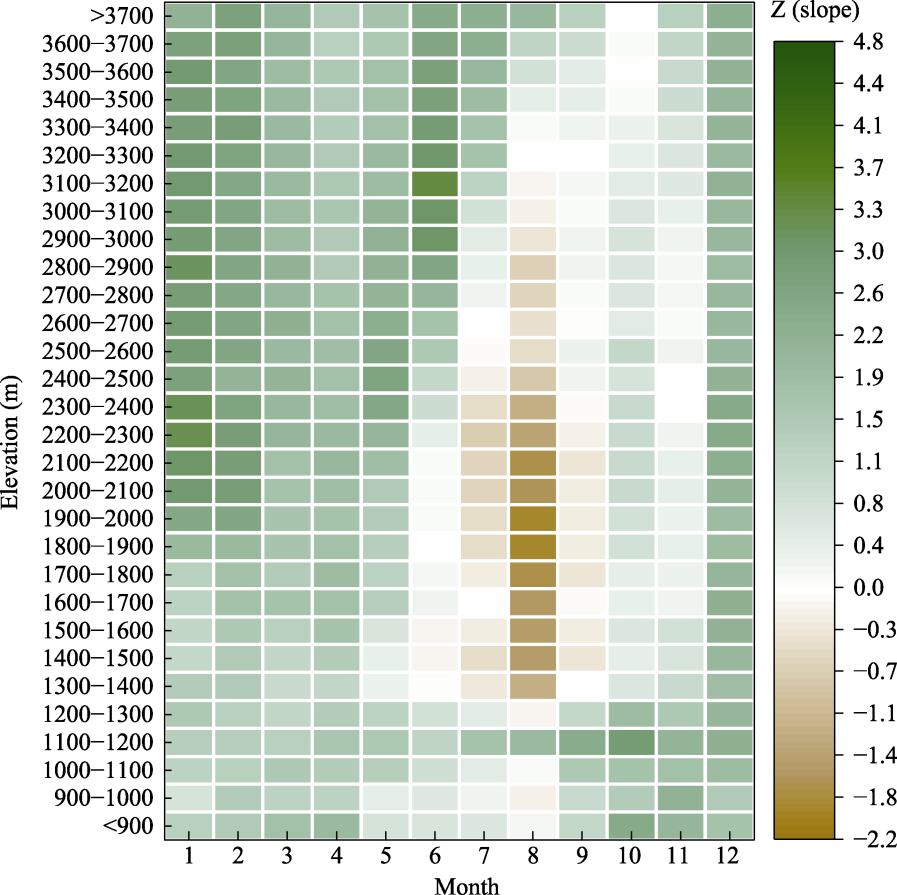
Figure 5
Change trends in monthly maximum vegetation index along elevation bands of Tianshan Mountains from 2001 to 2020 (Z value represents the change slope calculated by the Mann-Kendall trend test (greening: Z > 0; browning: Z < 0).)
Table S4
Spatial statistics of second-order partial relationship between vegetation green-up date and the daytime temperature, nighttime temperature, and total precipitation within 1-6 months before the green-up date
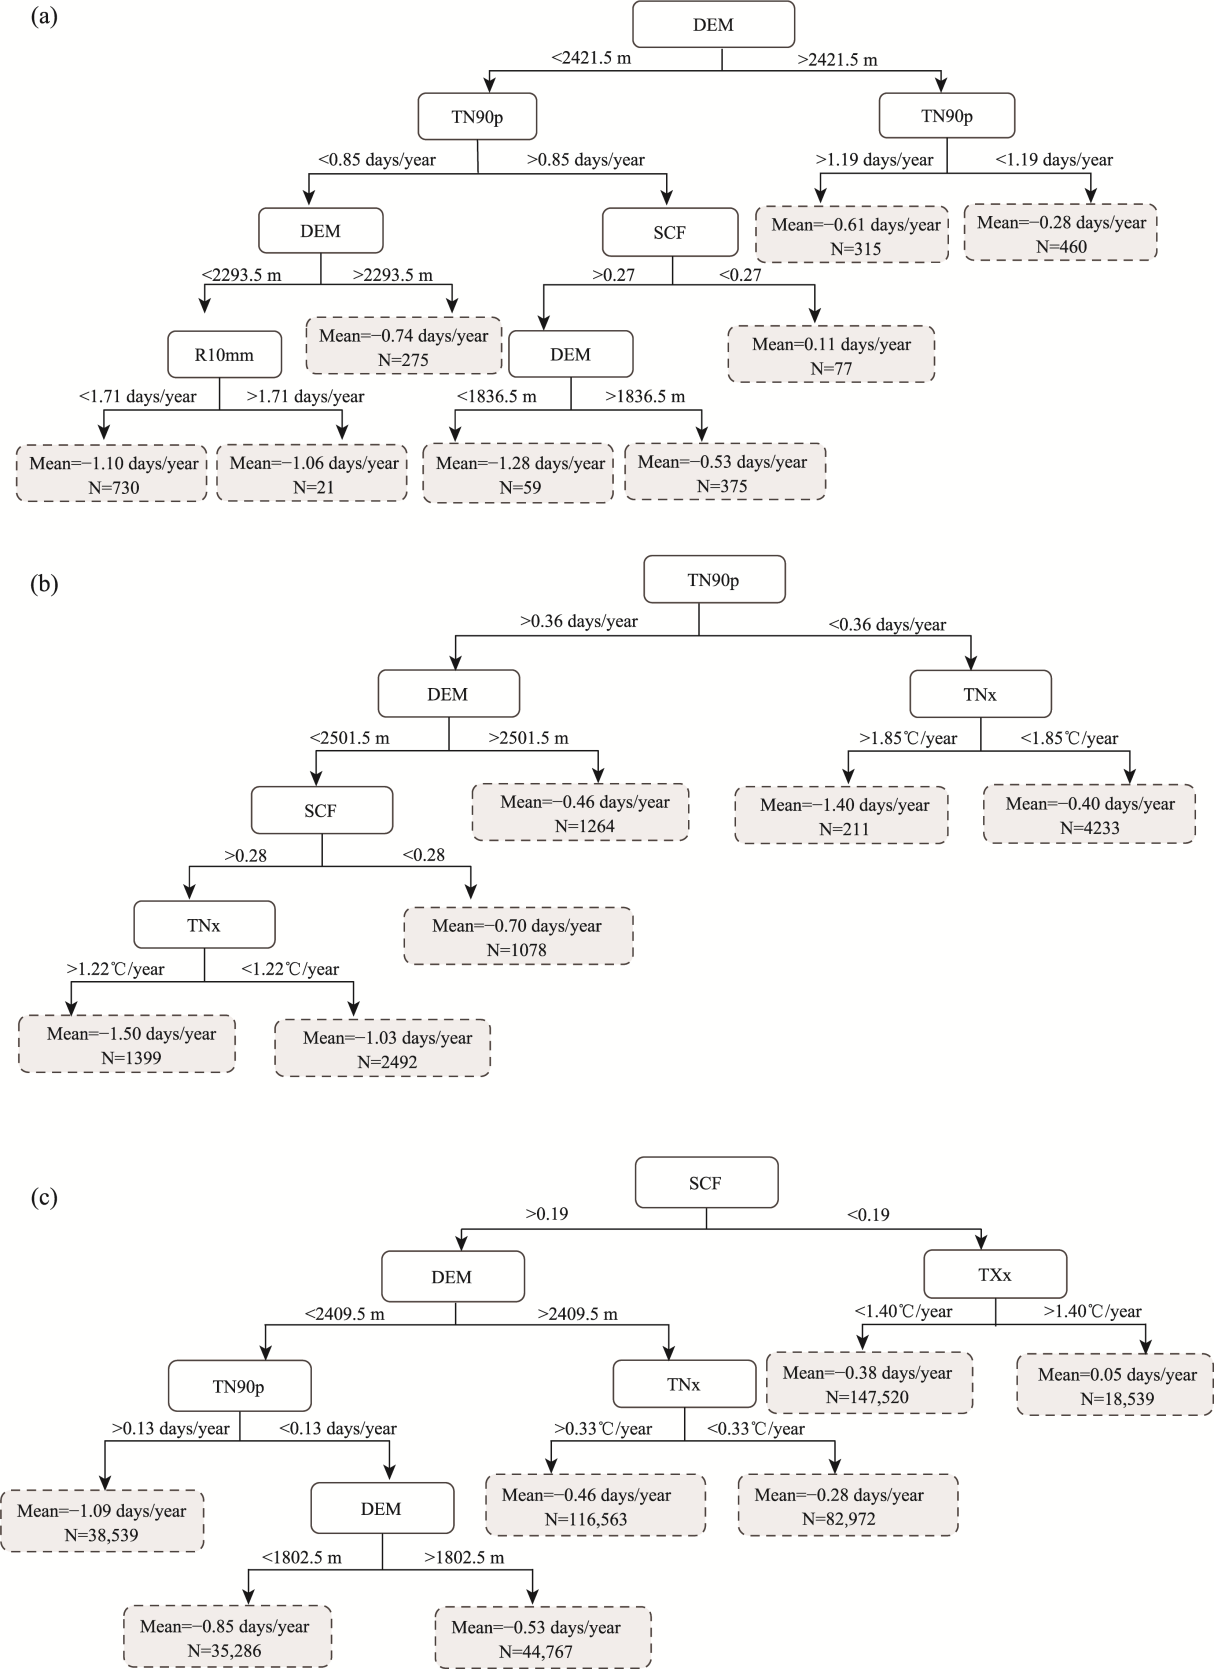
Figure 6
The CART model illustrating the impact of preseason climate extreme indices on the green-up date (GUD) in the Tianshan Mountains (a. forest; b. forest-grassland; c. grassland)
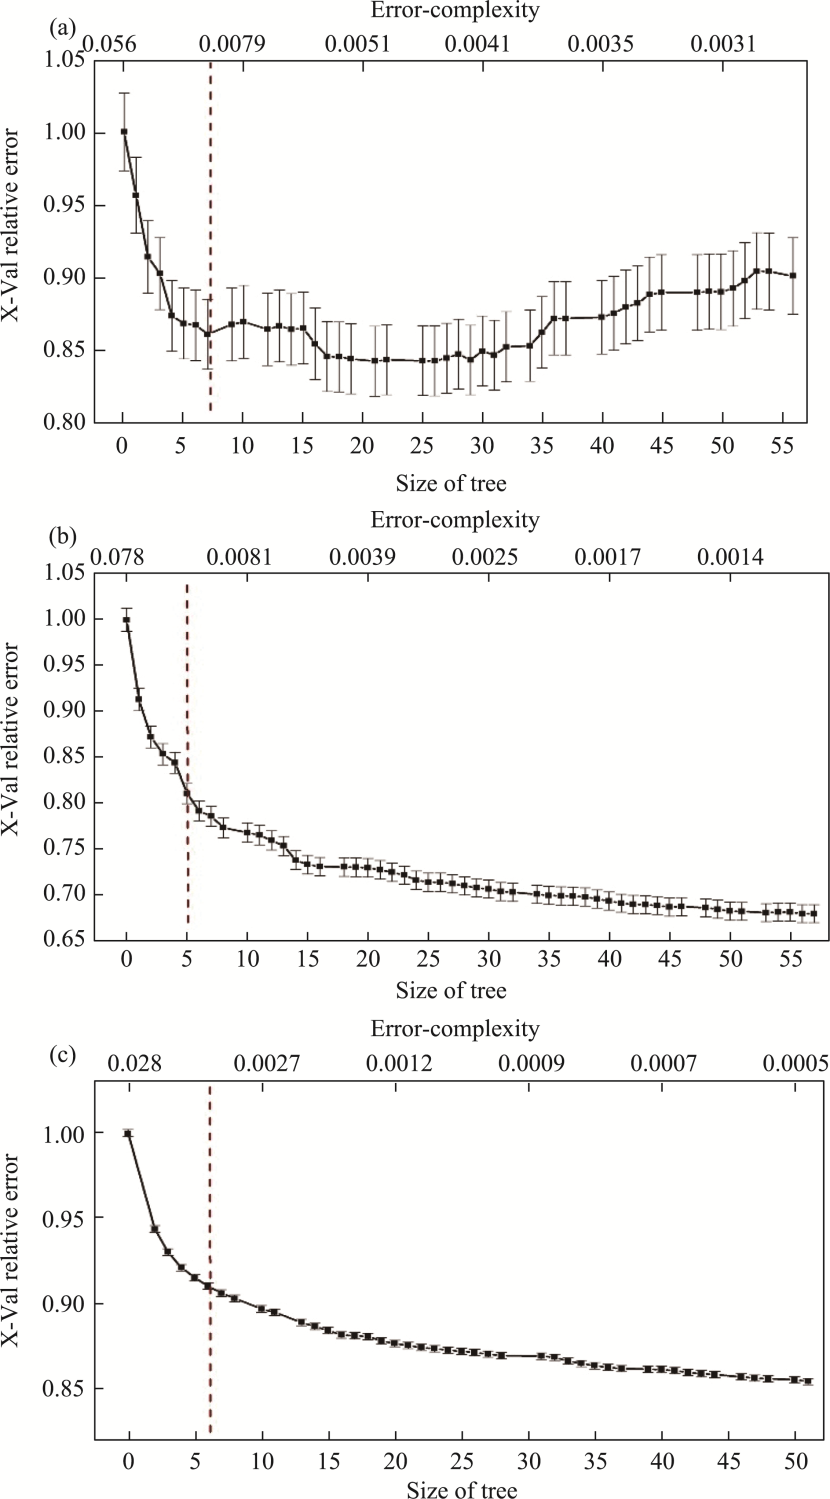
Figure S1
The cost complexity and X-Val relative error of the final CART tree (a. forest; b. forest-grassland; c. grassland)
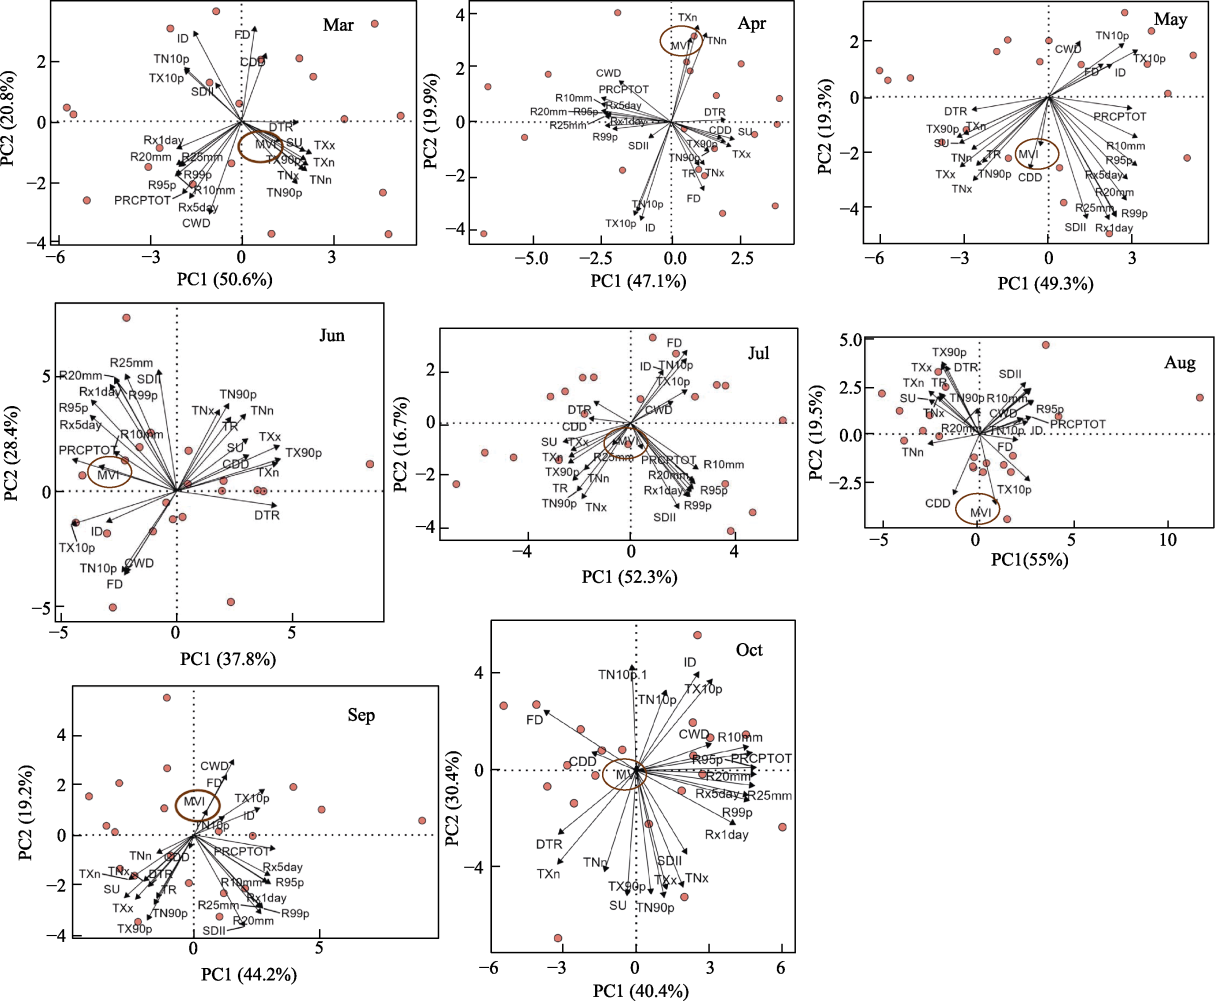
Figure 8
Principal Component Analysis loading diagram of monthly maximum NDPI (MVI) values of forest-grassland and extreme climate indices in each month during growing season (from March to October)
Figure 9
Principal Component Analysis loading diagram of monthly maximum NDPI (MVI) values of grassland and extreme climate indices in each month during growing season (from March to October)