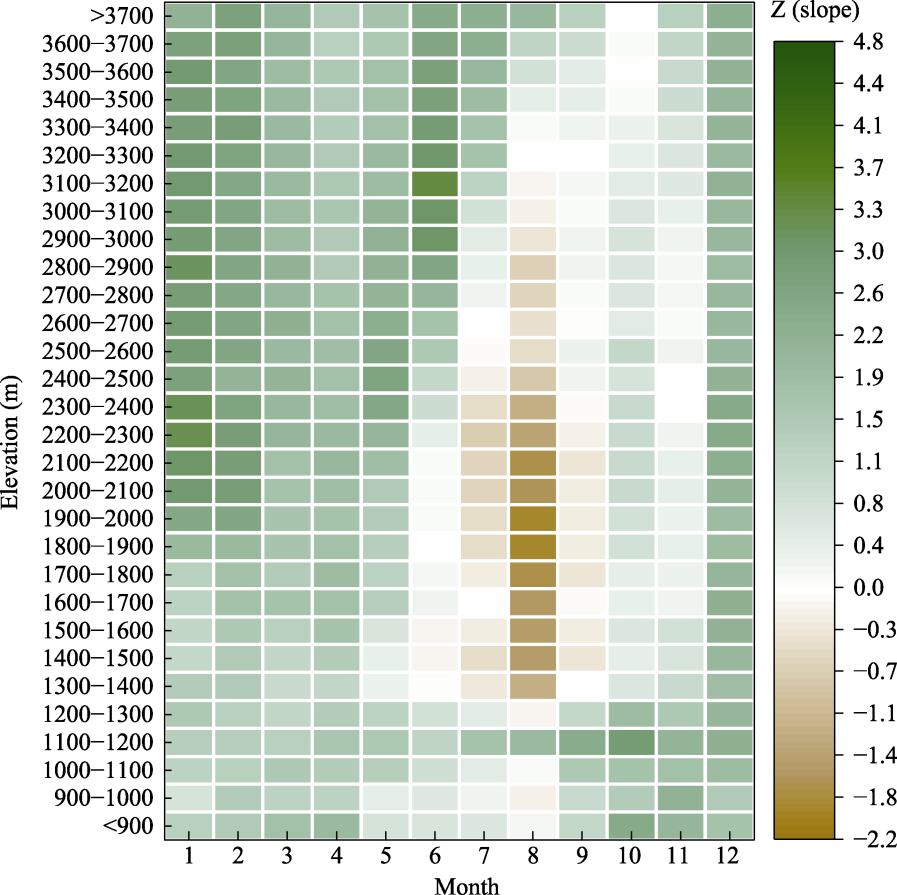
Figure 5 Change trends in monthly maximum vegetation index along elevation bands of Tianshan Mountains from 2001 to 2020 (Z value represents the change slope calculated by the Mann-Kendall trend test (greening: Z > 0; browning: Z < 0).)
Other figure/table from this article