| Predict types | Business as usual | Economic development | Ecological protection | ||||||
|---|---|---|---|---|---|---|---|---|---|
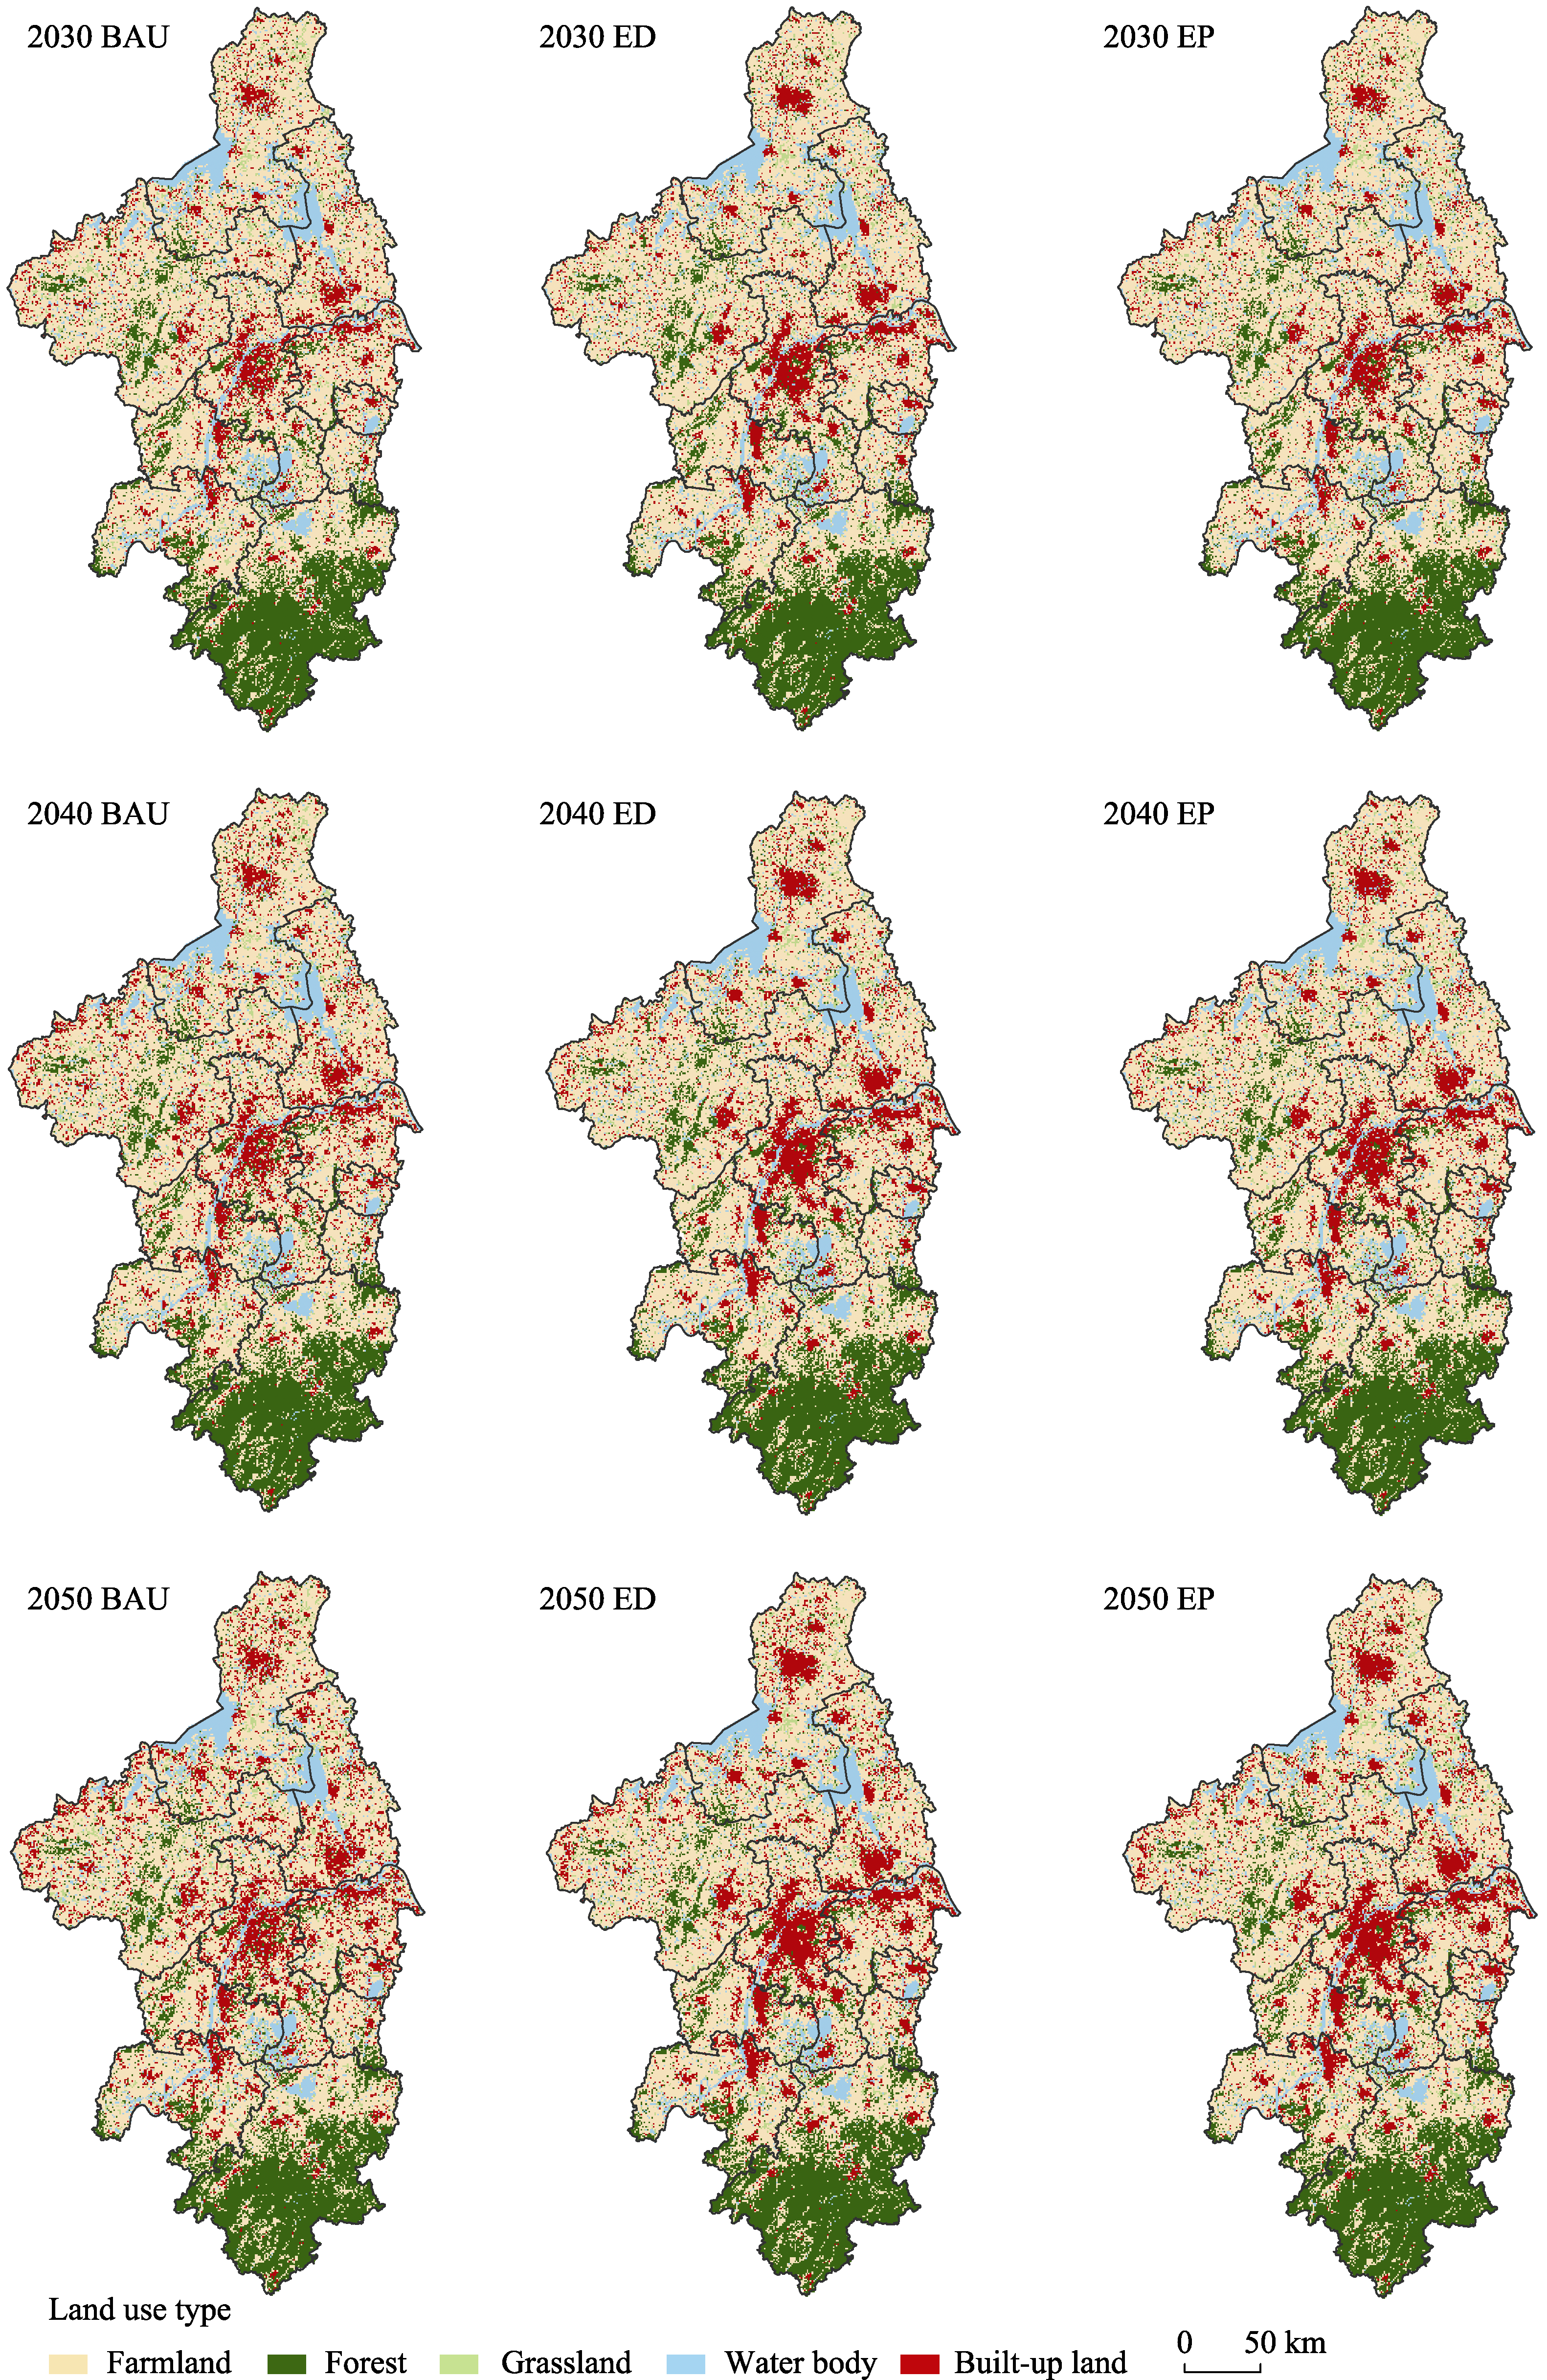
| Land-use type (km2) | 2030 | 2040 | 2050 | 2030 | 2040 | 2050 | 2030 | 2040 | 2050 |
| Farmland | 37,524 | 36,491 | 35,512 | 37,364 | 36,335 | 35,361 | 37,614 | 36,579 | 35,598 |
| Forest | 12,669 | 12,447 | 12,220 | 12,648 | 12,427 | 12,200 | 12,703 | 12,482 | 12,254 |
| Grassland | 2413 | 2451 | 2460 | 2393 | 2431 | 2439 | 2450 | 2489 | 2498 |
| Water body | 6366 | 6200 | 6060 | 6336 | 6171 | 6032 | 6420 | 6253 | 6111 |
| Built-up land | 6470 | 7853 | 9190 | 6700 | 8078 | 9410 | 6253 | 7640 | 8981 |