×
模态框(Modal)标题
在这里添加一些文本
Close
Close
Submit
Cancel
Confirm
×
模态框(Modal)标题
×
Journal
Article
Figure
Search
EN
中文
Home
About Journal
About Journal
Indexed in
Awards
Editorial Board
Guide for Authors
Browse
Current Issue
Online First
Archive
Highlights
Topic
Archive by Subject
Most Viewed
Most Download
Most Cited
E-mail Alert
RSS
Subscribe
Advertisement
Contact us
EN
中文
Figure/Table detail
Multi-scenario land use prediction and layout optimization in Nanjing Metropolitan Area based on the PLUS model
CAO Ji, CAO Weidong, CAO Yuhong, WANG Xuewei, ZHANG Yizhen, MA Jinji
Journal of Geographical Sciences
, 2024, 34(
7
): 1415-1436. DOI:
10.1007/s11442-024-2254-7
Land-use types (km
2
)
2010
Farmland
Forest
Grassland
Water body
Built-up land
2000
Farmland
38,428
1971
601
1063
723
Forest
973
10,844
549
171
135
Grassland
97
220
677
429
110
Water body
284
51
330
4813
243
Built-up land
1
1
19
333
2364
Table 4-1
Land use transfer in Nanjing Metropolitan Area from 2000 to 2010
Other figure/table from this article
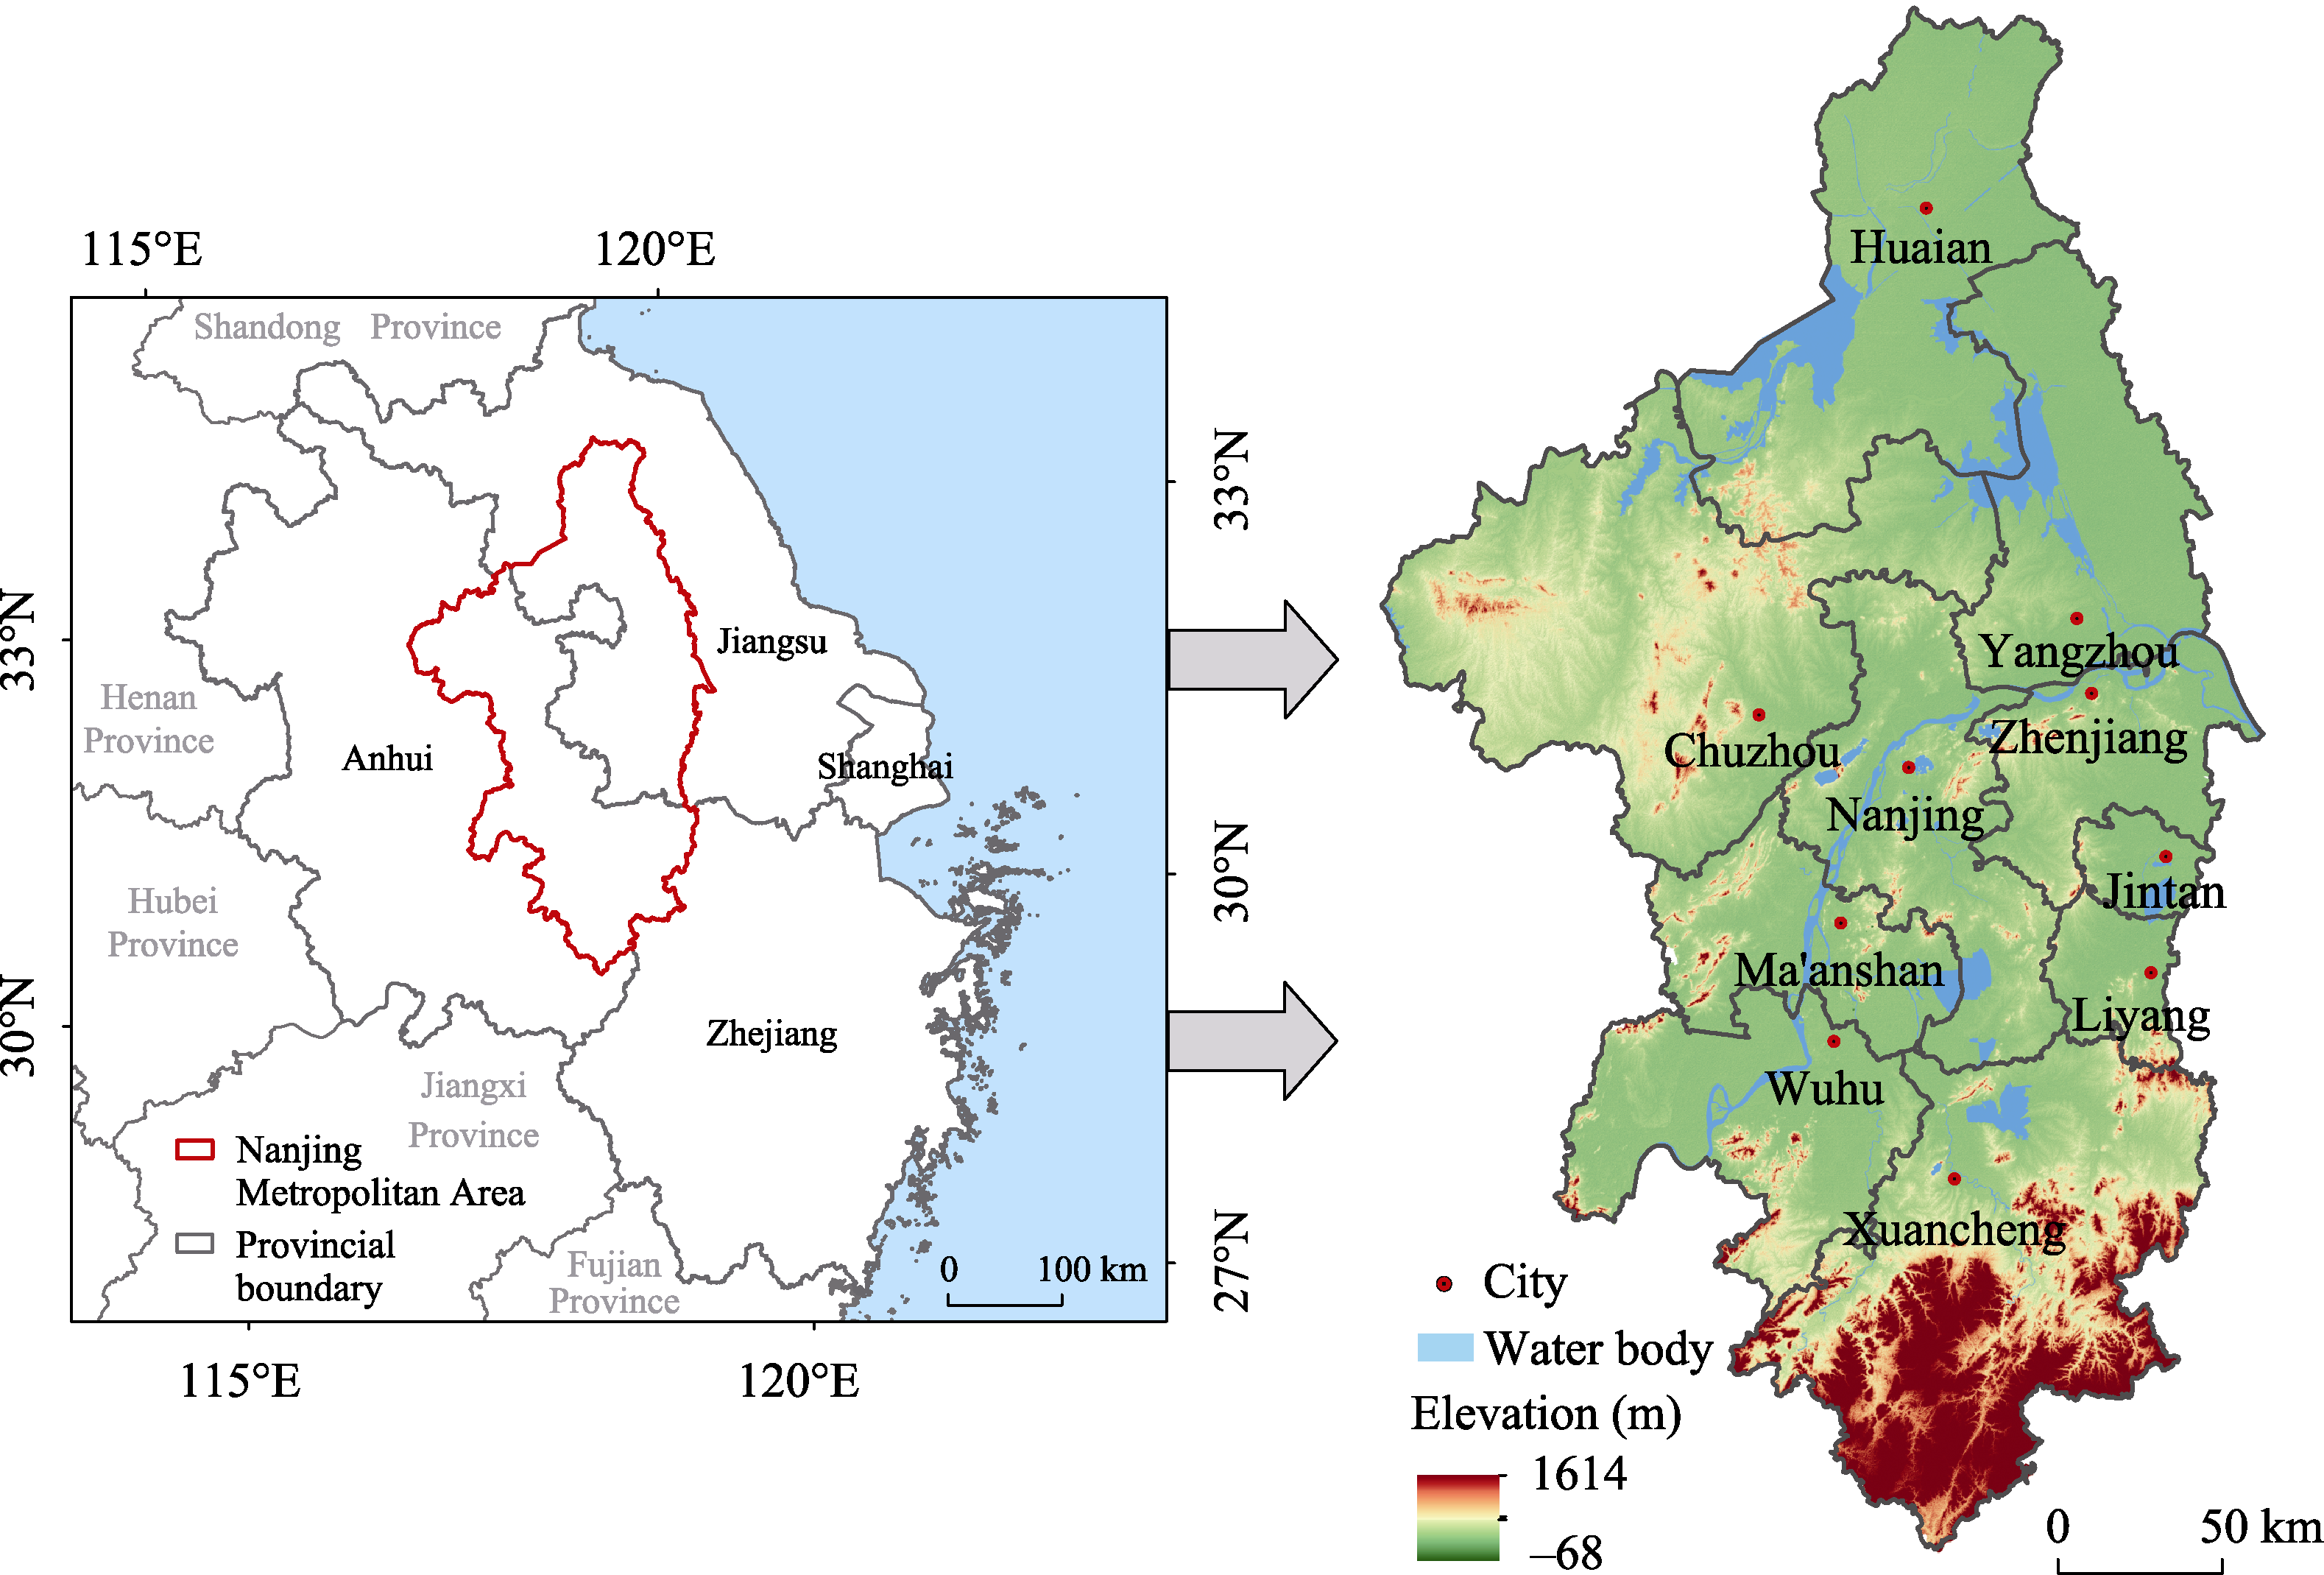
Figure 1
Administrative divisions and terrain of the study area (Nanjing Metropolitan Area)
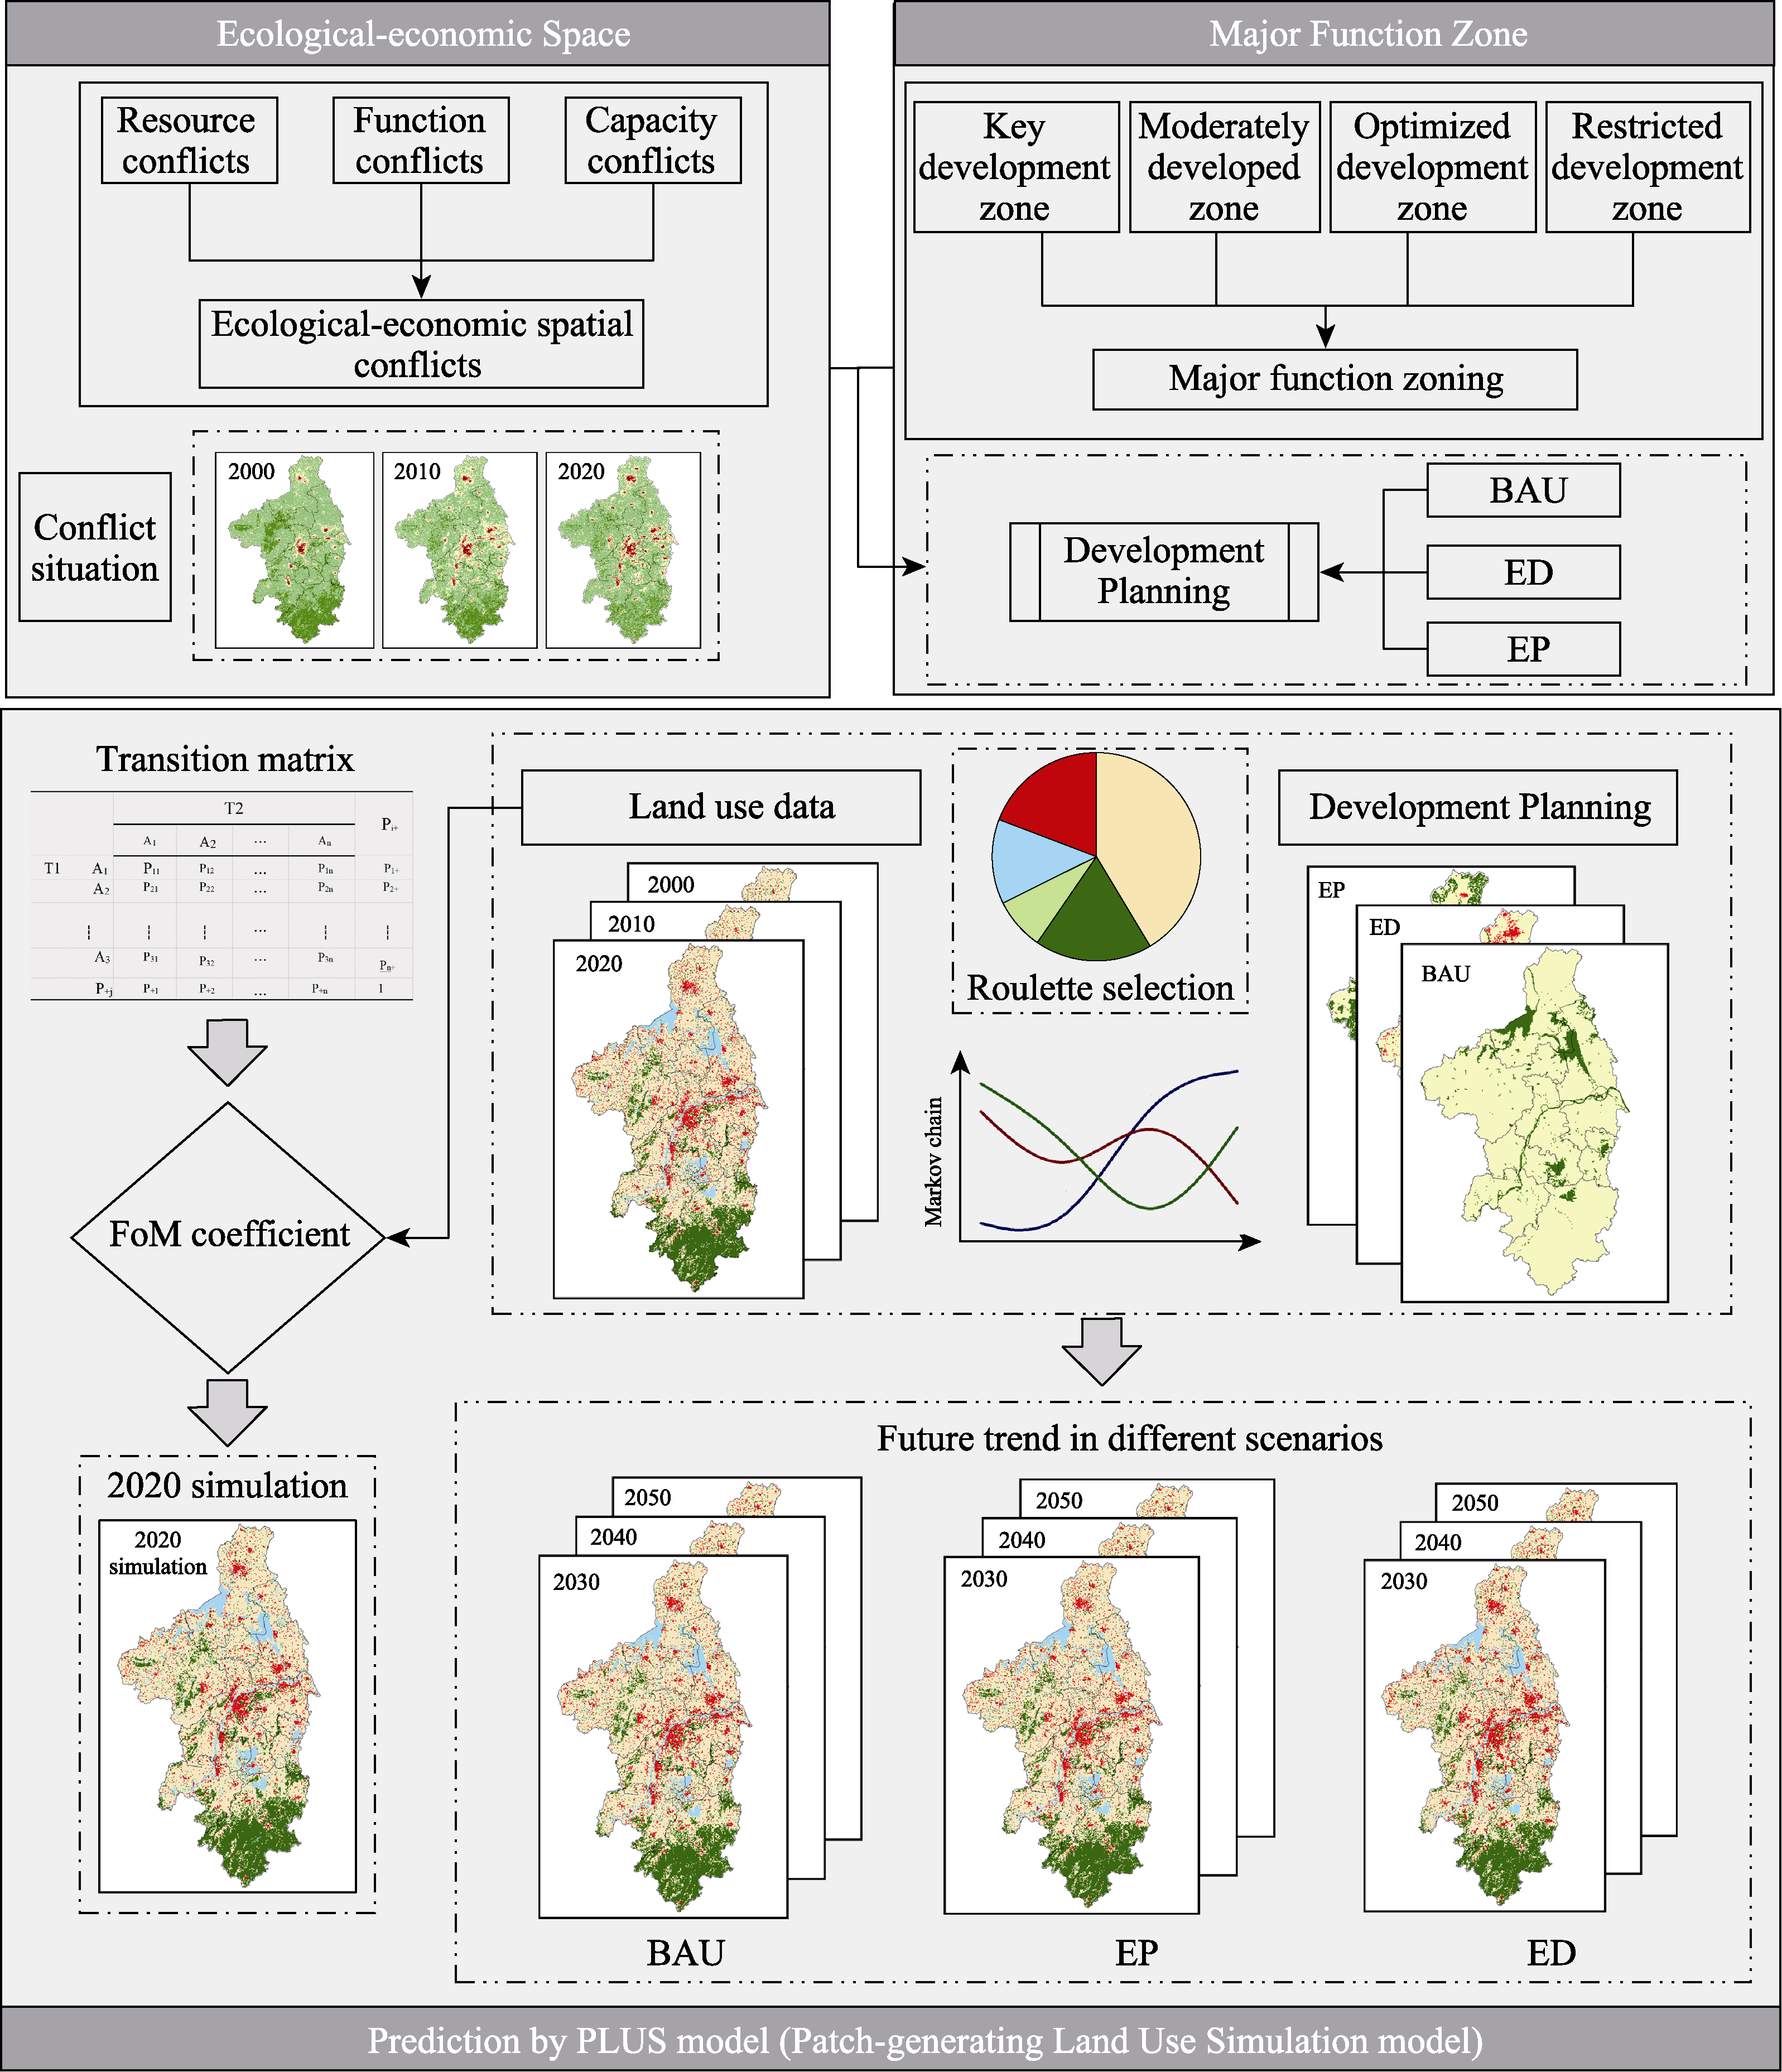
Figure 2
Research framework diagram
Table 1
Data sources
Table 2
EESC Indicators system
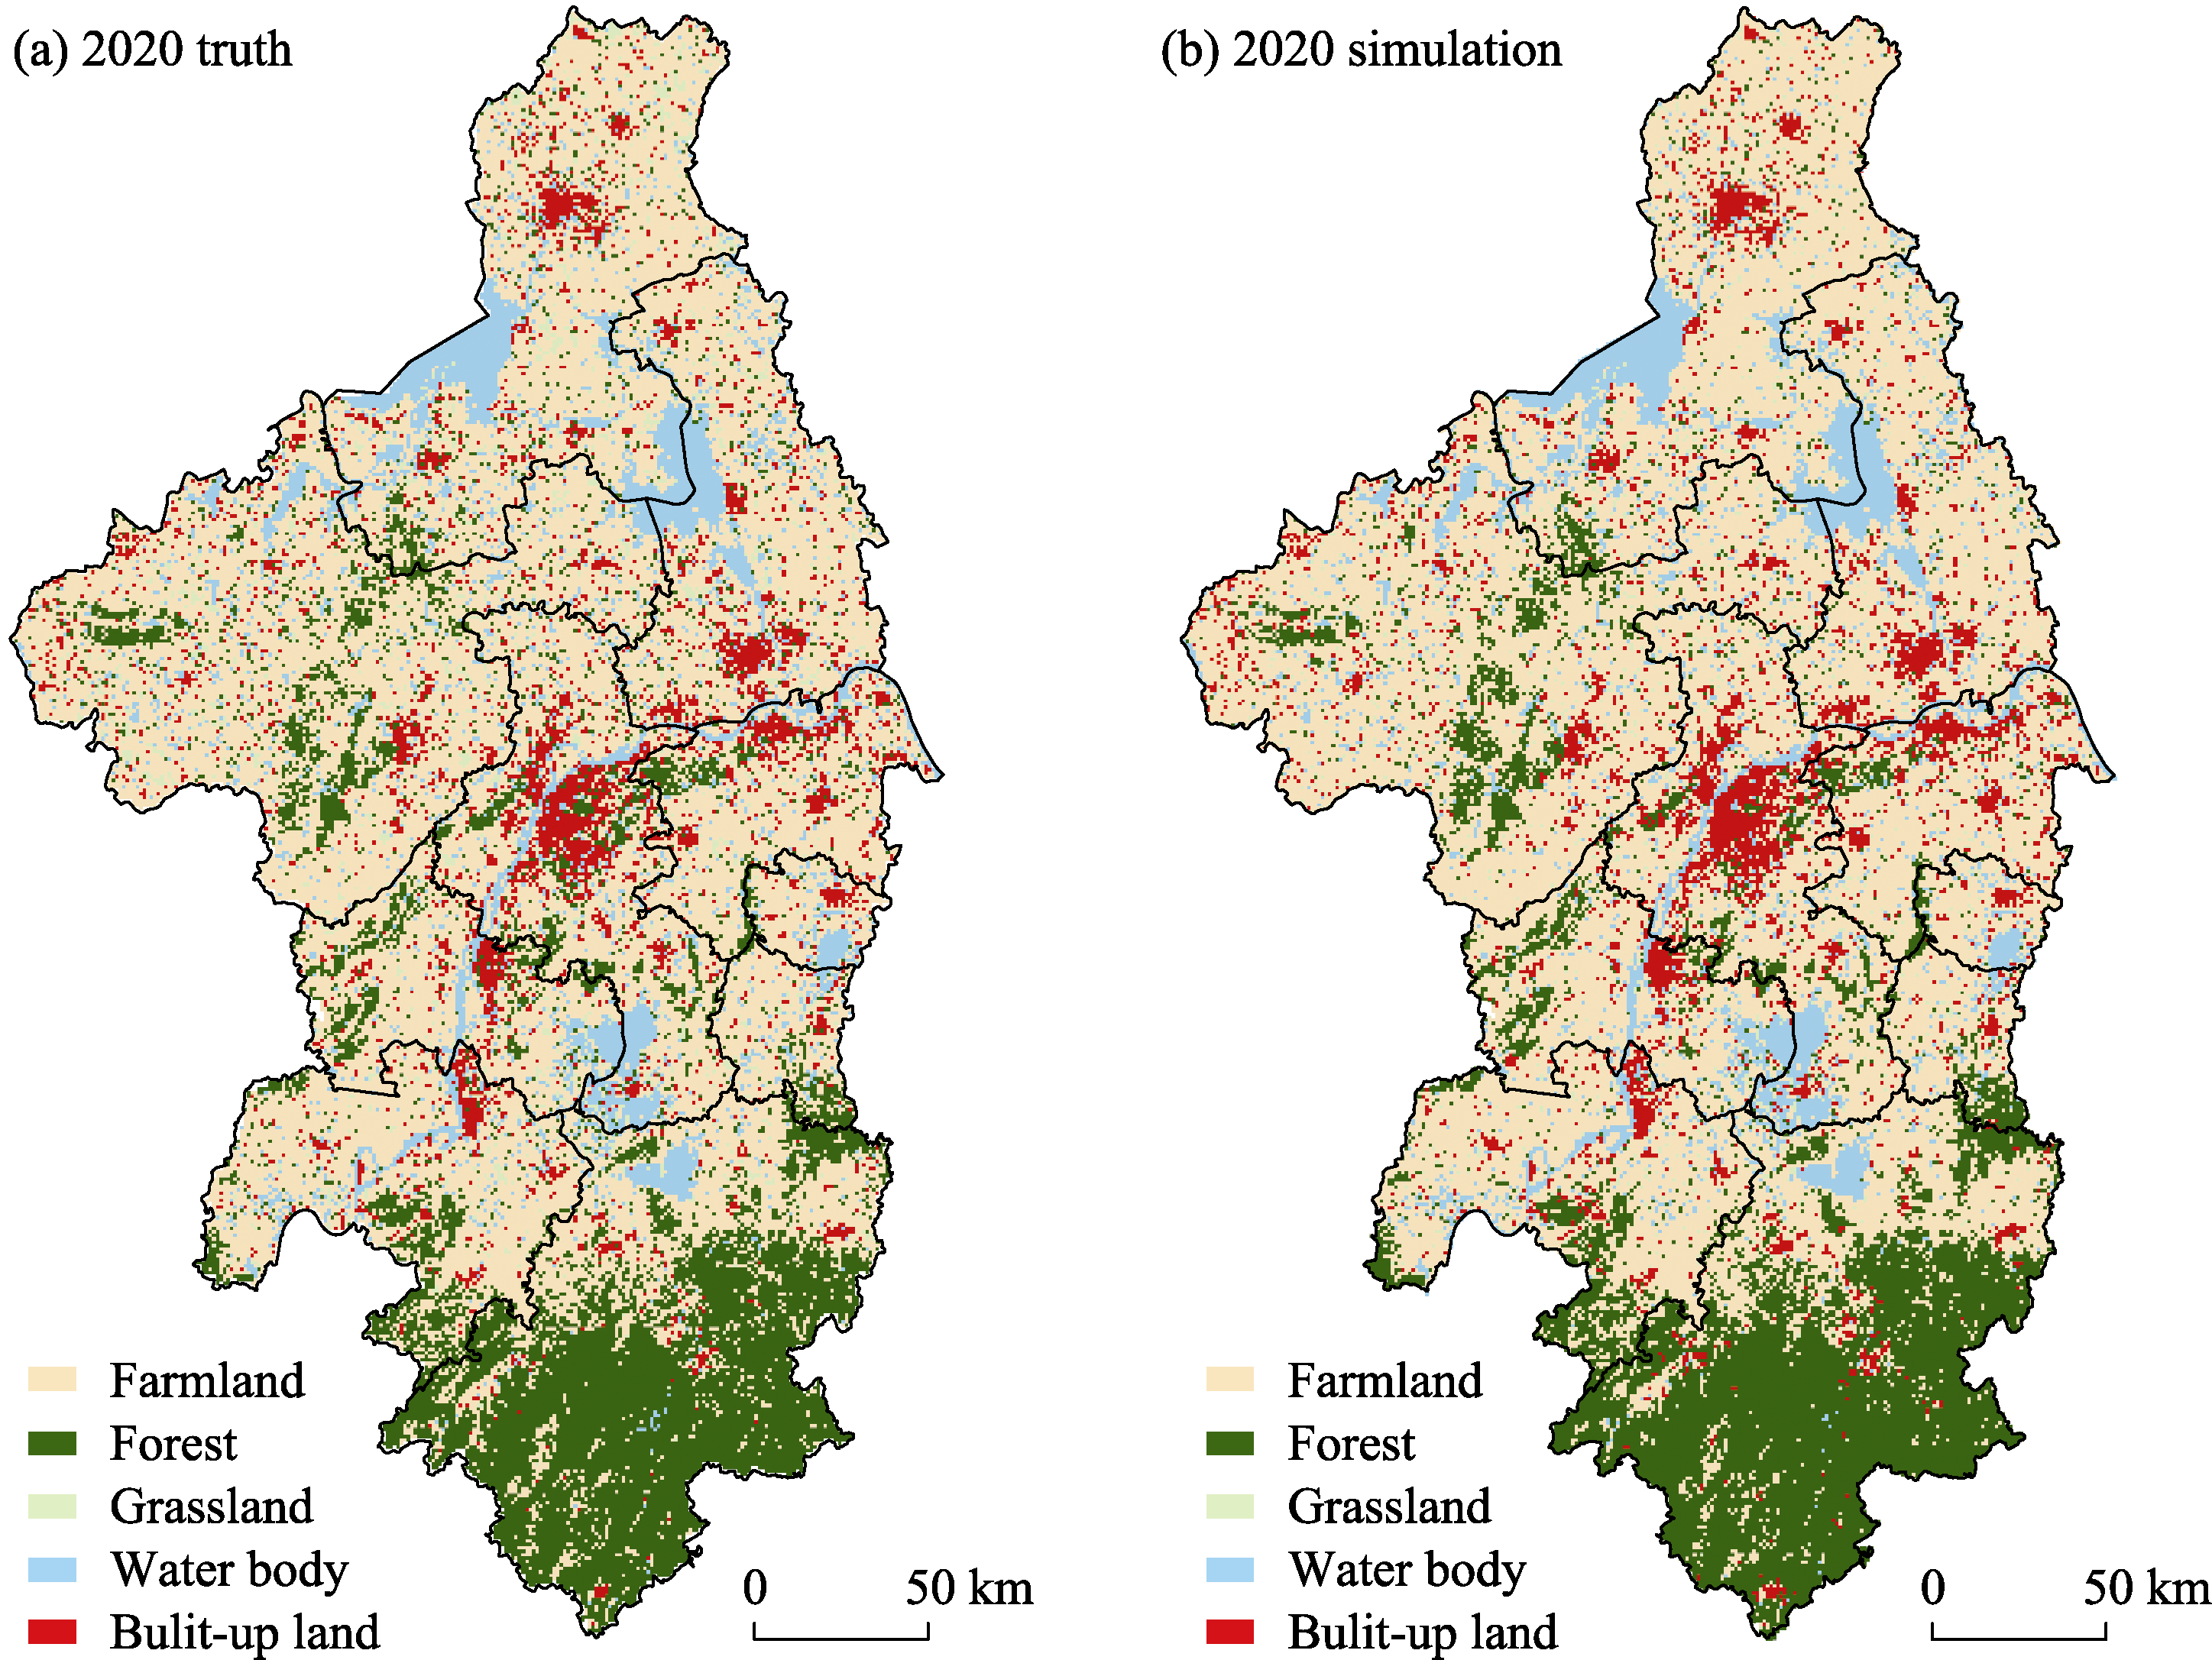
Figure 3
Forecast and reality comparison in Nanjing Metropolitan Area in 2020
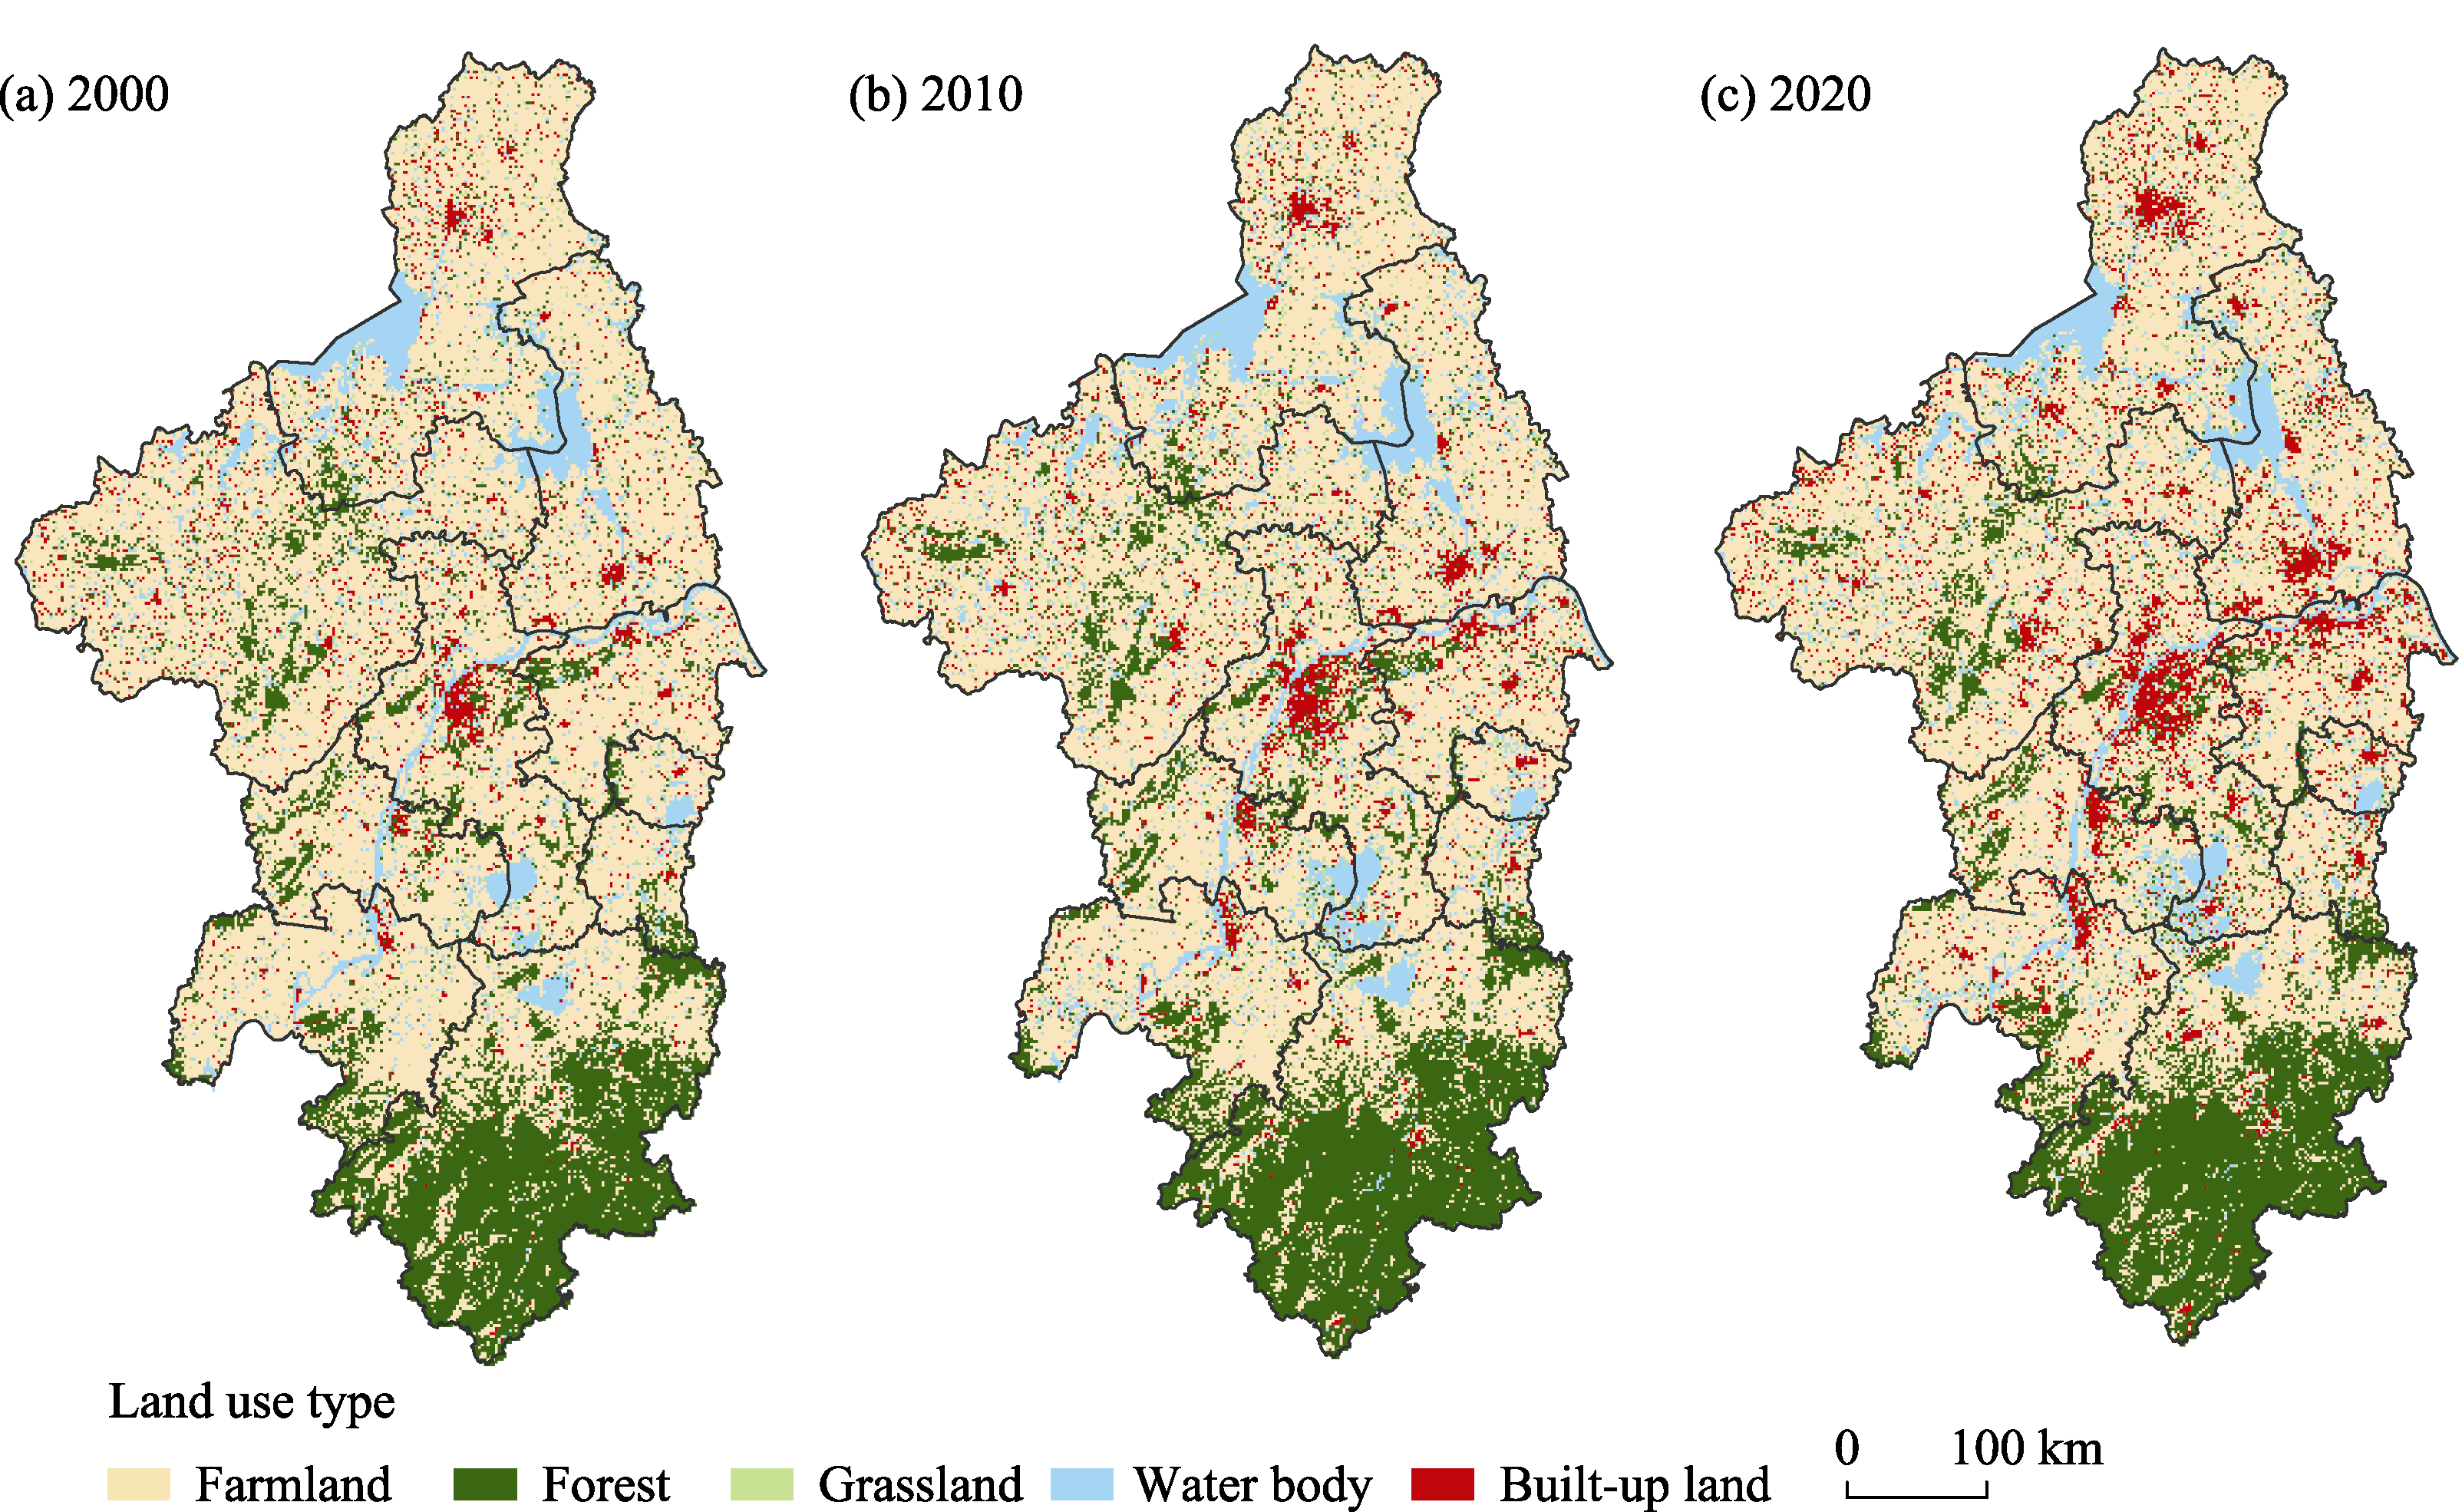
Figure 4
Land use in Nanjing Metropolitan Area (a. 2000; b. 2010; c. 2020)
Table 3
Area and proportion of each land use type in Nanjing Metropolitan Area
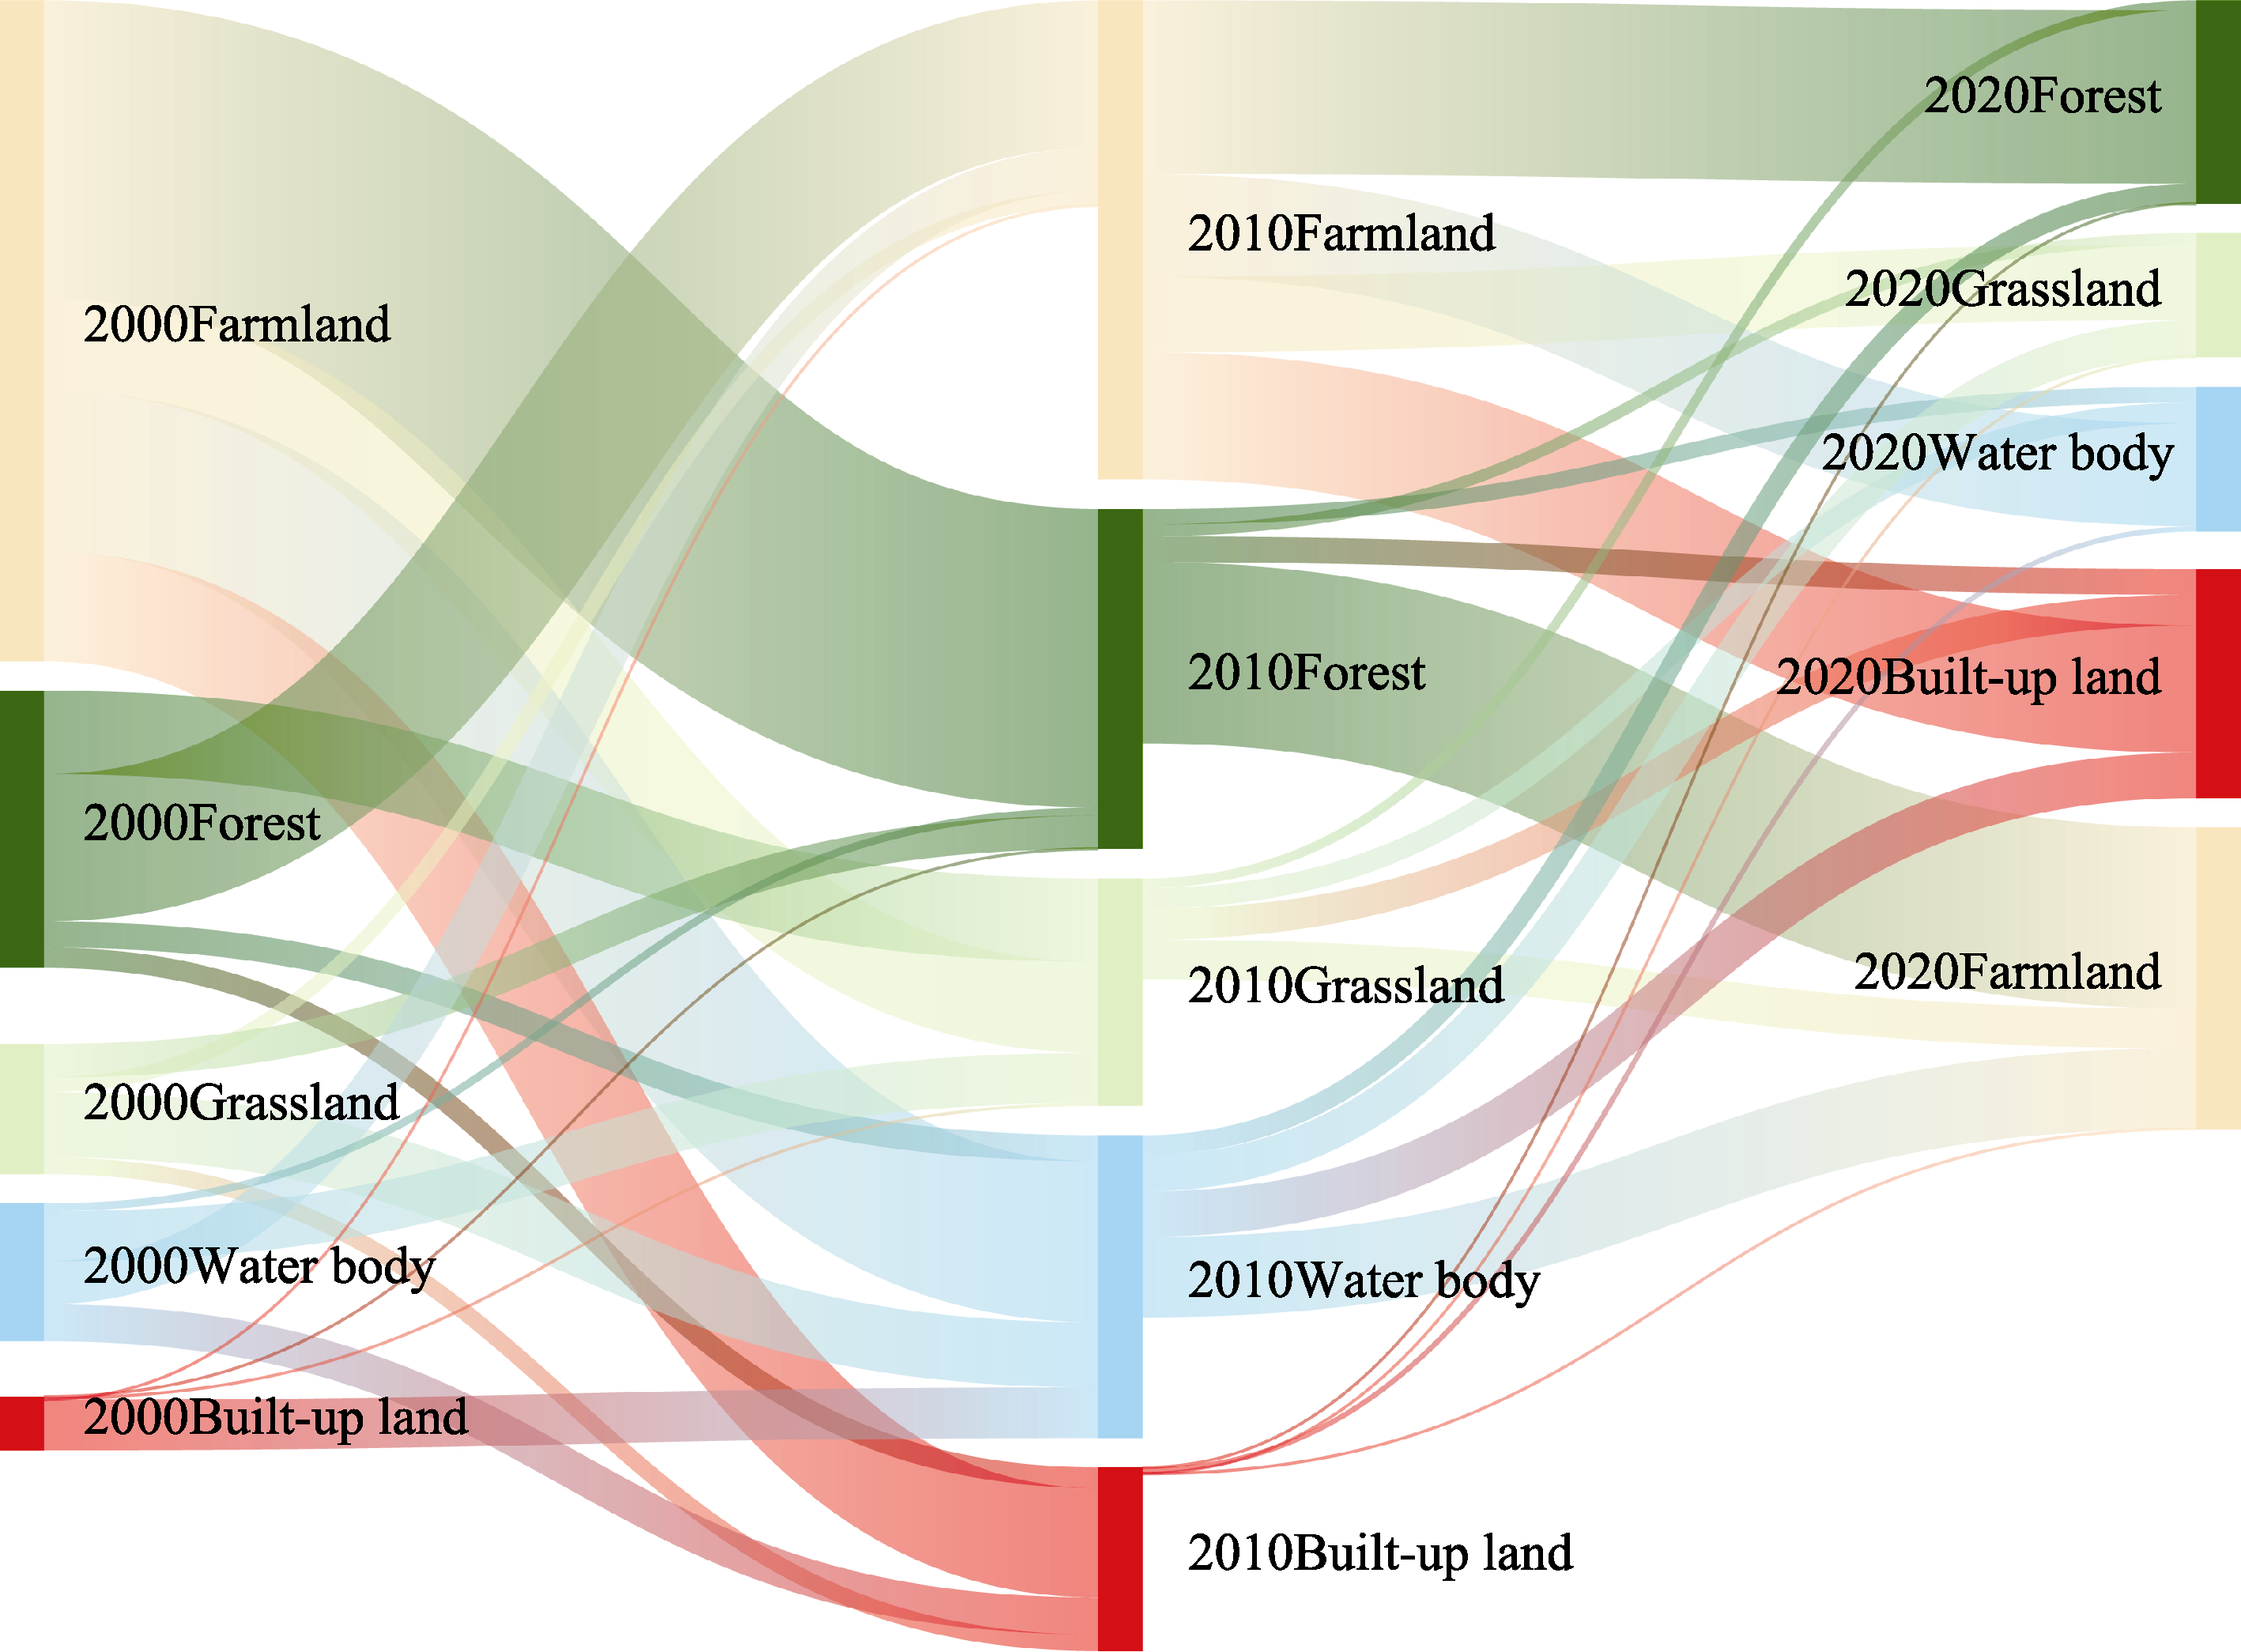
Figure 5
Transfer of land use change in Nanjing Metropolitan Area from 2000 to 2020
Table 4-2
Land use transfer in Nanjing Metropolitan Area from 2010 to 2020
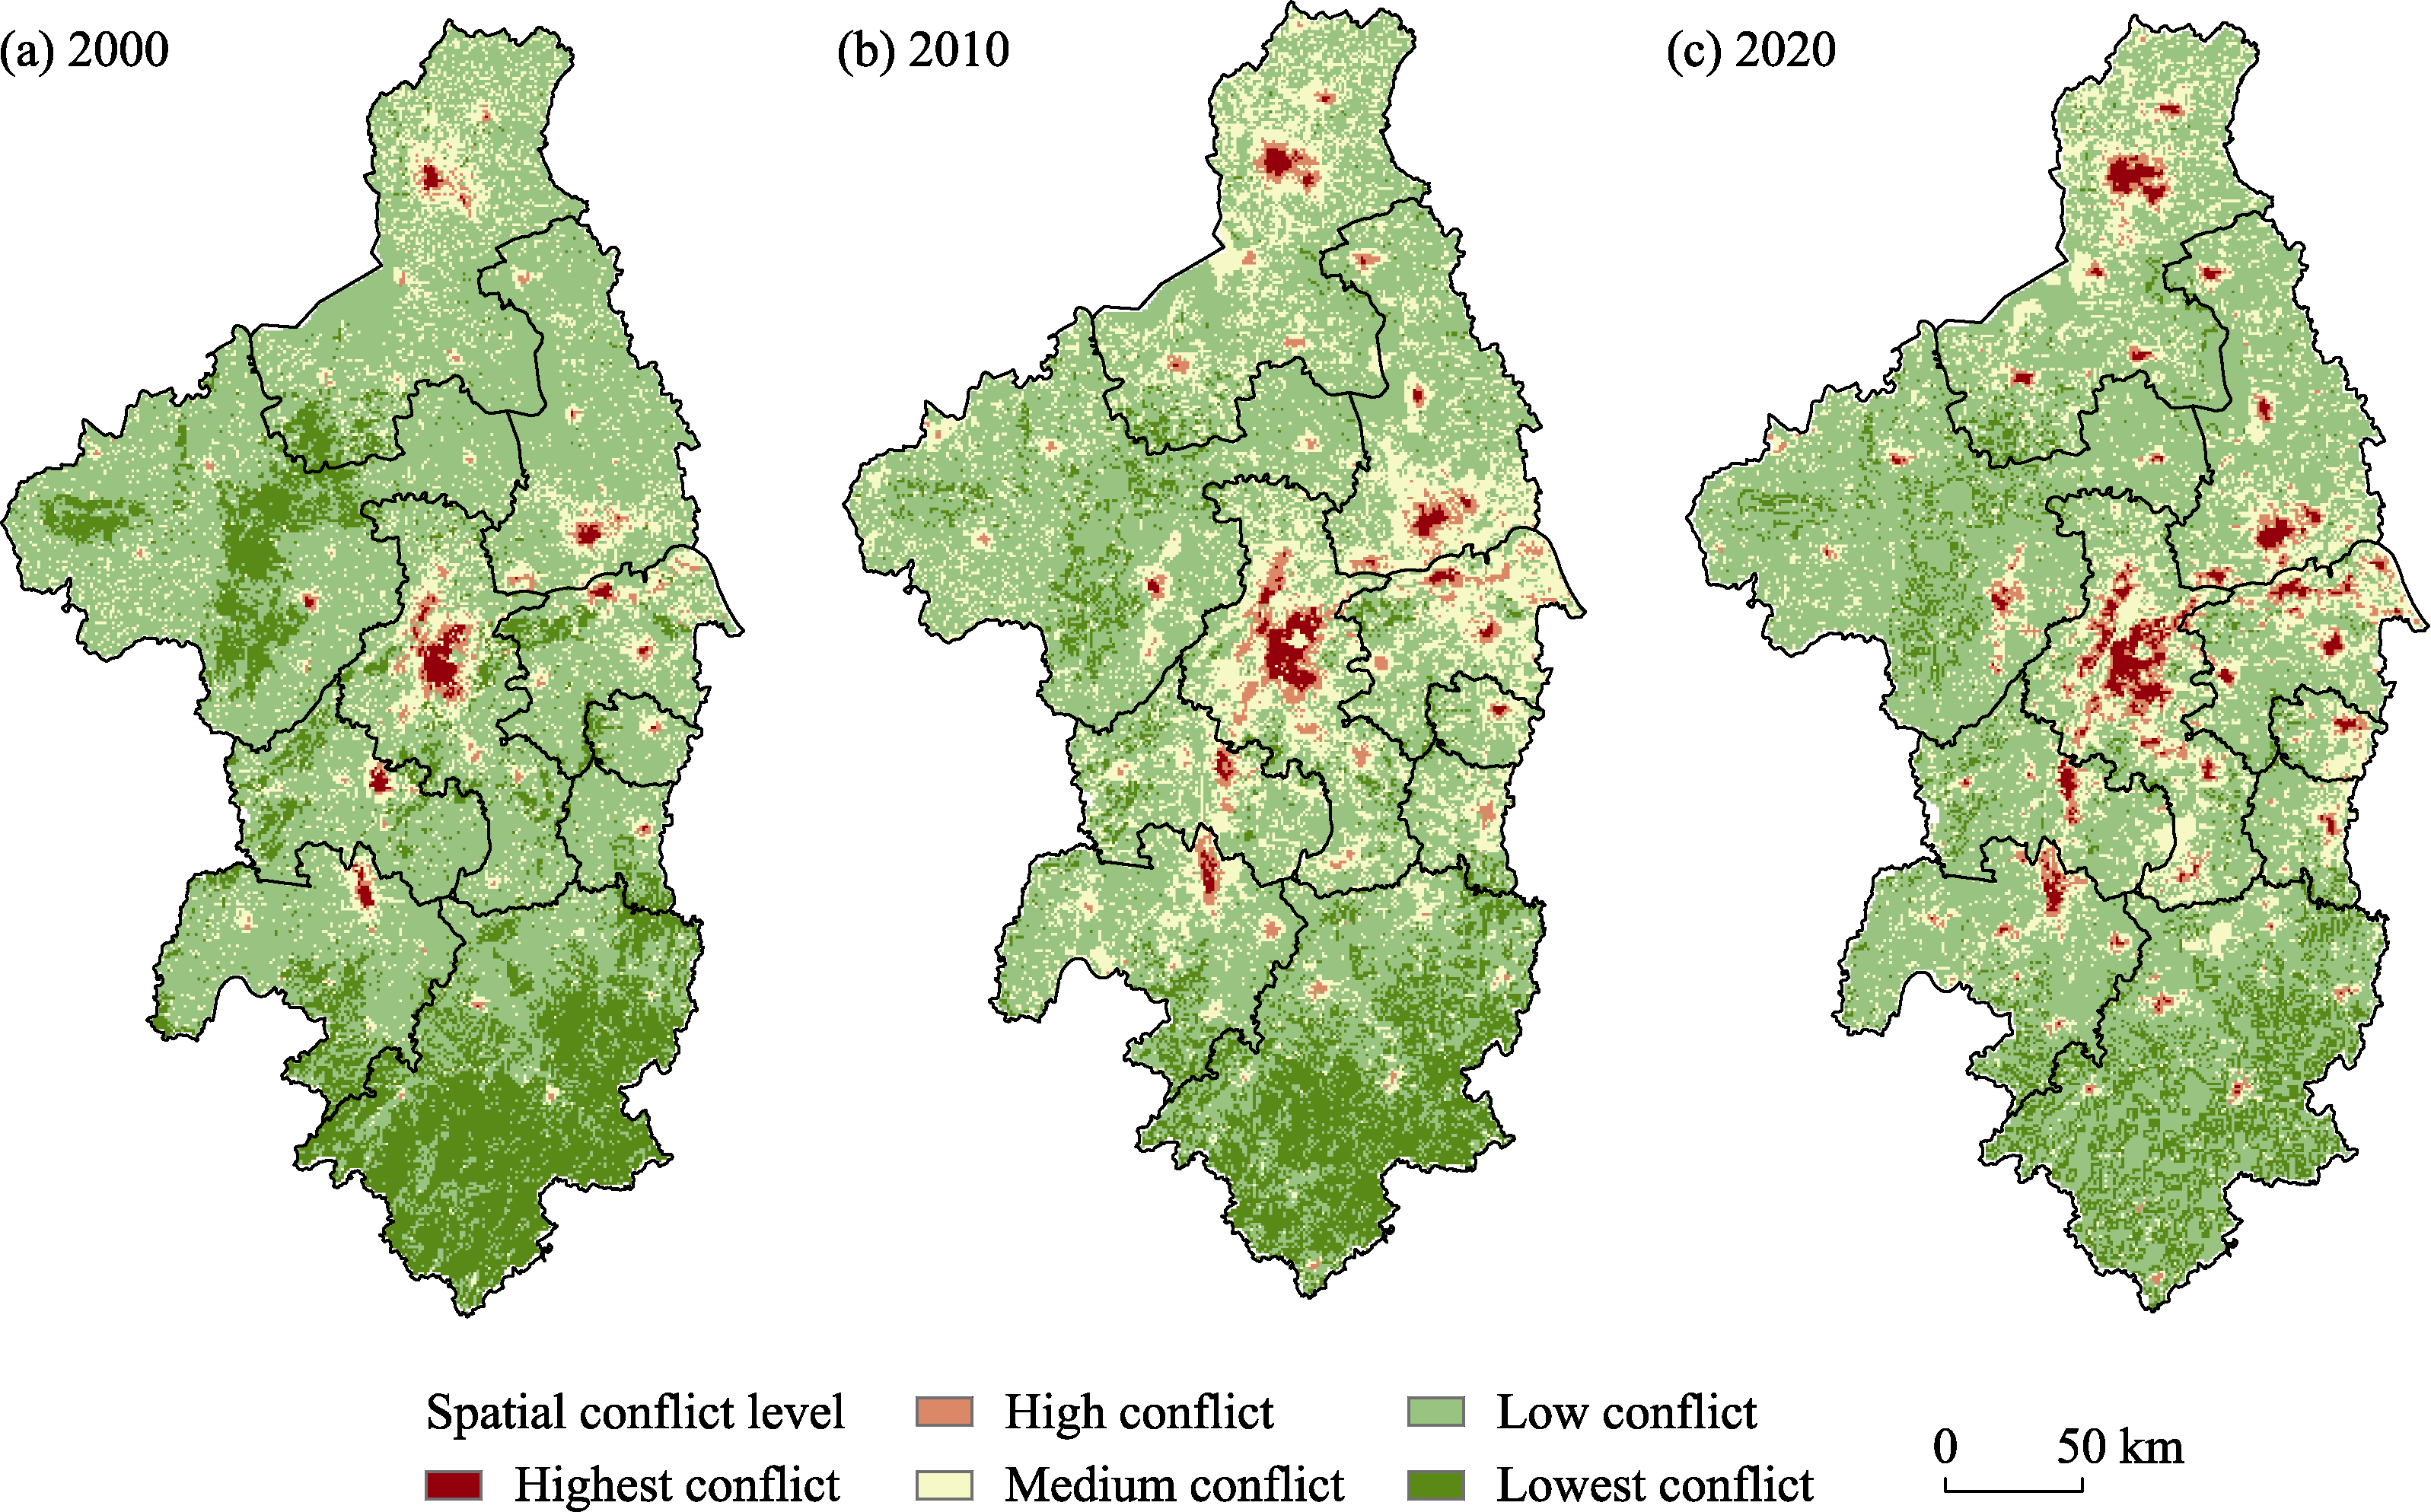
Figure 6
Distribution of ecological-economic spatial conflict in Nanjing Metropolitan Area (a. 2000; b. 2010; c. 2020)
Table 5
Area composition of different conflict types in Nanjing Metropolitan Area (%)
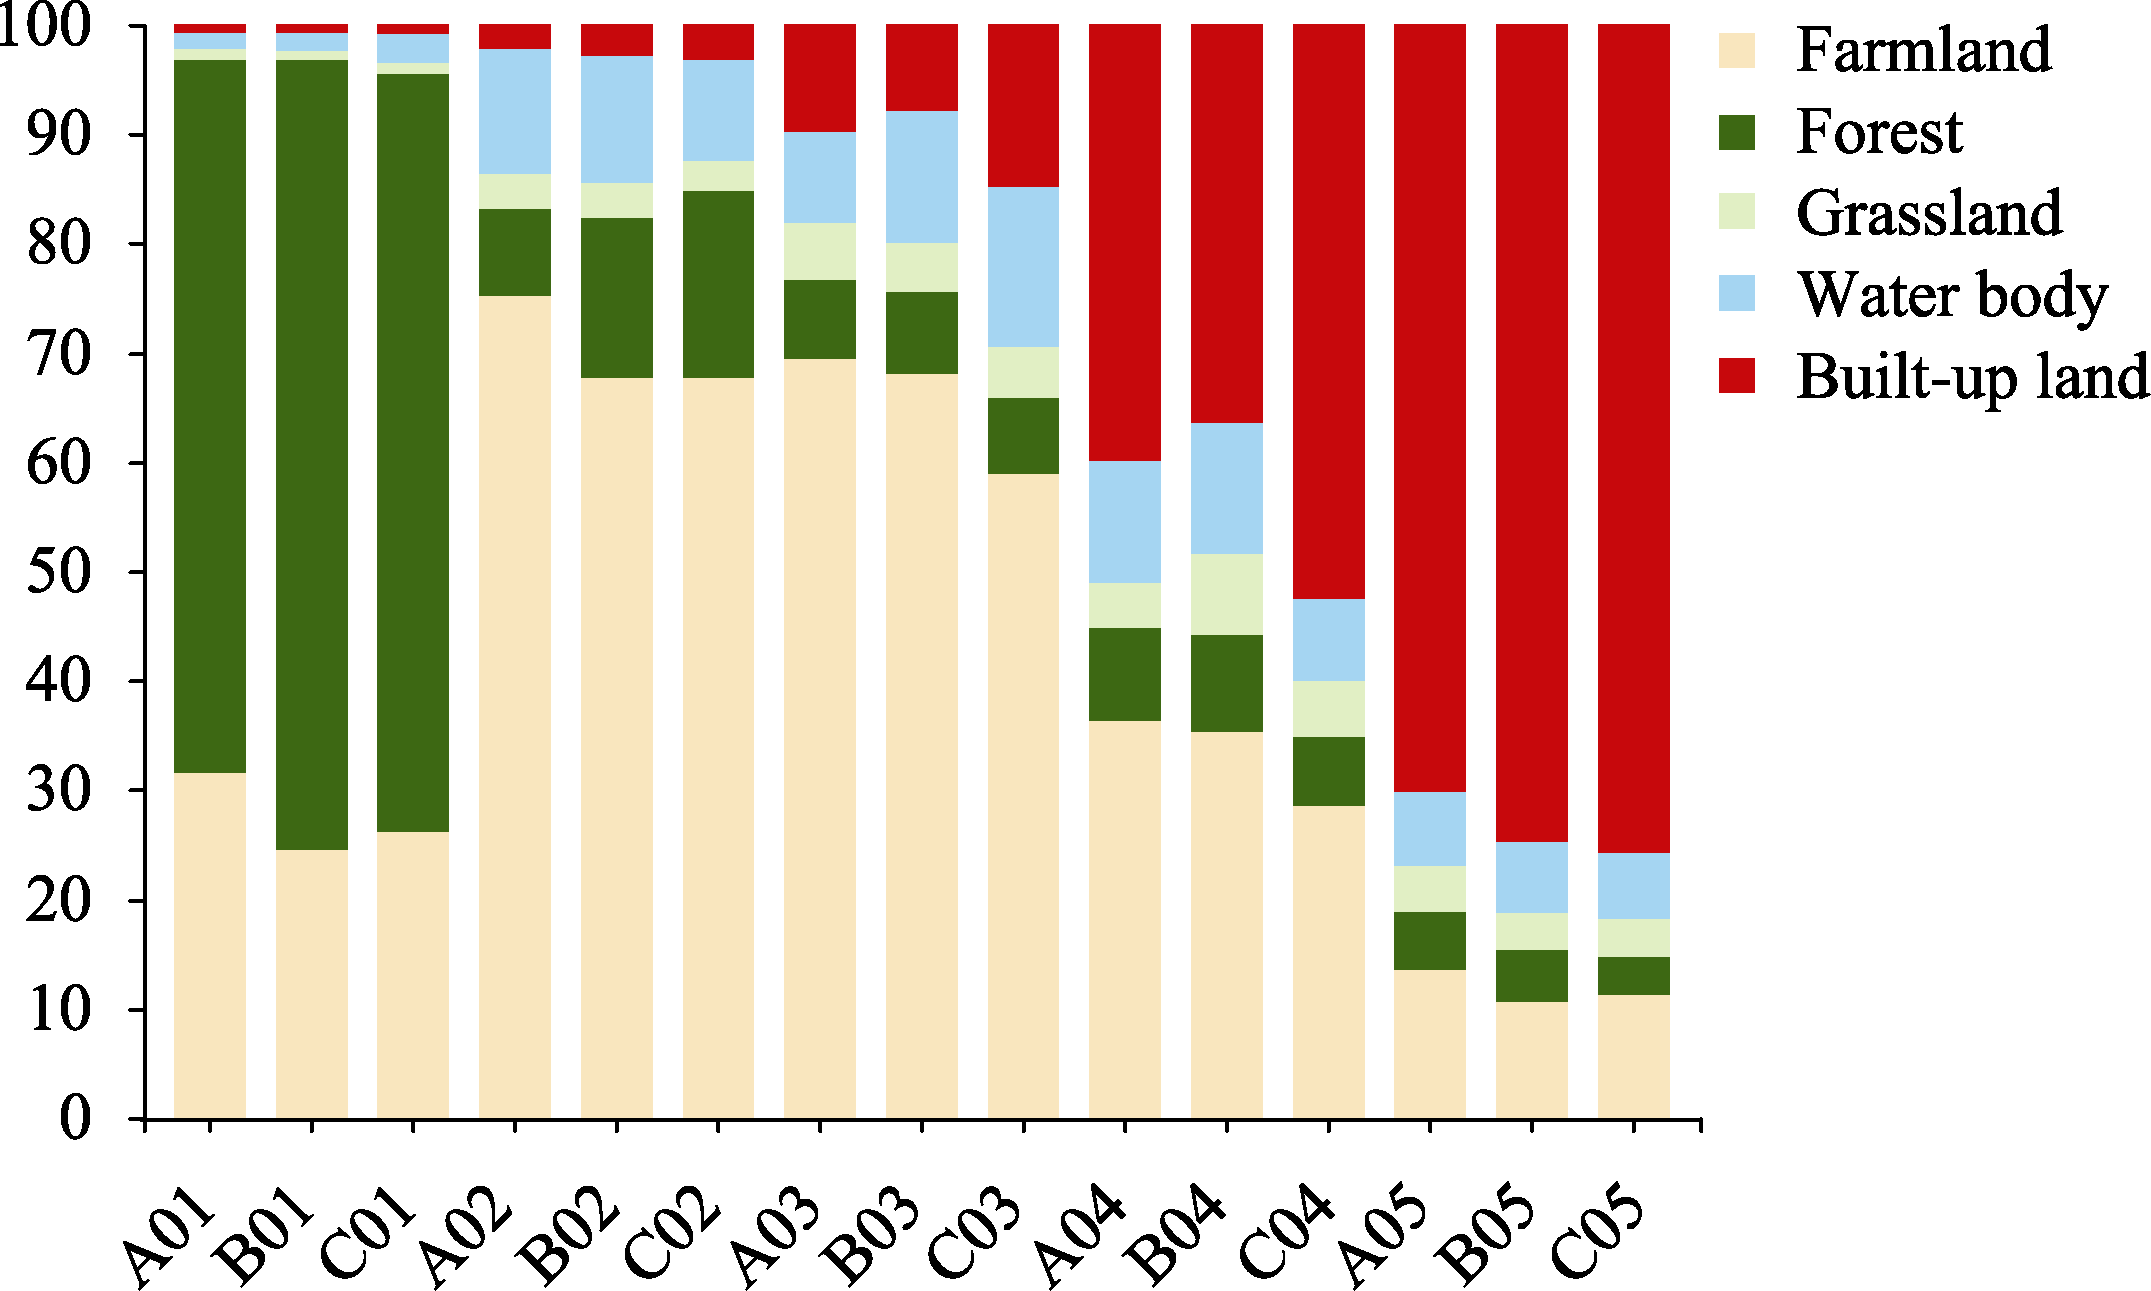
Figure 7
Composition of land use in different years of each conflict type in Nanjing Metropolitan Area
(A, B and C refer to 2000, 2010 and 2020; 01, 02, 03, 04 and 05 refer to lowest, low, medium, high, highest spatial conflict levels, respectively.)
Table 6
Area and proportion of each main functional area plan type in Nanjing Metropolitan Area
Table 7
The PLUS model development zone setting in Nanjing Metropolitan Area
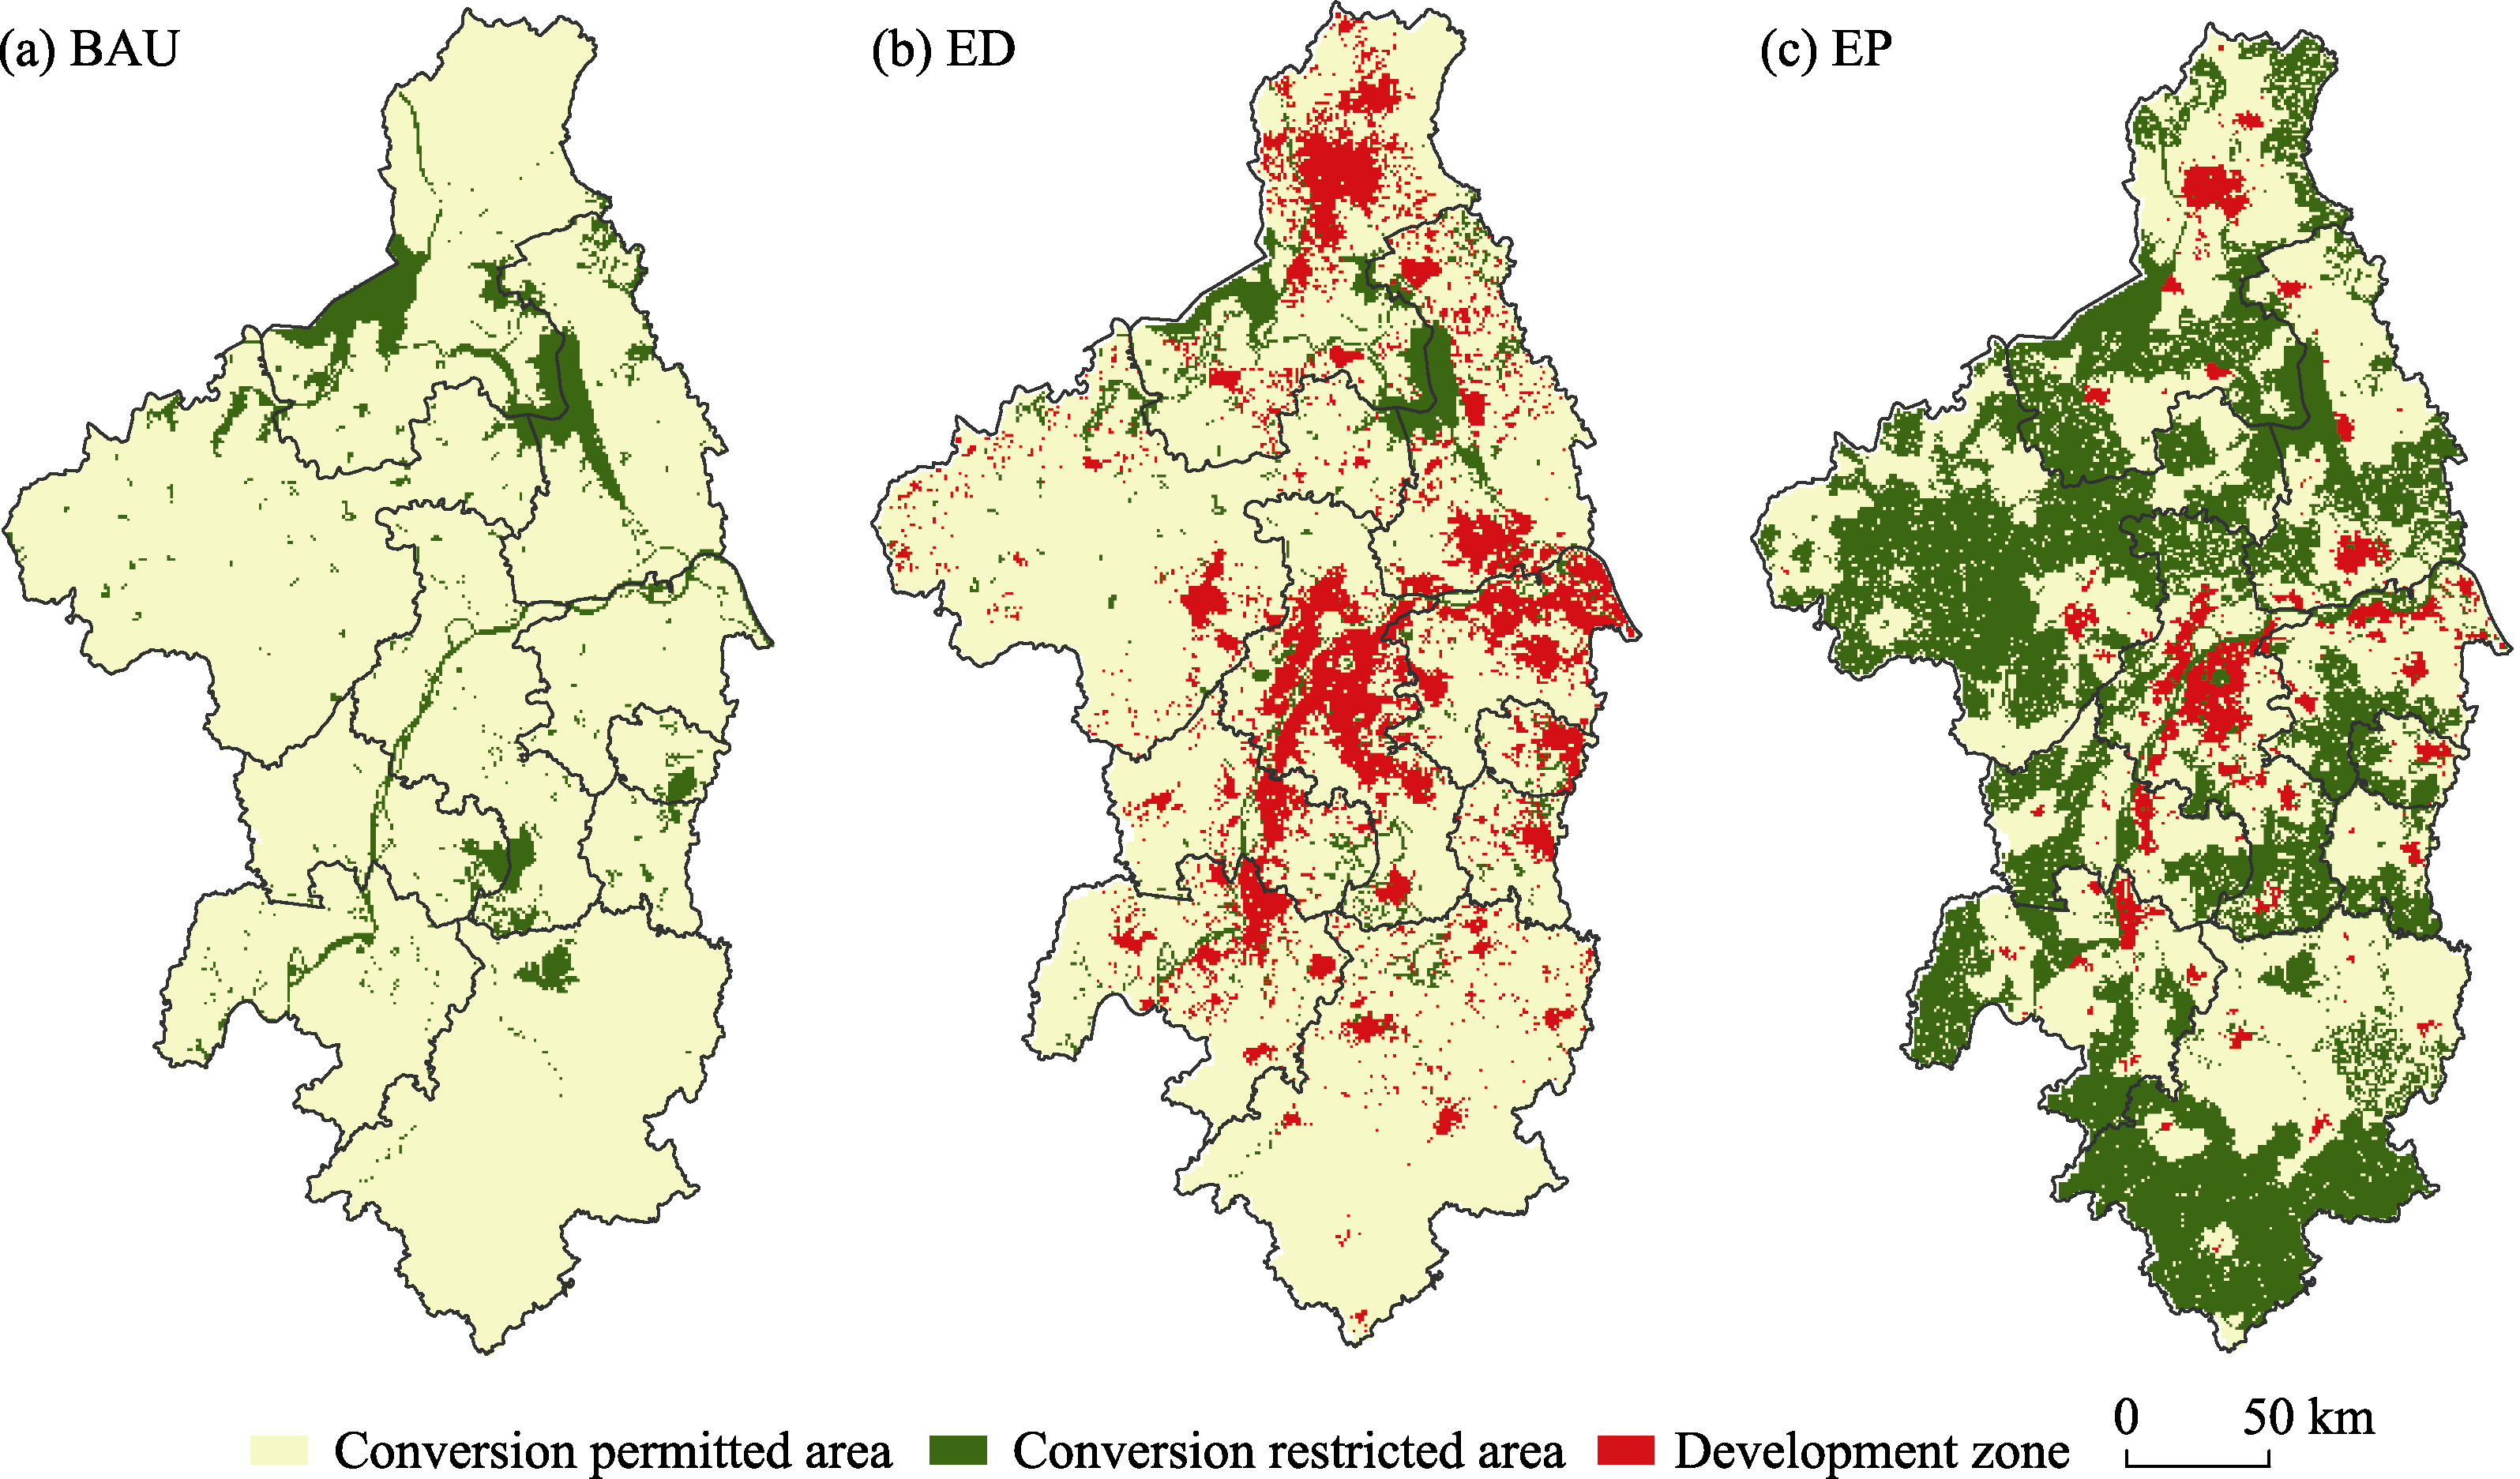
Figure 8
Setting diagram of the development zone under different scenarios in Nanjing Metropolitan Area (a. BAU scenario; b. ED scenario; c. EP scenario)
Table 8
Description table of different scenario settings in Nanjing Metropolitan Area
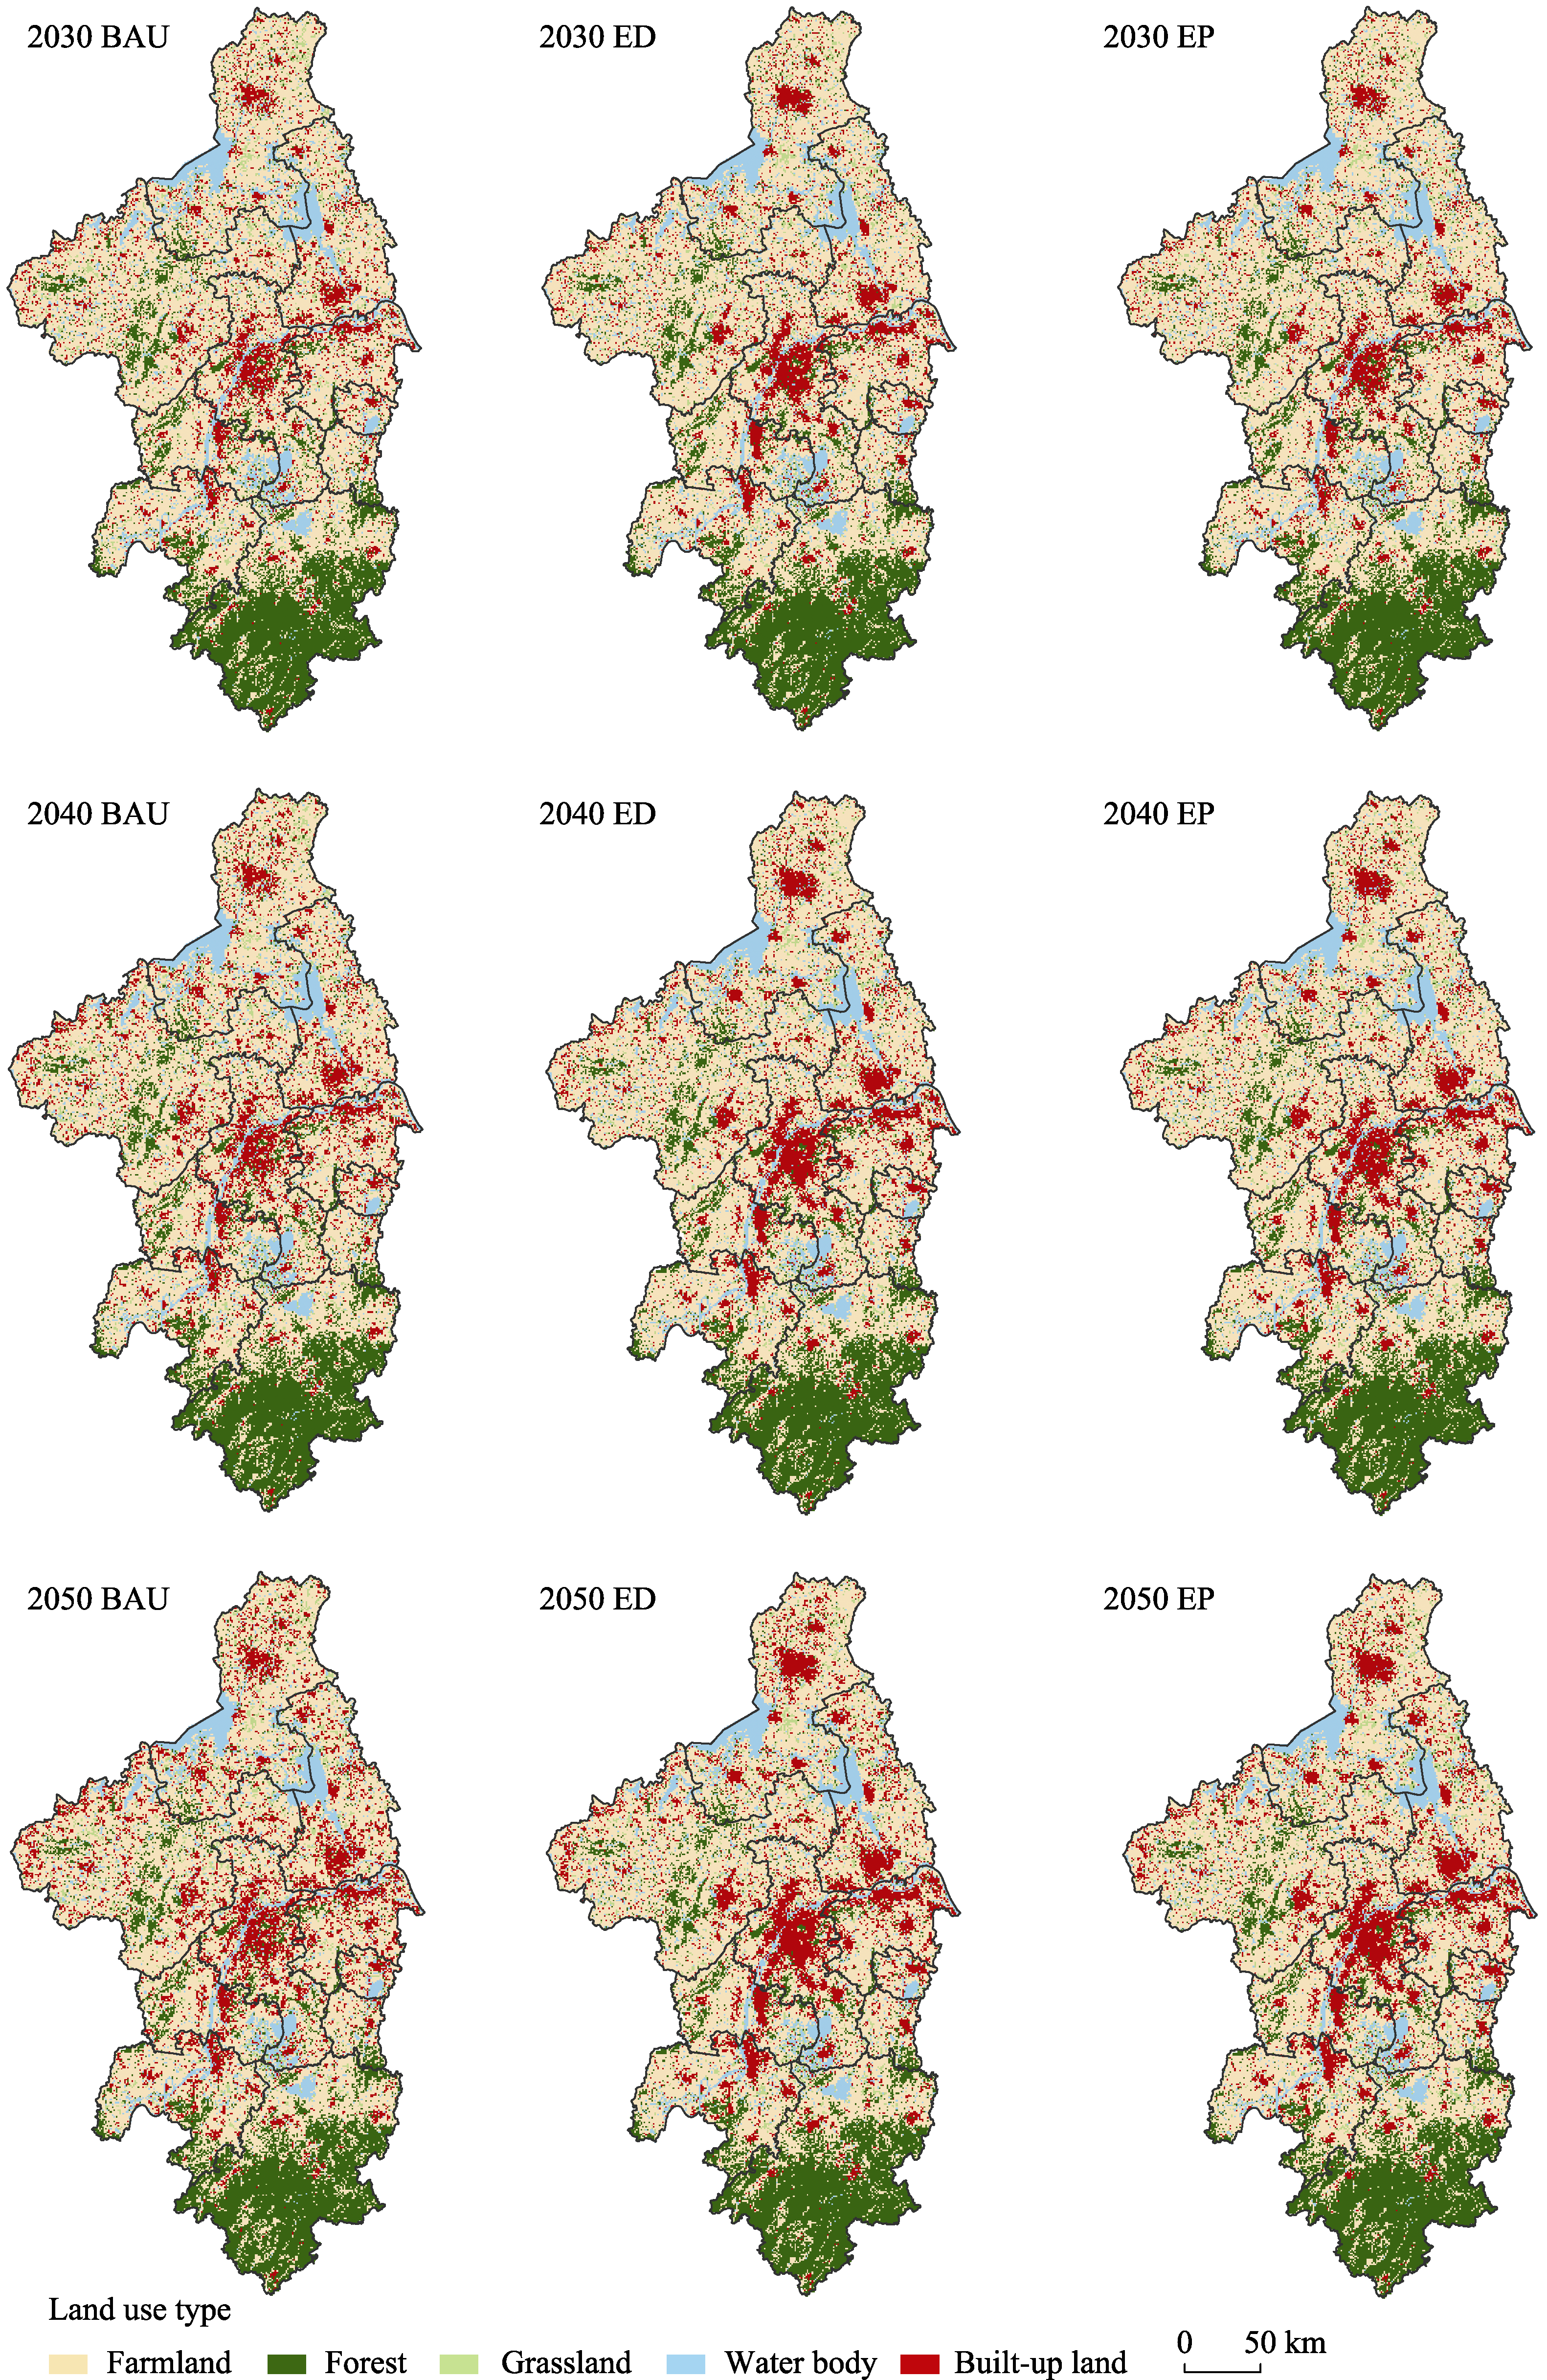
Figure 9
Land use of Nanjing Metropolitan Area under different scenarios in 2030-2050
Table 9
Land use prediction of Nanjing Metropolitan Area in different scenarios