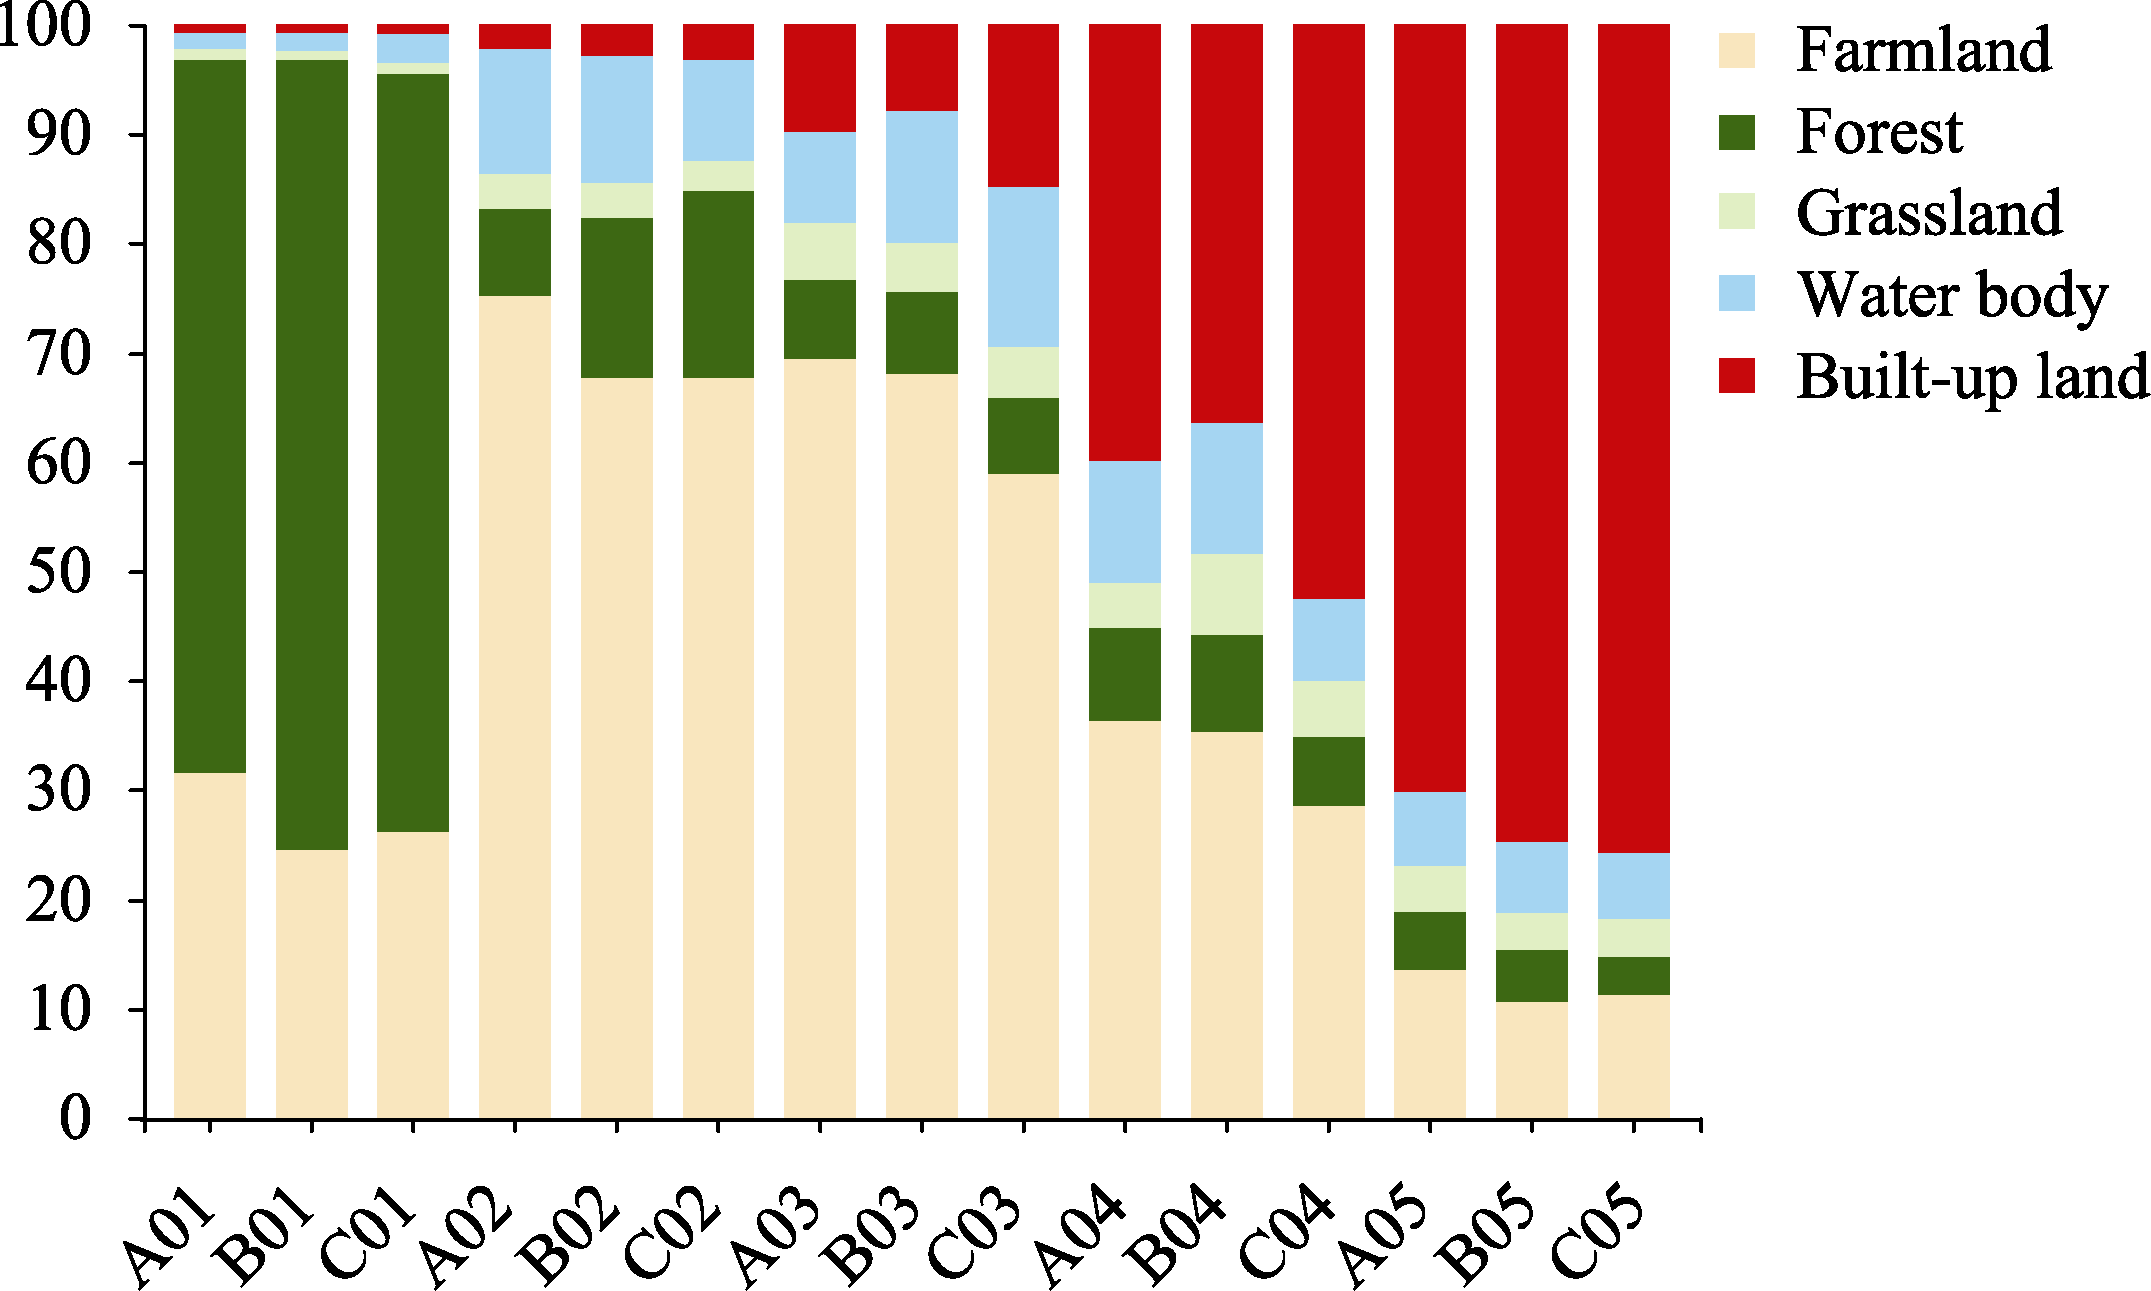
Figure 7 Composition of land use in different years of each conflict type in Nanjing Metropolitan Area (A, B and C refer to 2000, 2010 and 2020; 01, 02, 03, 04 and 05 refer to lowest, low, medium, high, highest spatial conflict levels, respectively.)
Other figure/table from this article