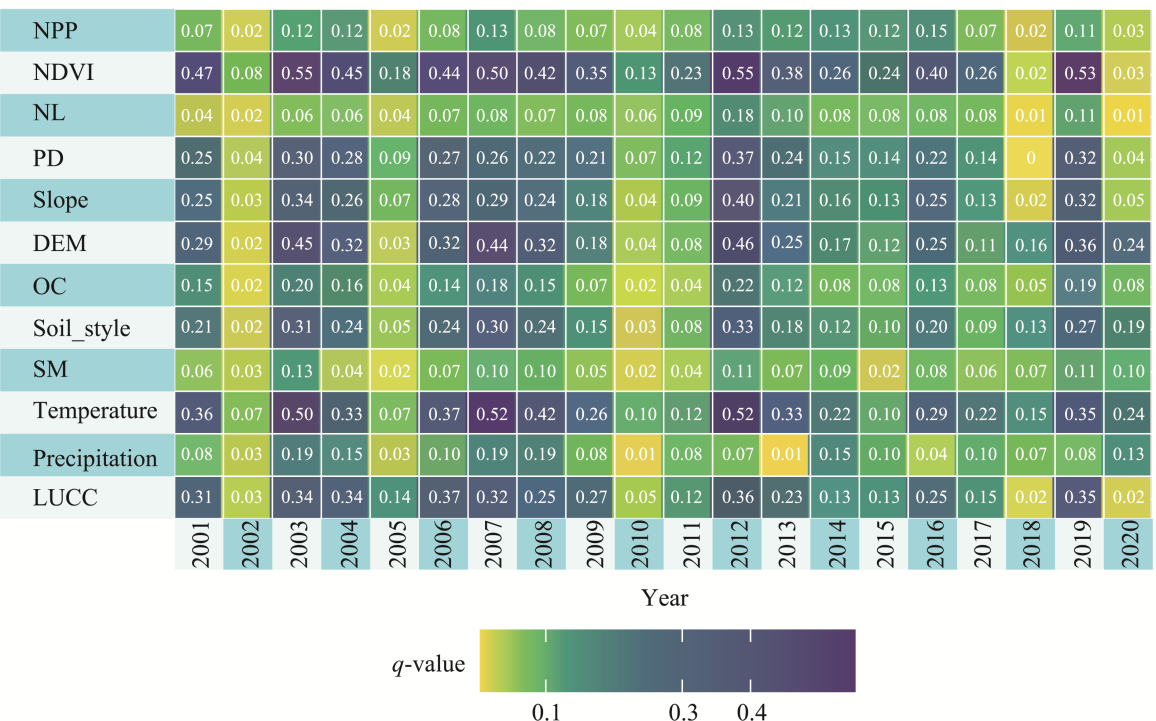
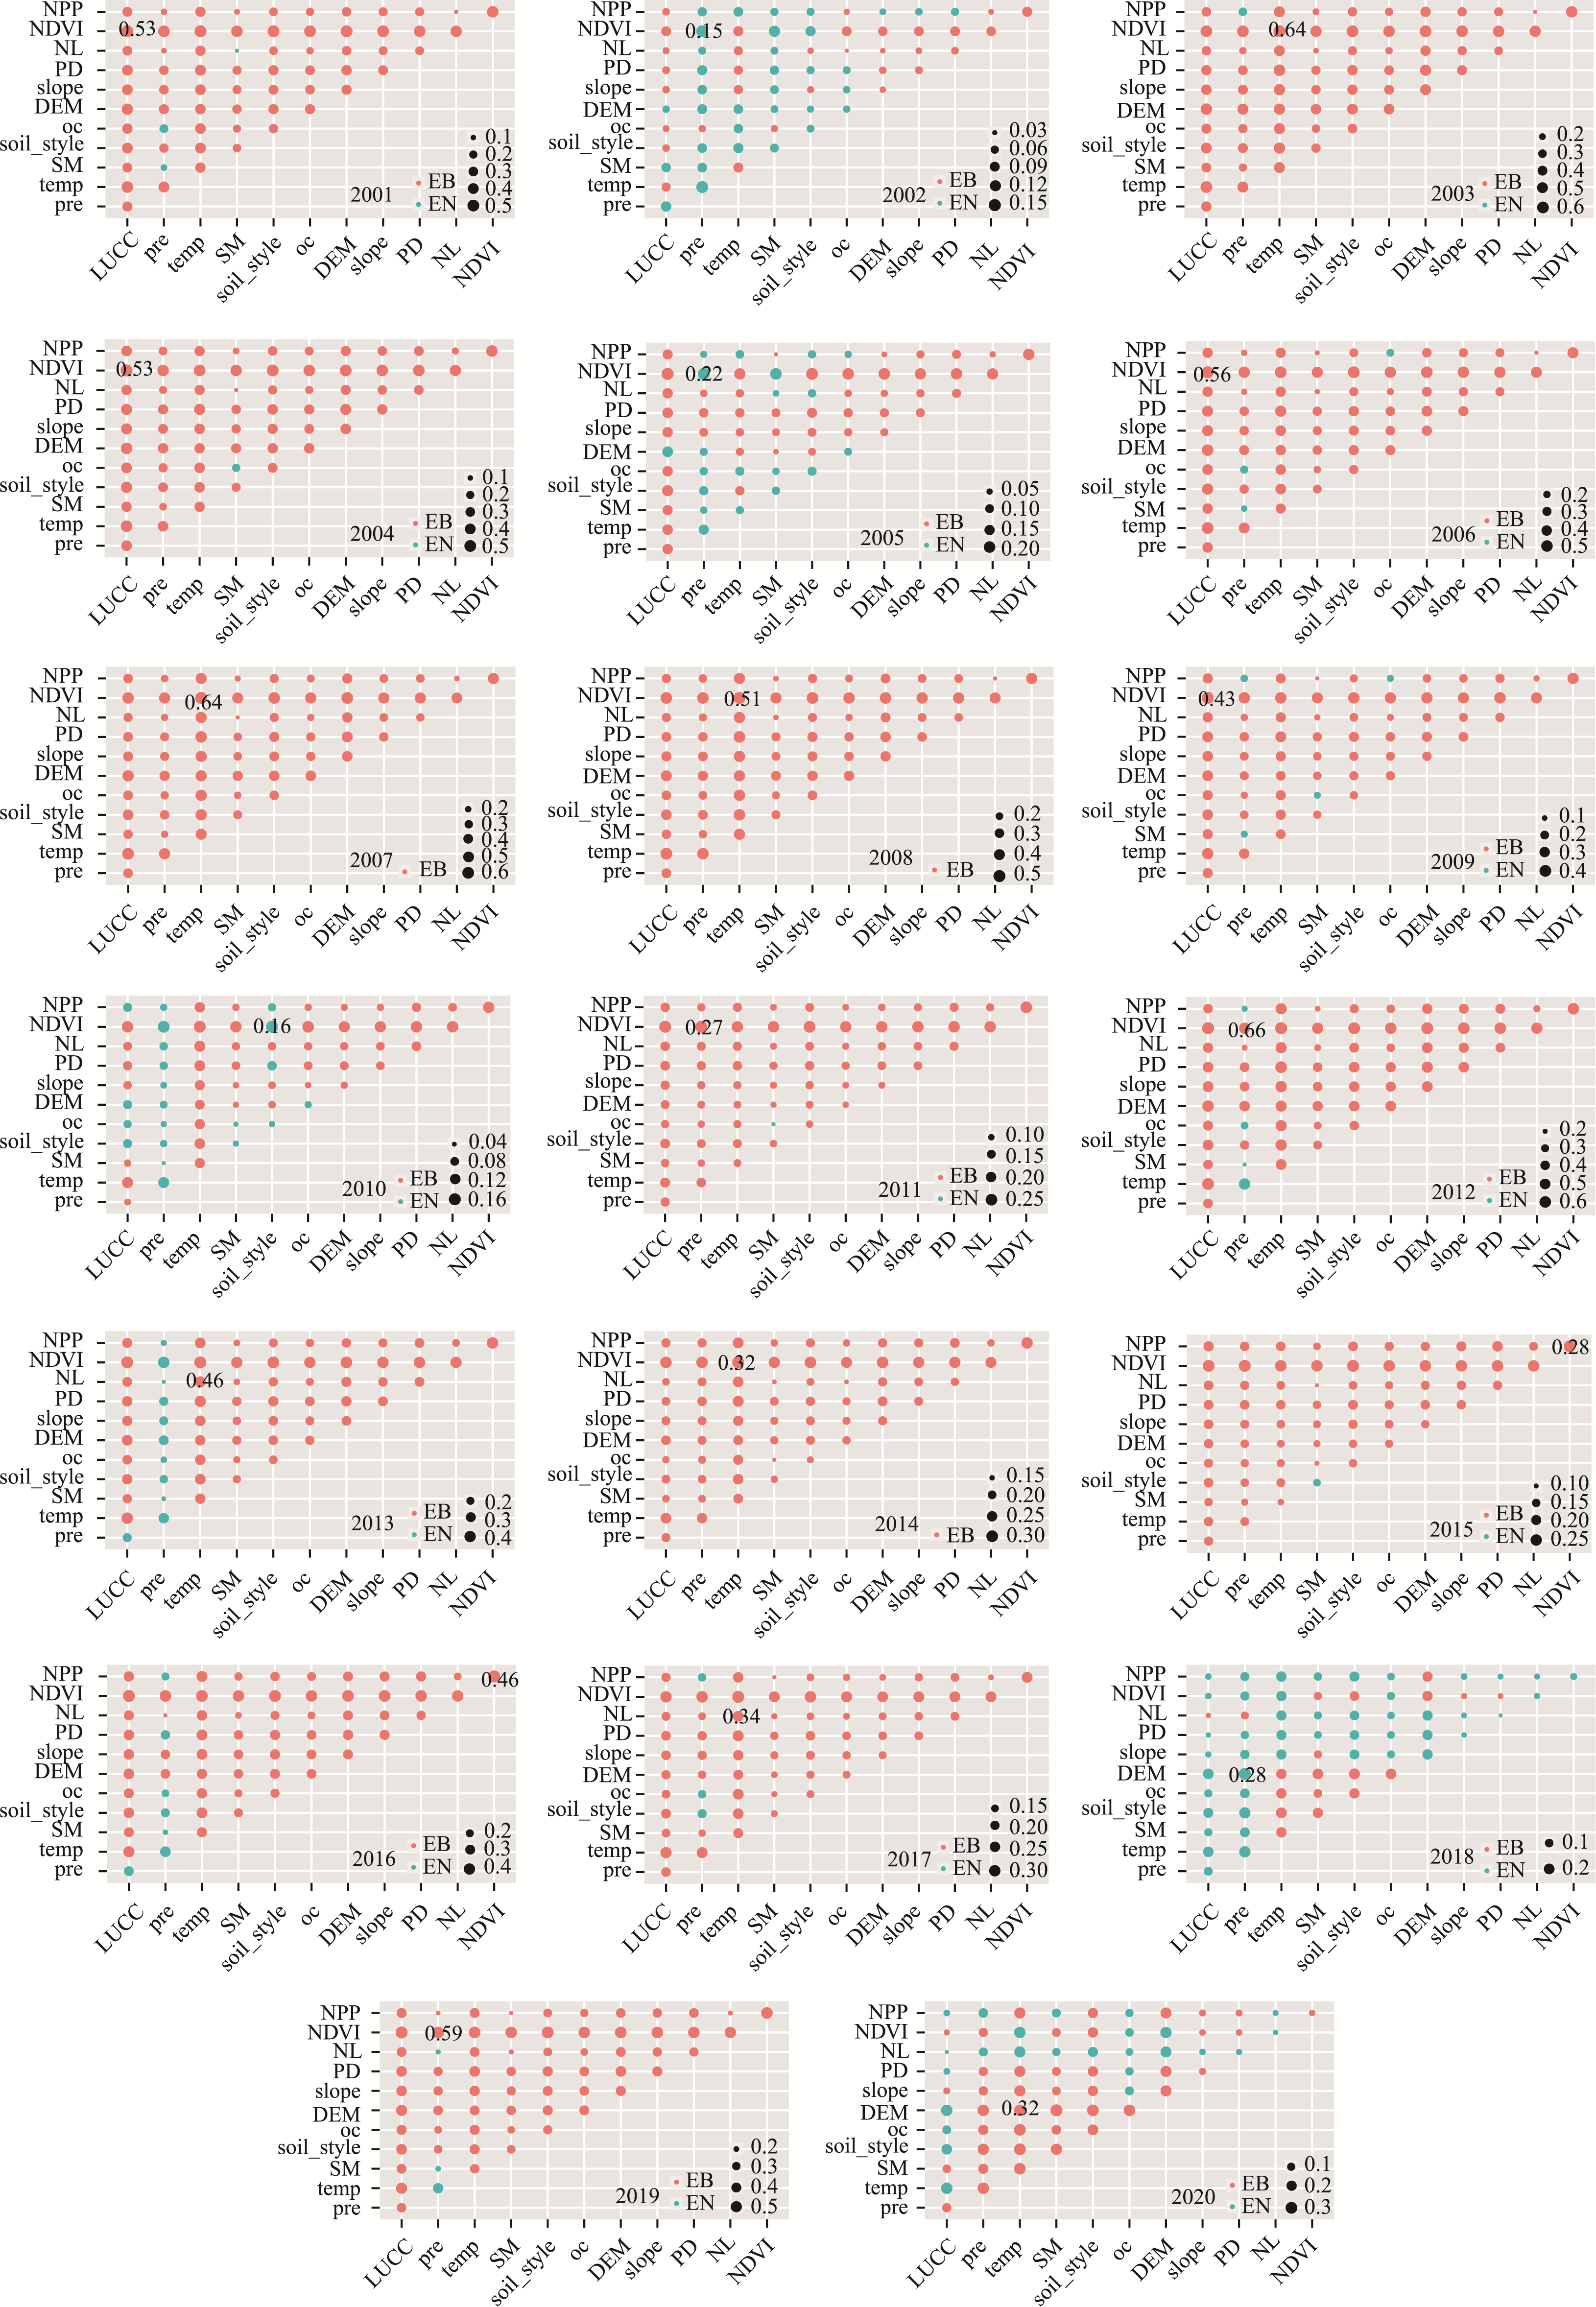
Figure 6 Changes in the trend values of climate (a: precipitation; b: temperature) and vegetation (c: Normalized Difference Vegetation Index; d: net primary productivity), corresponding to those of different significant levels in Remote Sensing Ecological Index (NDVI and NPP are the same meaning in
Figure 8 Spatial patterns of the (a) nighttime light trend slopes, (b) corresponding significance levels, (c) interannual variations in basin-mean nighttime light, and (d) nighttime light trend statistics across RSEI change classes (NL: nighttime light). Notably, the dominant class in panel (a) (−0.0005 to 0.0005) represents near-zero trends rather than negative changes; statistical significance is reported in panel (b).