×
模态框(Modal)标题
在这里添加一些文本
关闭
关闭
提交更改
取消
确定并提交
×
模态框(Modal)标题
×
期刊
文章
图表
检索
EN
中文
首页
关于期刊
期刊介绍
数据库收录
期刊荣誉
编委会
投稿指南
在线期刊
当期目录
优先出版
过刊浏览
推荐文章
专题
按栏目浏览
阅读排行
下载排行
引用排行
E-mail Alert
RSS
期刊订阅
广告合作
联系我们
EN
中文
图/表 详细信息
Influence of human activities on changes in the ecological environment of the Dongting Lake Basin over the past two decades under climate change
PENG Qing, JIANG Yelin, LIU Weiguang, LI Cheng
地理学报(英文版), 2026, 36(
5
): 1173-1197. DOI:
10.1007/s11442-026-2487-8
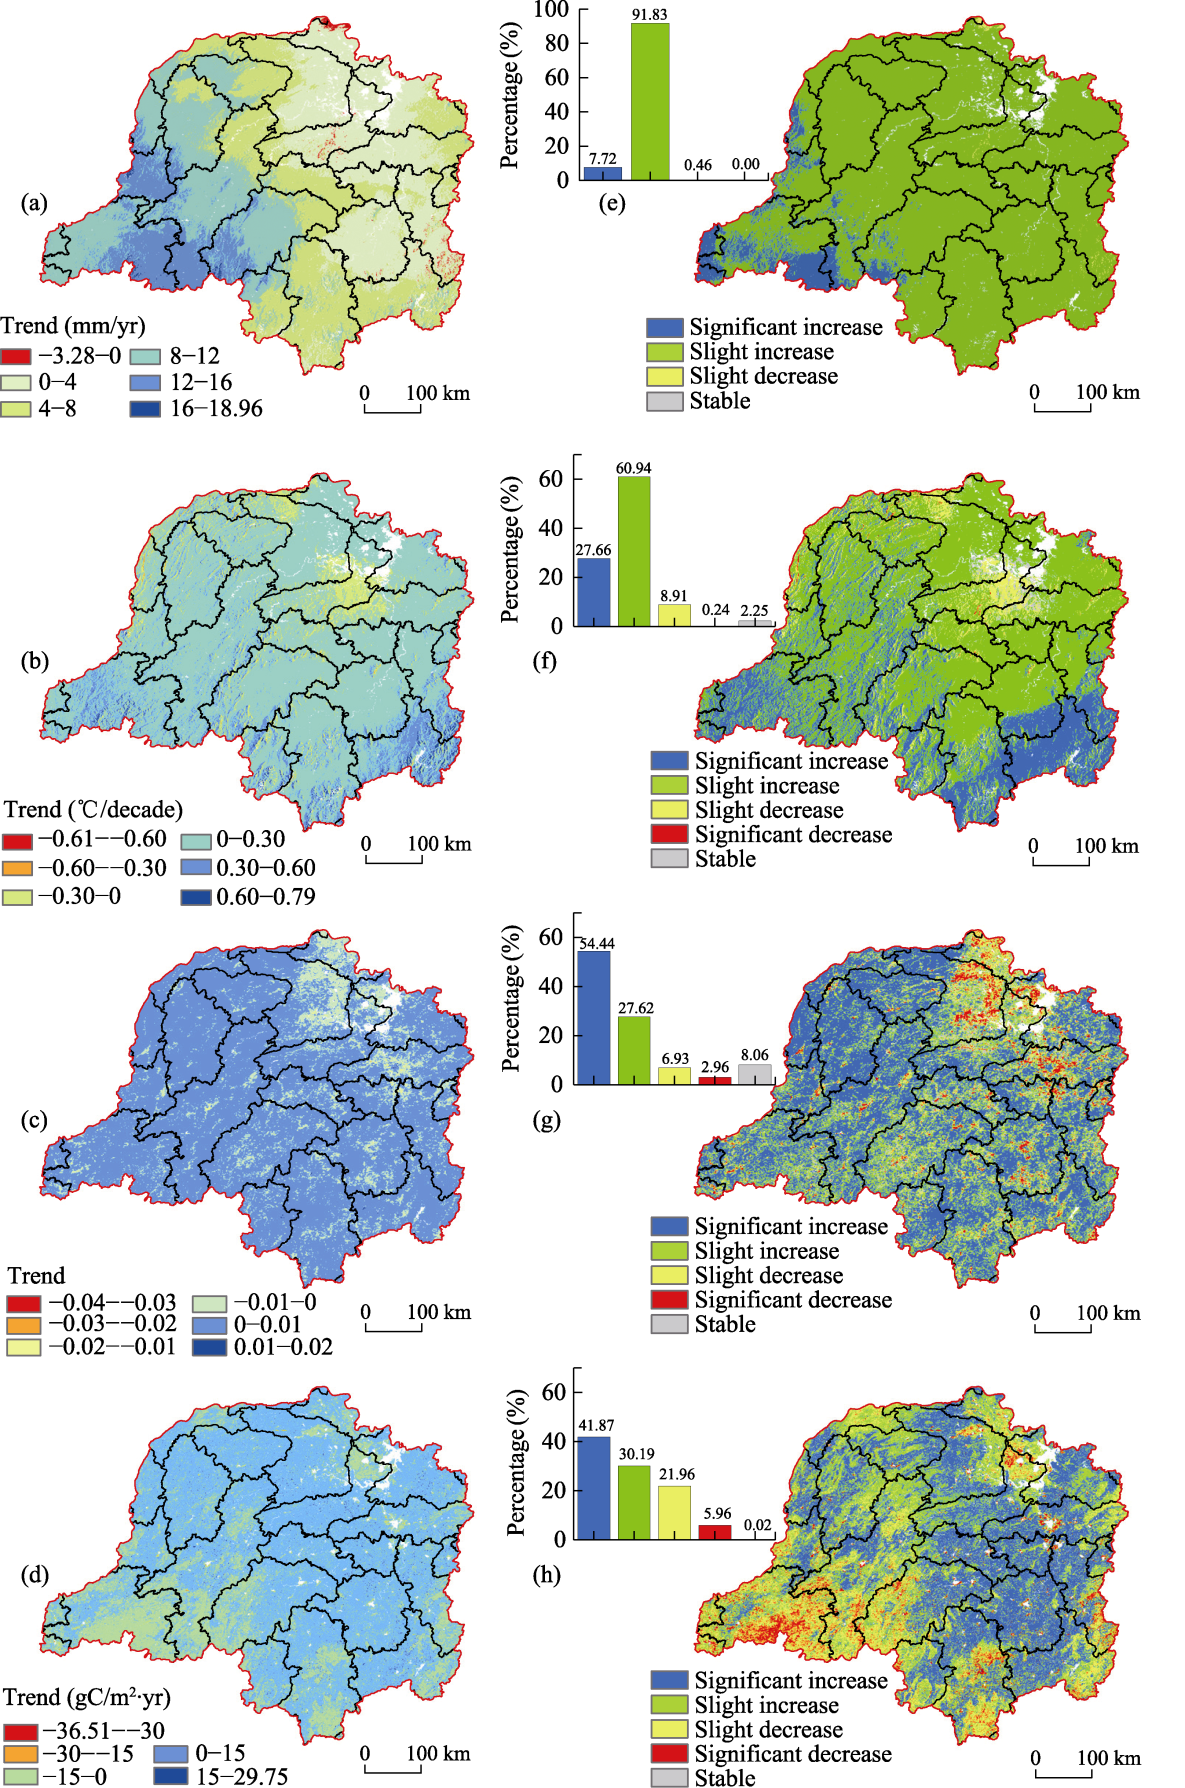
Figure 5
Spatial distribution of the trends of (a-d) precipitation, temperature, Normalized Difference Vegetation Index, and net primary productivity, corresponding to their (e-h) significant levels during 2001-2021
本文的其它图/表
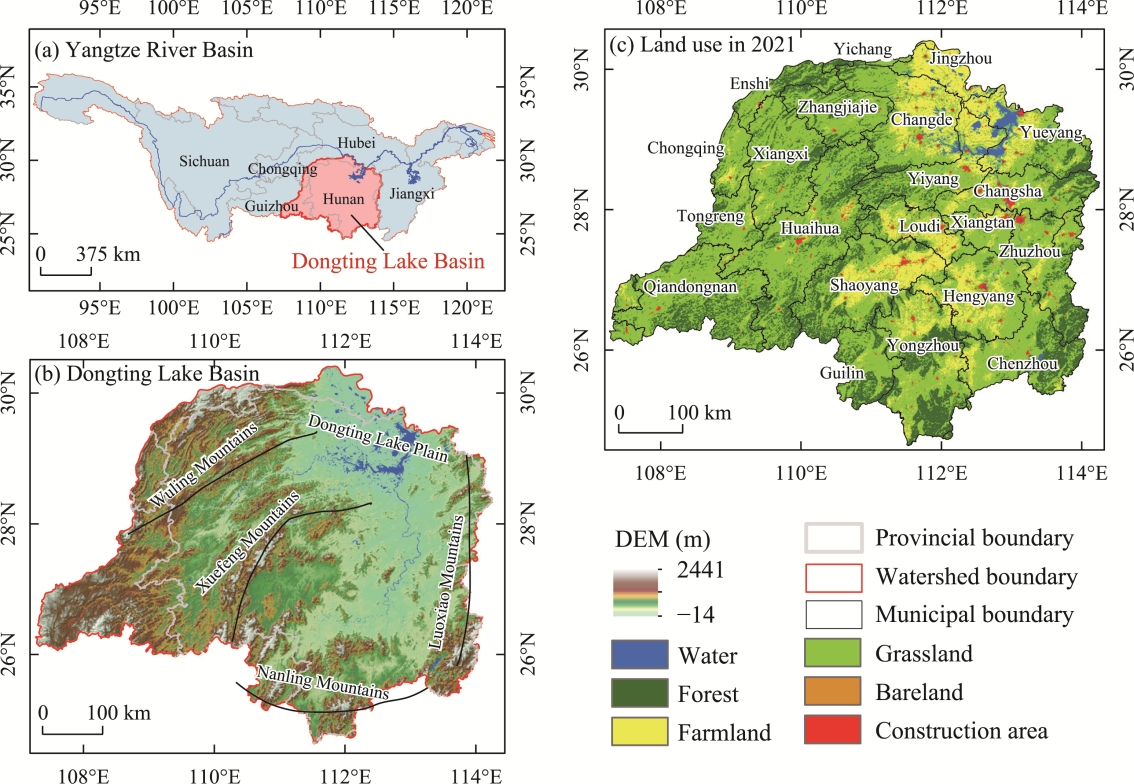
Figure 1
Location of the Dongting Lake Basin in Yangtze River Basin (a), elevation (b) and land use (c) in 2021
Table 1
Data sources and indicator extraction
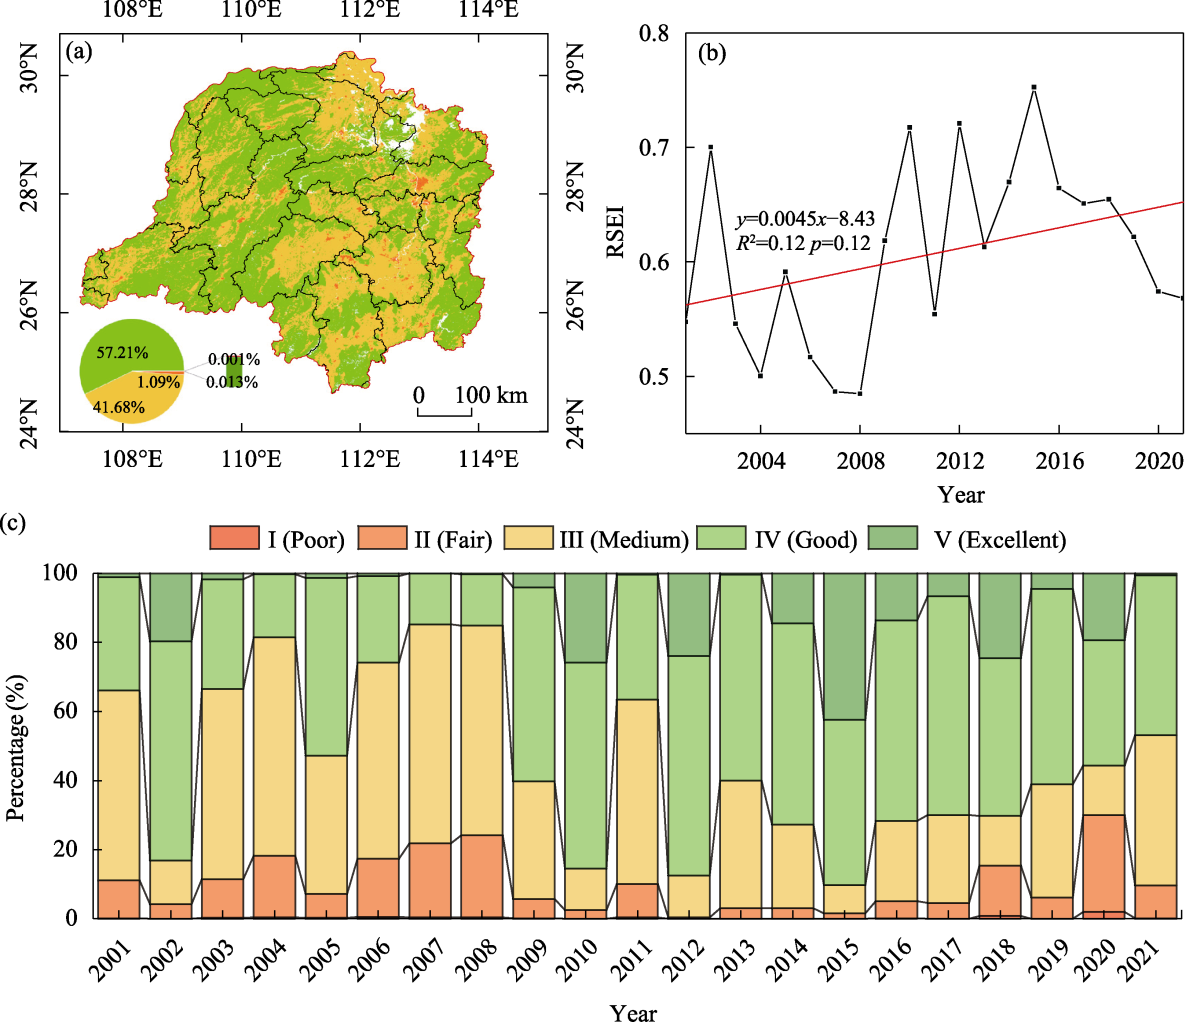
Figure 2
Spatial distribution and temporal variation in the Remote Sensing Ecological Index from 2001 to 2021: (a) spatial pattern of the mean value; (b) annual changes; and (c) proportions of different grades (RSEI: Remote Sensing Ecological Index)
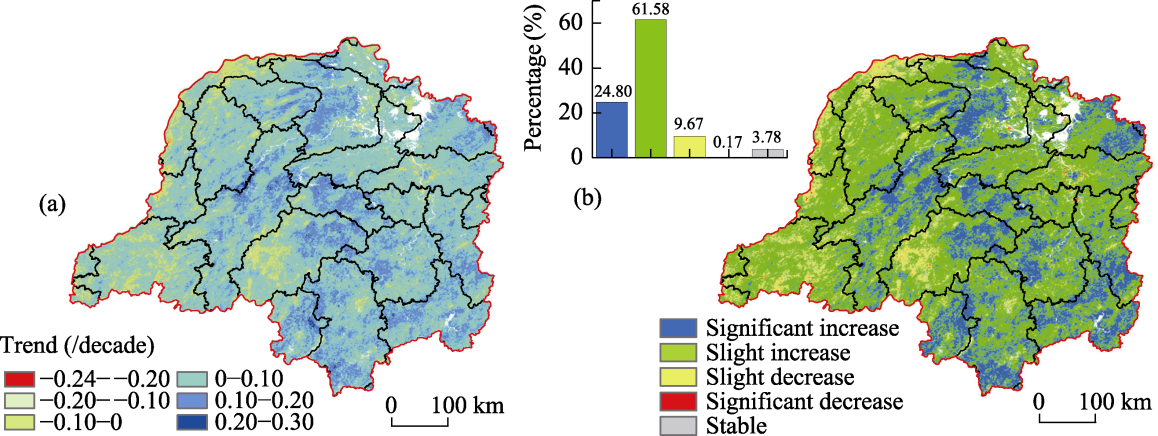
Figure 3
Spatial distribution of (a) Remote Sensing Ecological Index trends and (b) their corresponding significant levels during 2001-2021
Figure 4
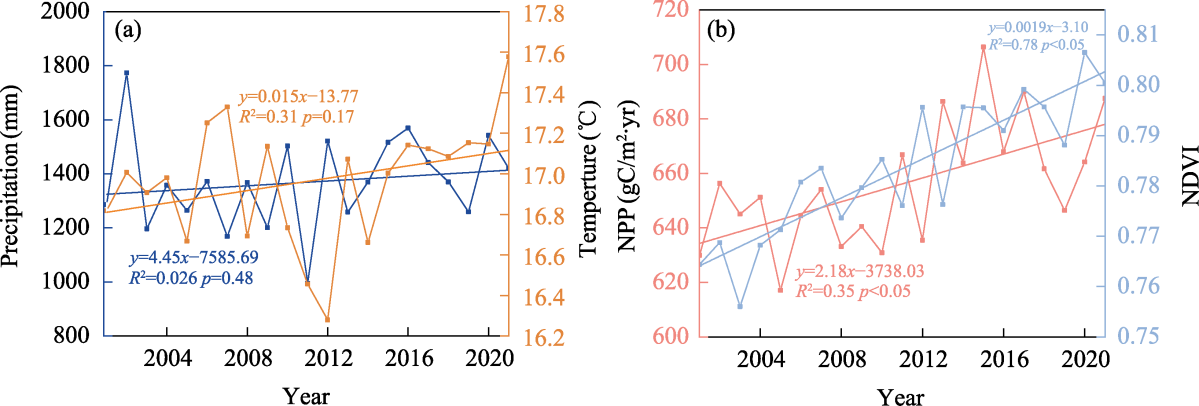
Trends of (a) climate variables and (b) vegetation in the Dongting Lake Basin from 2001 to 2021 (NDVI: Normalized Difference Vegetation Index; NPP: net primary productivity)
Figure 6
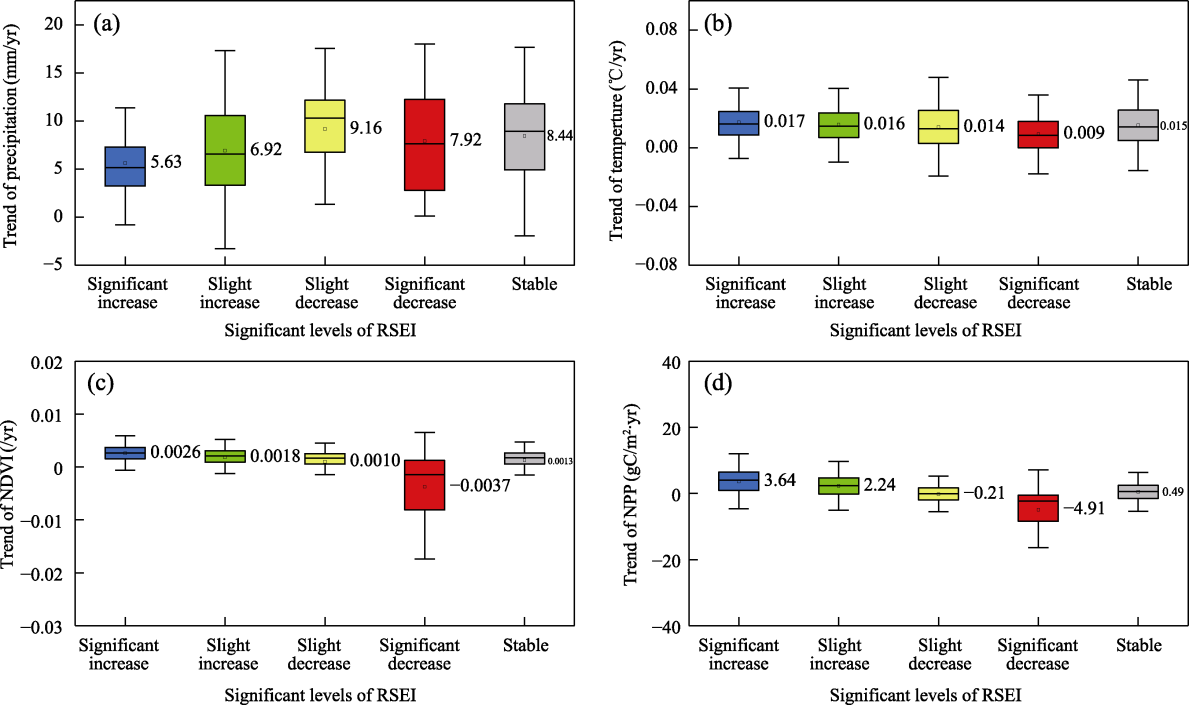
Changes in the trend values of climate (a: precipitation; b: temperature) and vegetation (c: Normalized Difference Vegetation Index; d: net primary productivity), corresponding to those of different significant levels in Remote Sensing Ecological Index (NDVI and NPP are the same meaning in
Figure 4
.)
Figure 7
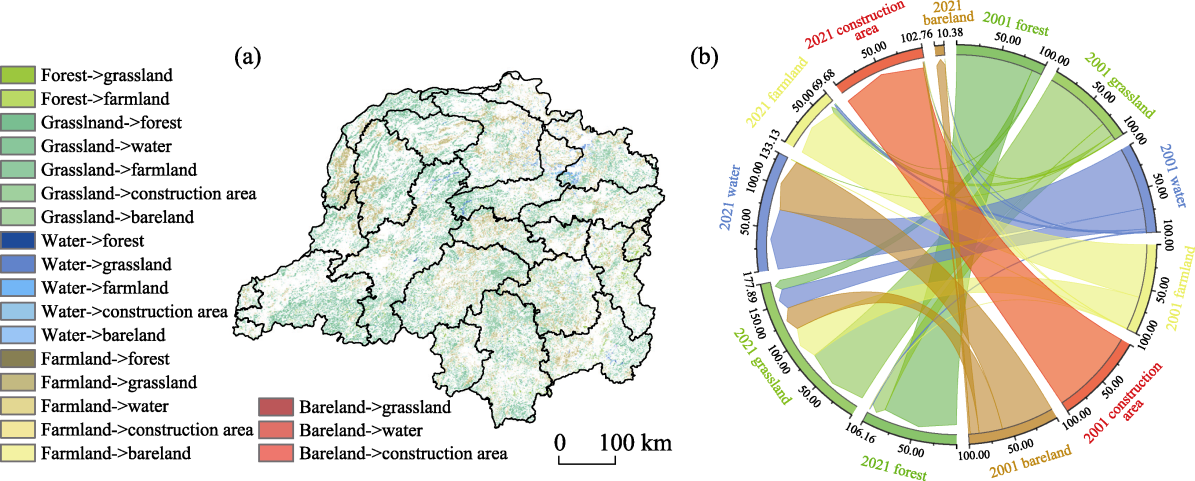
Spatial distribution (a) and ratio chord (b) of land use transformations between 2001 and 2021
Table 2
Transfer matrix of land use types in the Dongting Lake Basin in 2001-2021 (%)
Figure 8
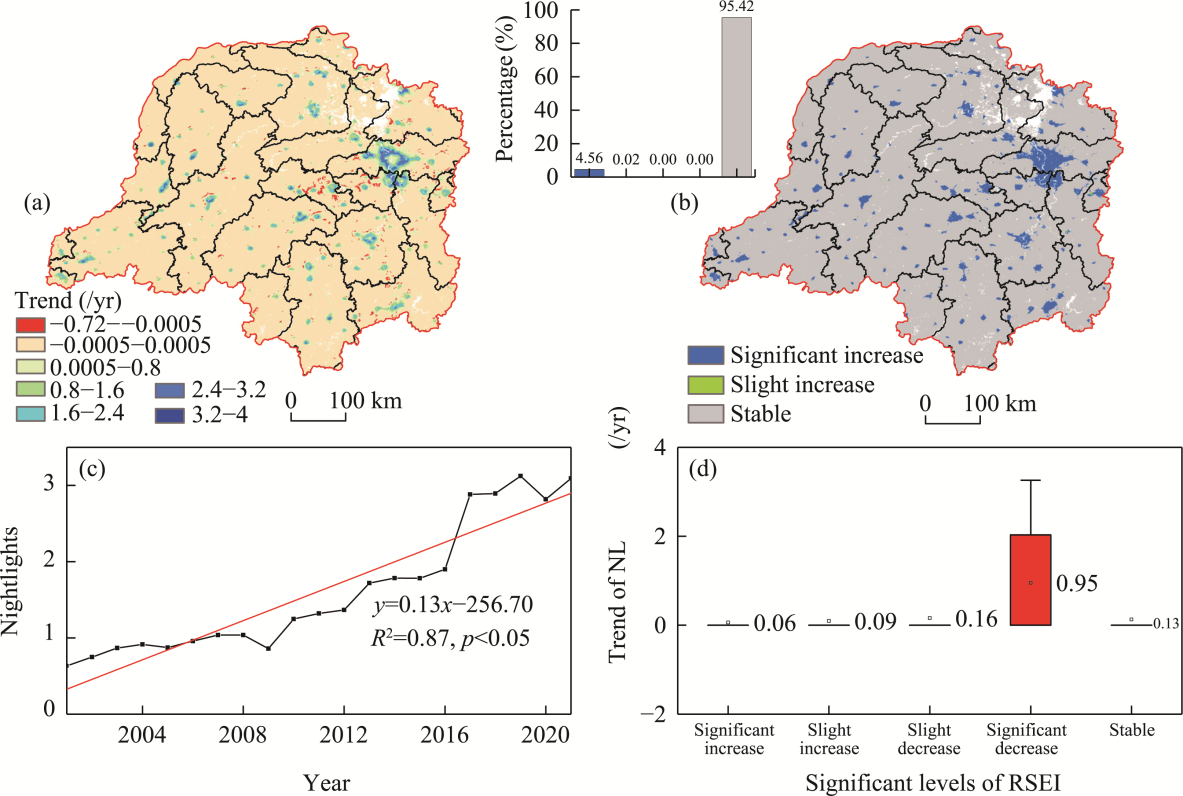
Spatial patterns of the (a) nighttime light trend slopes, (b) corresponding significance levels, (c) interannual variations in basin-mean nighttime light, and (d) nighttime light trend statistics across RSEI change classes (NL: nighttime light). Notably, the dominant class in panel (a) (−0.0005 to 0.0005) represents near-zero trends rather than negative changes; statistical significance is reported in panel (b).
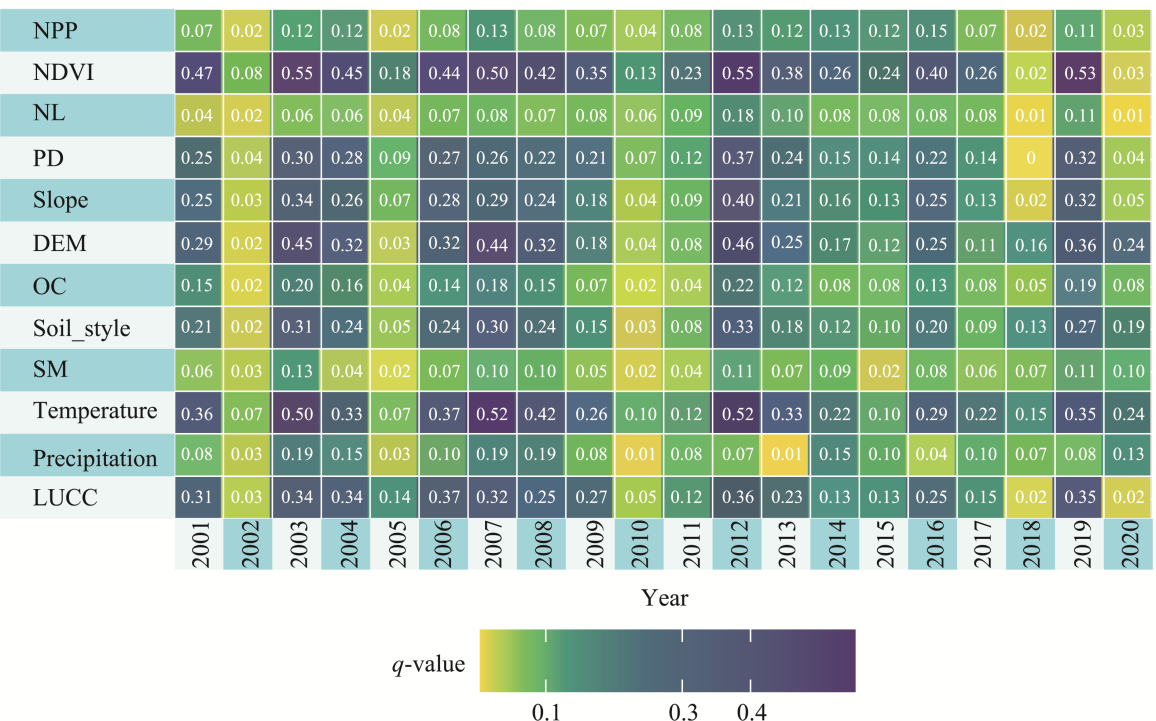
Figure 9
Single-factor identification of the influencing factors of ecological environment quality from 2001 to 2020 (NPP, NDVI are the same meaning in
Figure 4
; NL is the same meaning in
Figure 8
; PD: population density; OC: organic matter content; SM: soil moisture.)
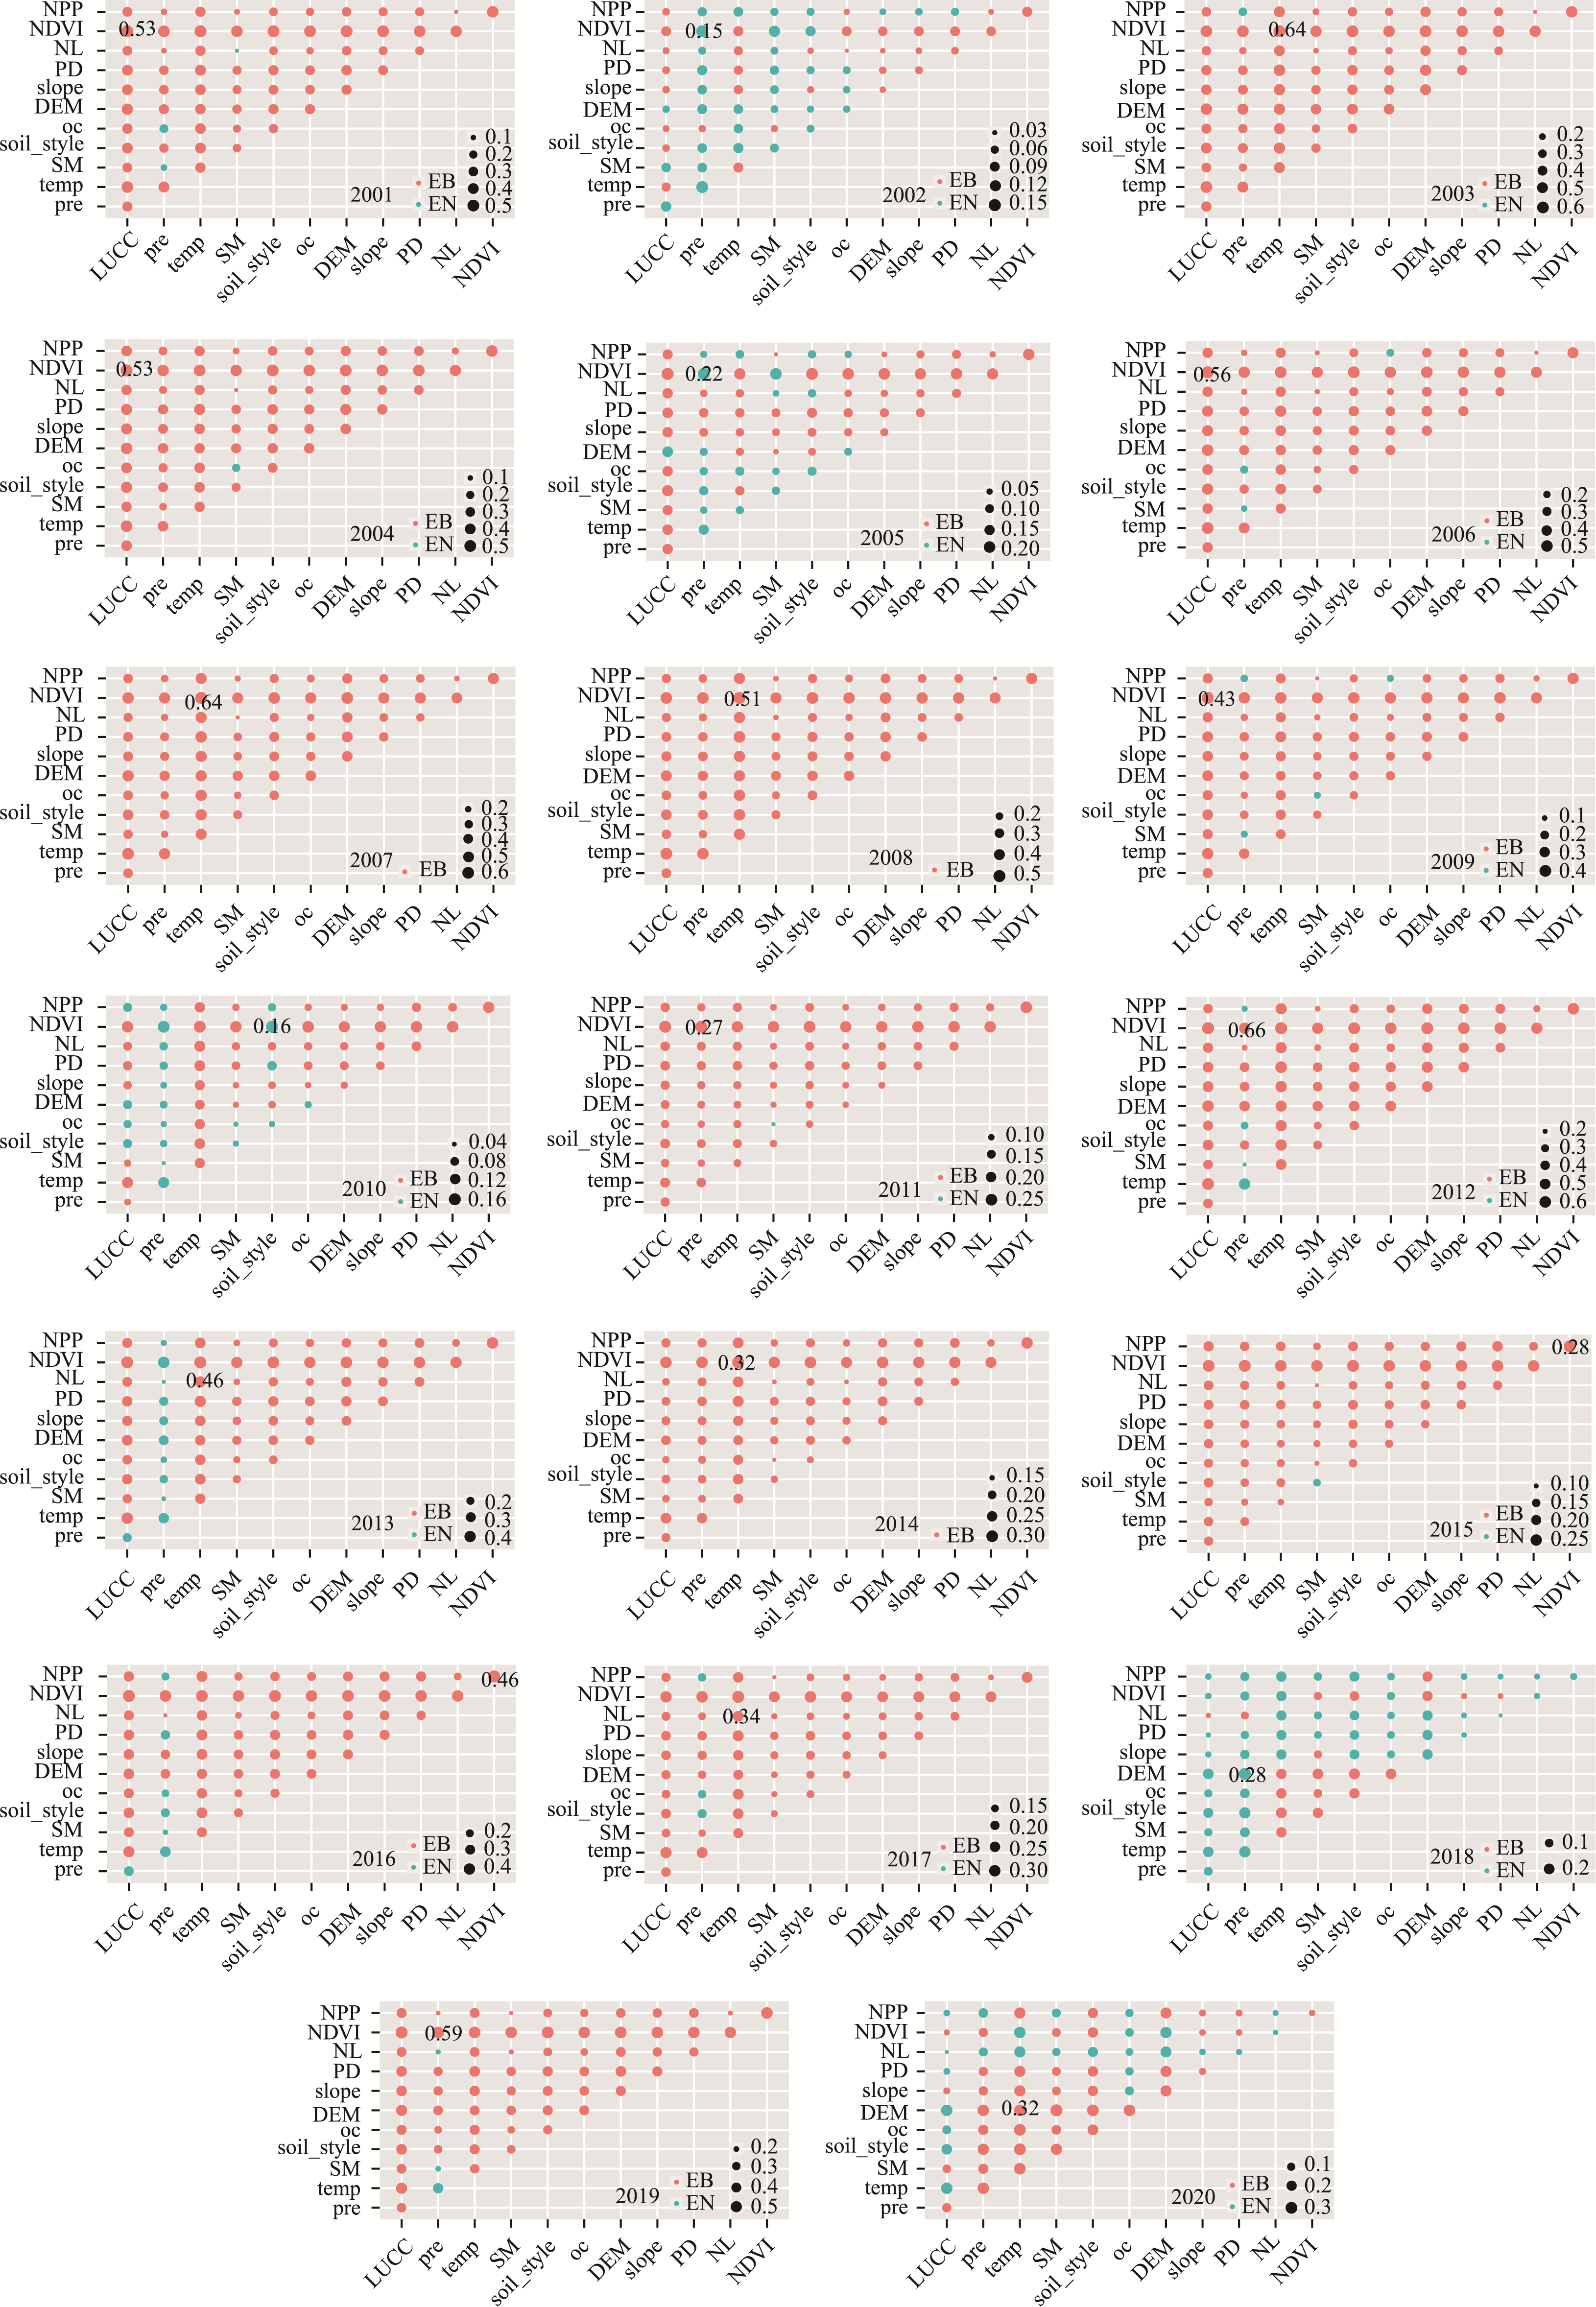
Figure 10
Results of interaction detection from 2001 to 2020 (EN: enhance nonlinear; EB: enhance bi-variable. NPP, NDVI, PD, NL, OC and SM are the same meaning in
Figure 9
.)