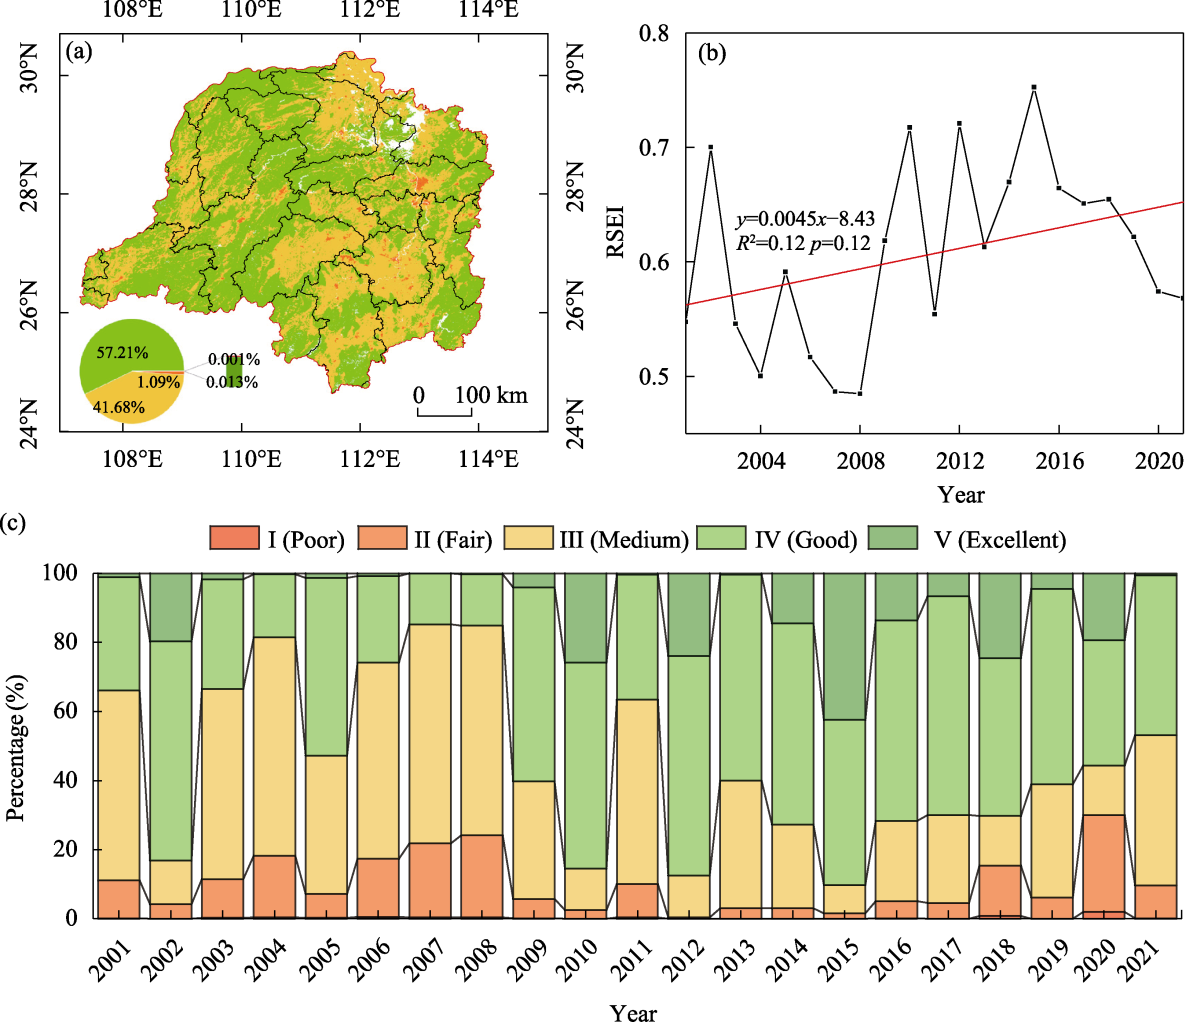
Figure 2 Spatial distribution and temporal variation in the Remote Sensing Ecological Index from 2001 to 2021: (a) spatial pattern of the mean value; (b) annual changes; and (c) proportions of different grades (RSEI: Remote Sensing Ecological Index)
本文的其它图/表