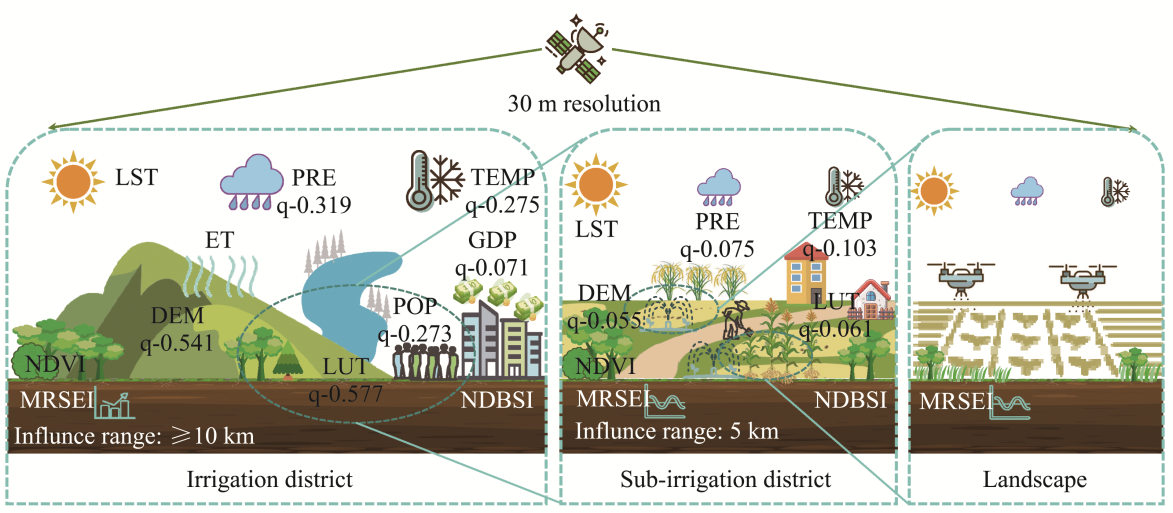
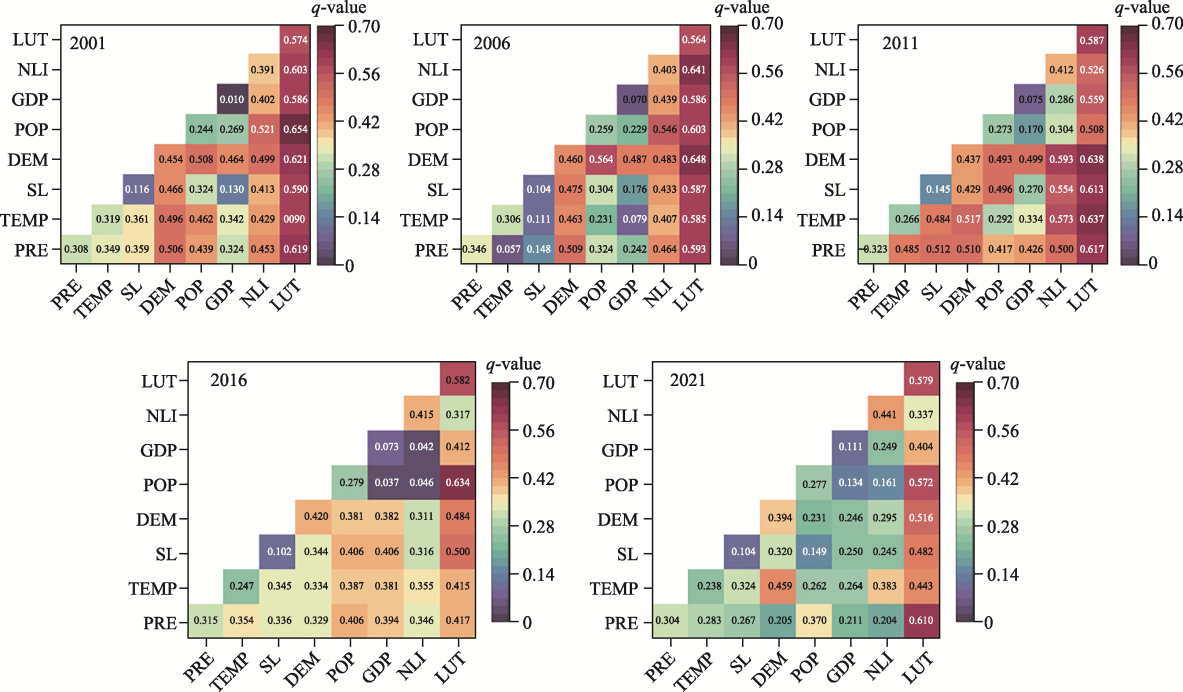
Figure 11 Diagram of driving process on ecological quality at different scales (L, M and S are the same meaning in Figure 5; NDVI: normalized difference vegetation index; ET: evapotranspiration; LST: land surface temperature; NDBSI: normalized difference built-up and soil index; PRE: precipitation; TEMP: temperature; LUT: land use type; GDP: gross domestic product; DEM: digital elevation model; POP: population)
本文的其它图/表