×
模态框(Modal)标题
在这里添加一些文本
关闭
关闭
提交更改
取消
确定并提交
×
模态框(Modal)标题
×
期刊
文章
图表
检索
EN
中文
首页
关于期刊
期刊介绍
数据库收录
期刊荣誉
编委会
投稿指南
在线期刊
当期目录
优先出版
过刊浏览
推荐文章
专题
按栏目浏览
阅读排行
下载排行
引用排行
E-mail Alert
RSS
期刊订阅
广告合作
联系我们
EN
中文
图/表 详细信息
Multi-scale analysis of spatiotemporal evolution and driving factors of eco-environmental quality in a Ningxia irrigation district, China
LI Zequan, CHAI Mingtang, ZHU Lei, HE Junjie, DING Yimin, XU Fengkun, XU Xiyuan
地理学报(英文版), 2026, 36(
2
): 471-493. DOI:
10.1007/s11442-026-2456-2
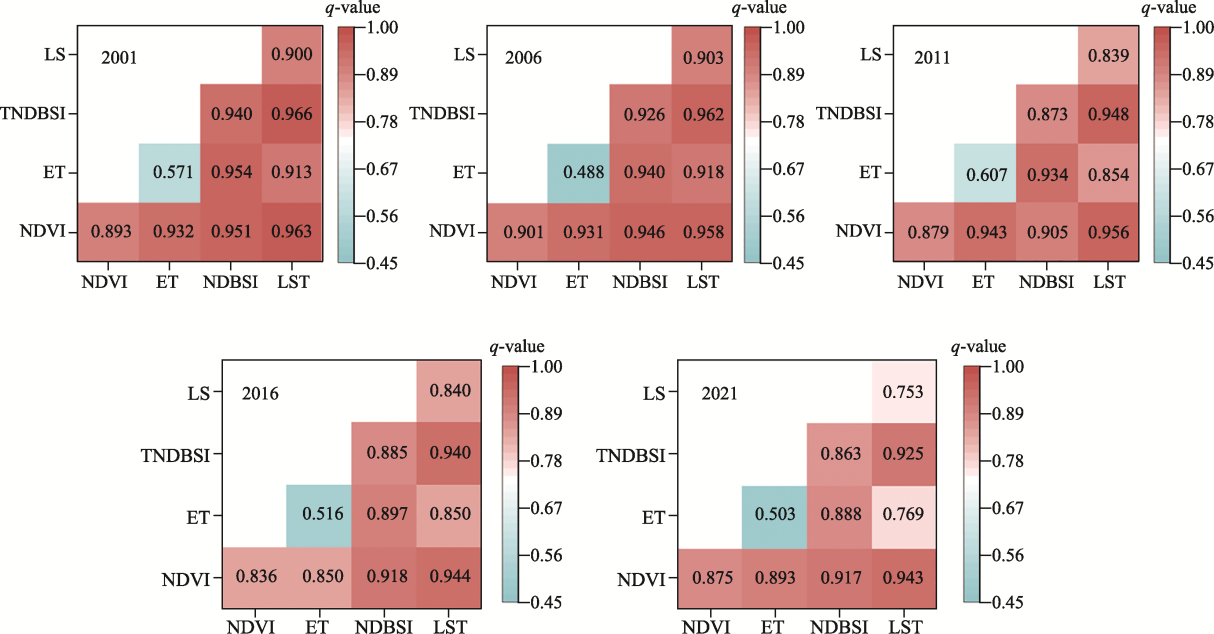
Figure 6
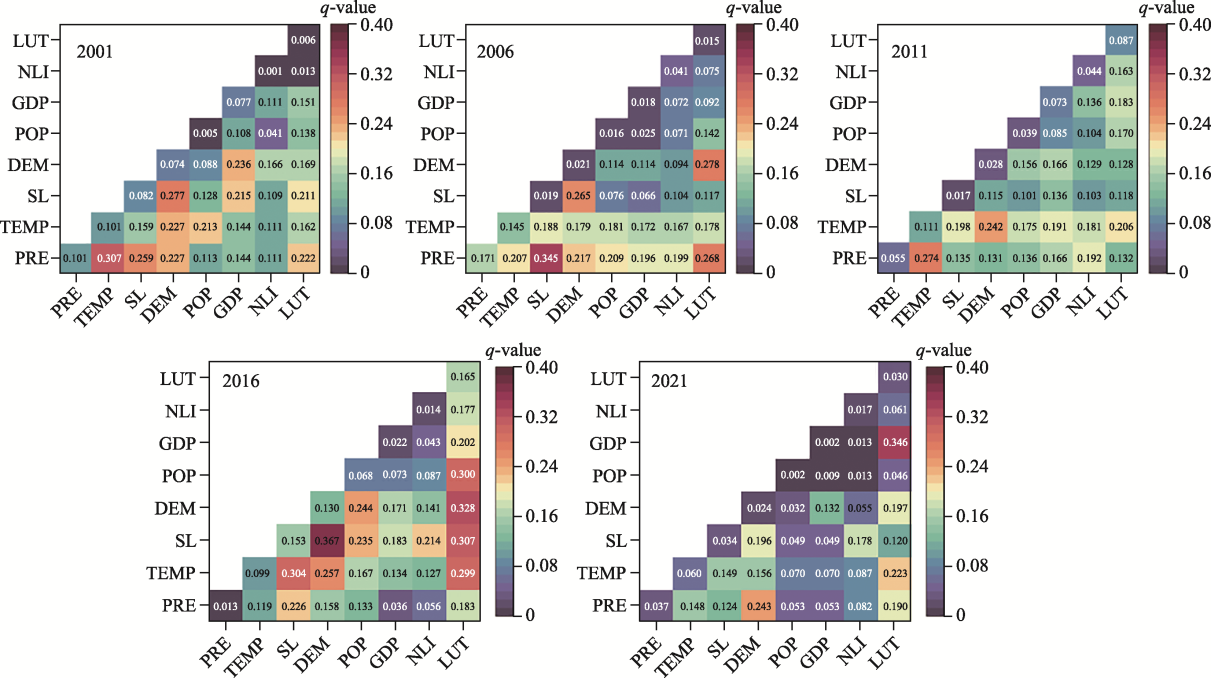
Results of interactive detection of ecological factors
本文的其它图/表
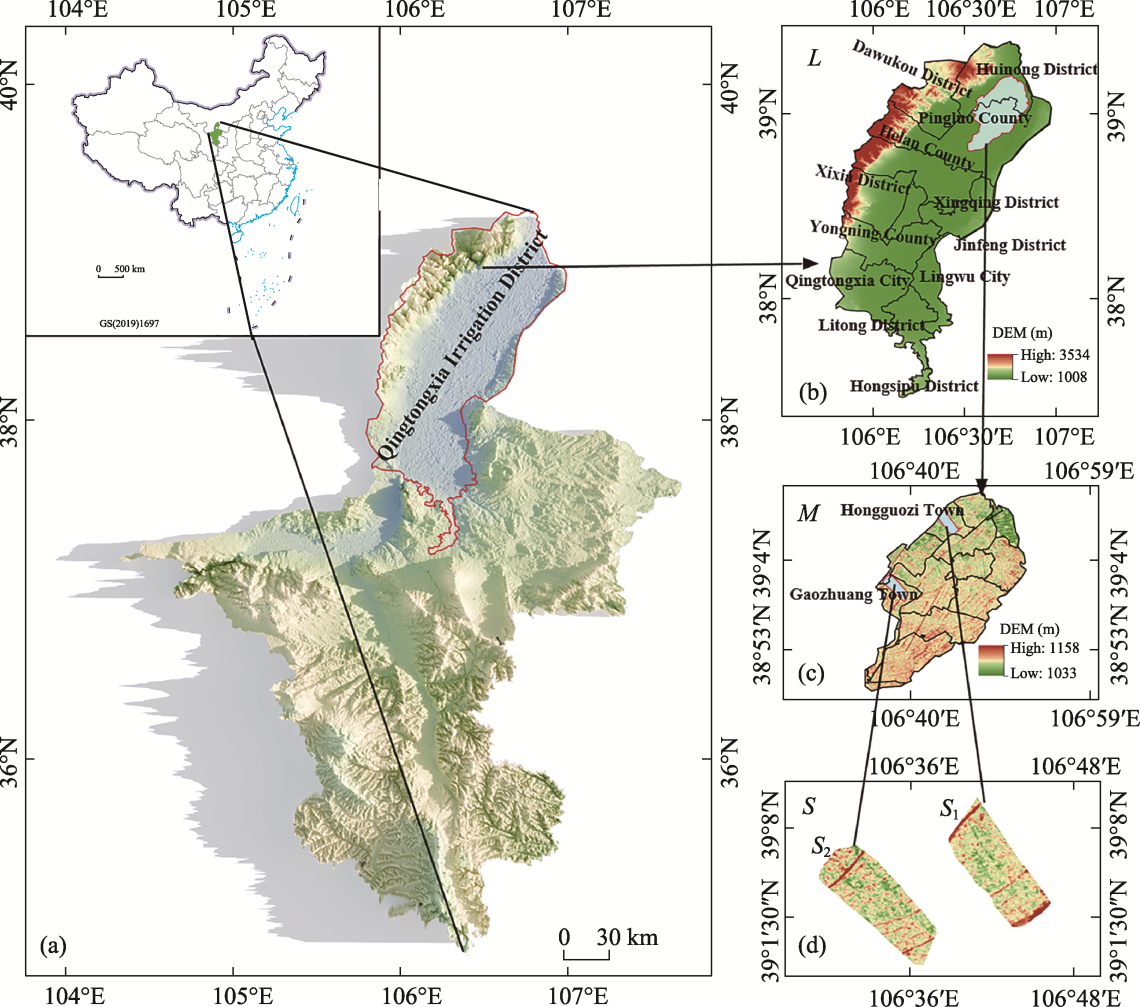
Figure 1
Location of Ningxia irrigation district (a: Ningxia; b: irrigation district; c: sub-irrigation district; d: landscape; L: large scale, which is irrigation district; M: medium scale, which is sub-irrigation district; S: small scale, which is landscape)
Table 1
Data main information and sources
Table 2
MRSEI calculation formula
Table 3
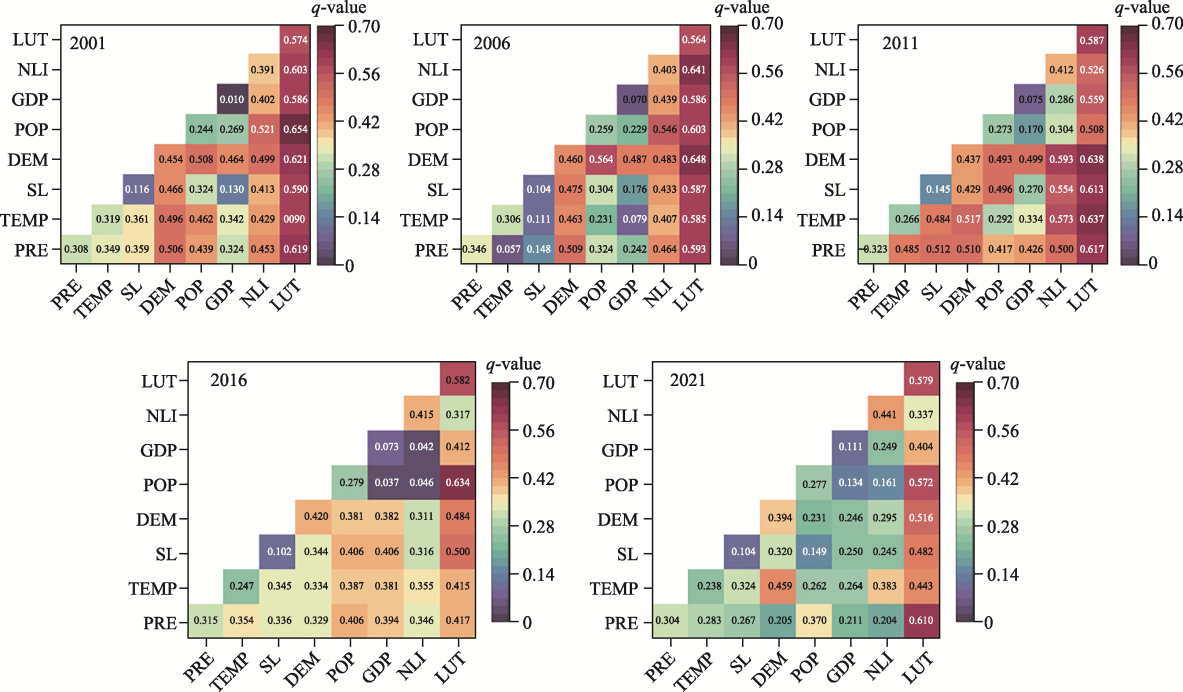
Results of factors interactions
Table 4
Load and contribution rate of the PC
l
in different years
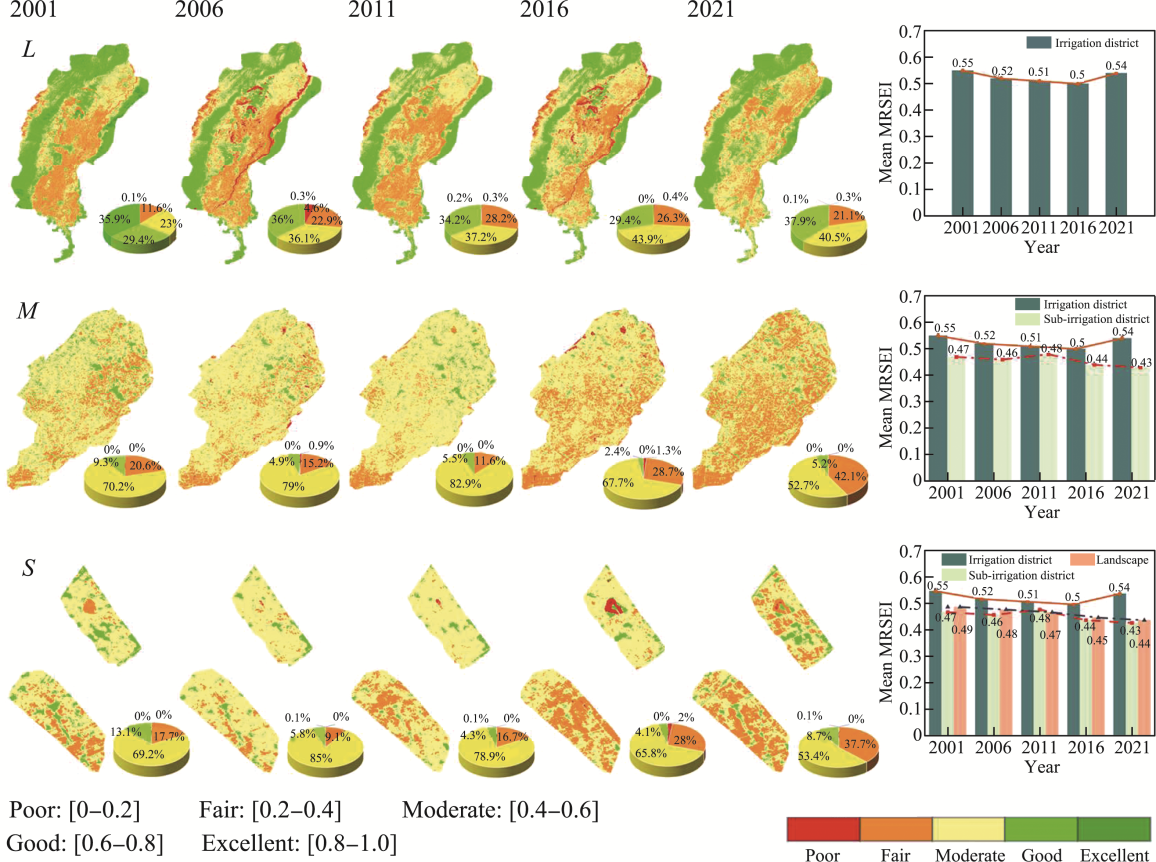
Figure 2
Classification of MRSEI index in Ningxia irrigation district of different scales (L, M and S are the same meaning in
Figure 1
.)
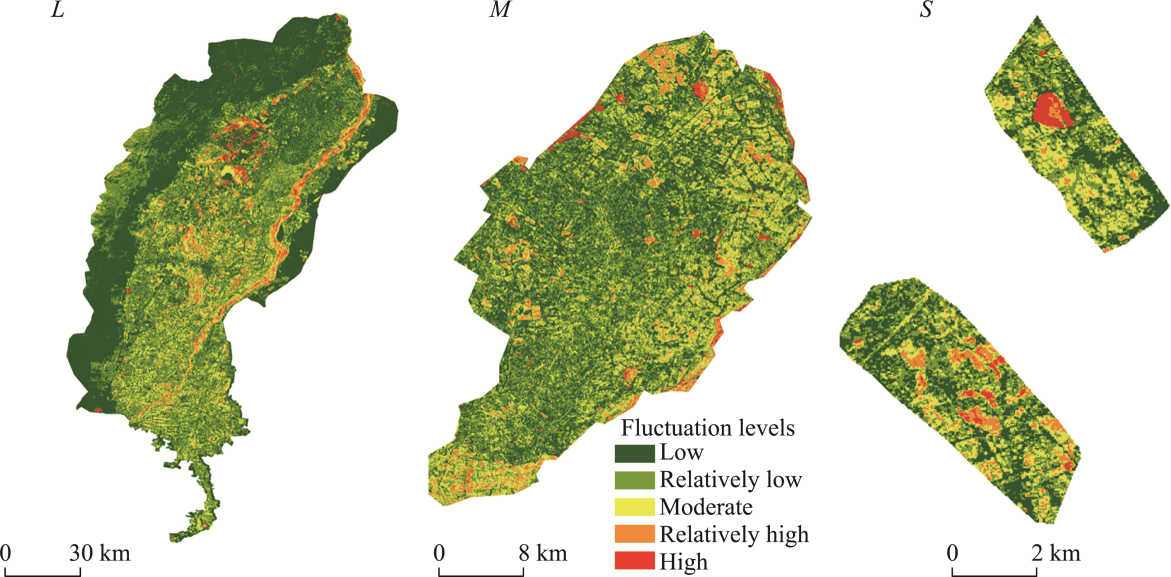
Figure 3
Variation and fluctuation levels of the MRSEI index across different spatial scales in Ningxia irrigation district (L, M and S are the same meaning in
Figure 2
.)
Figure 4
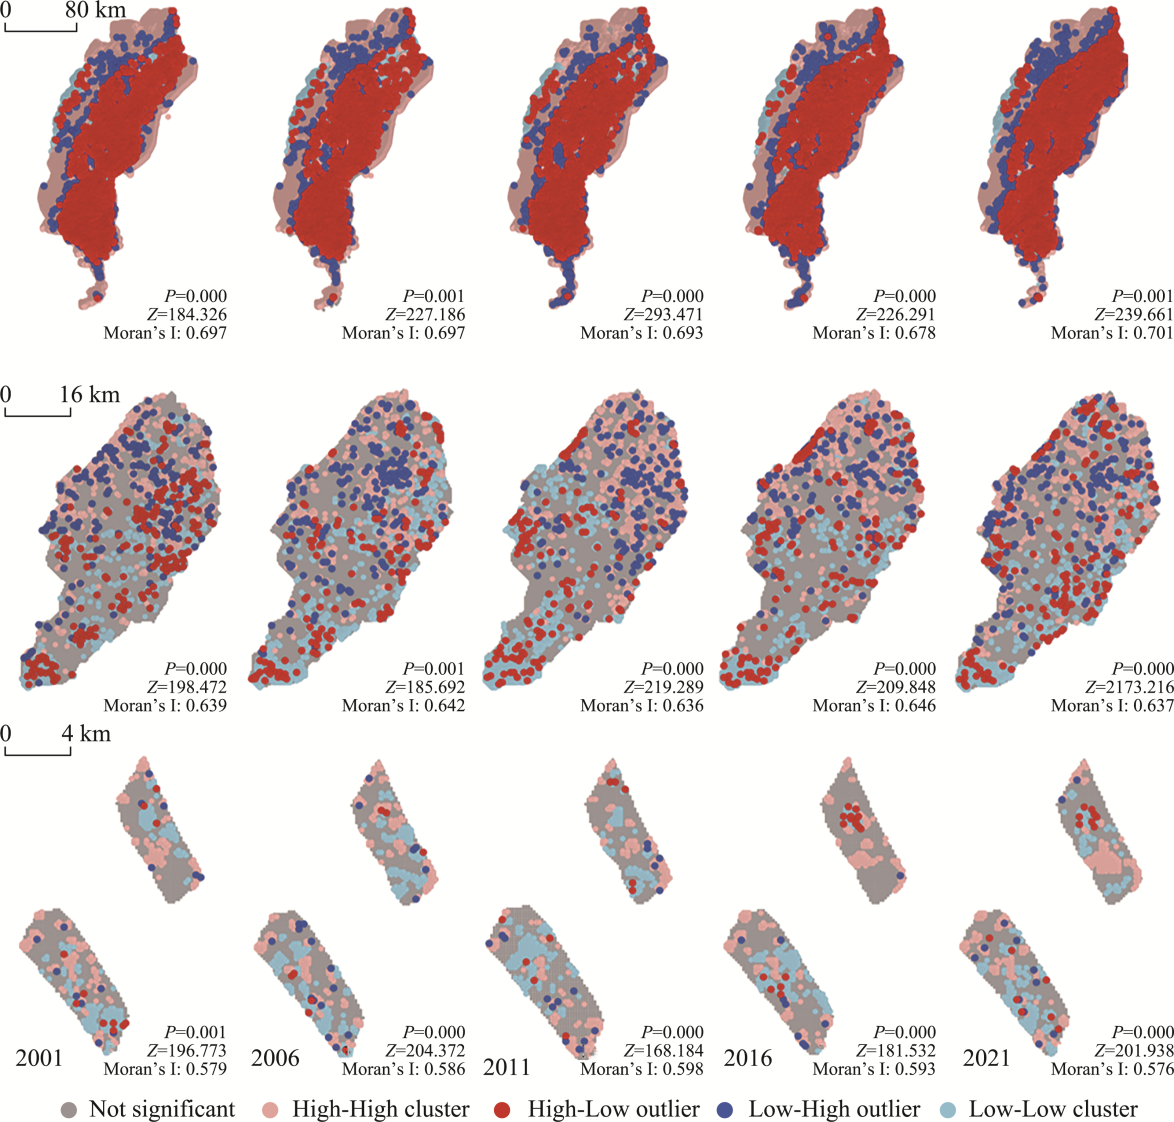
LISA clustering maps of MRSEI index in Ningxia irrigation district of different scales
Table 5
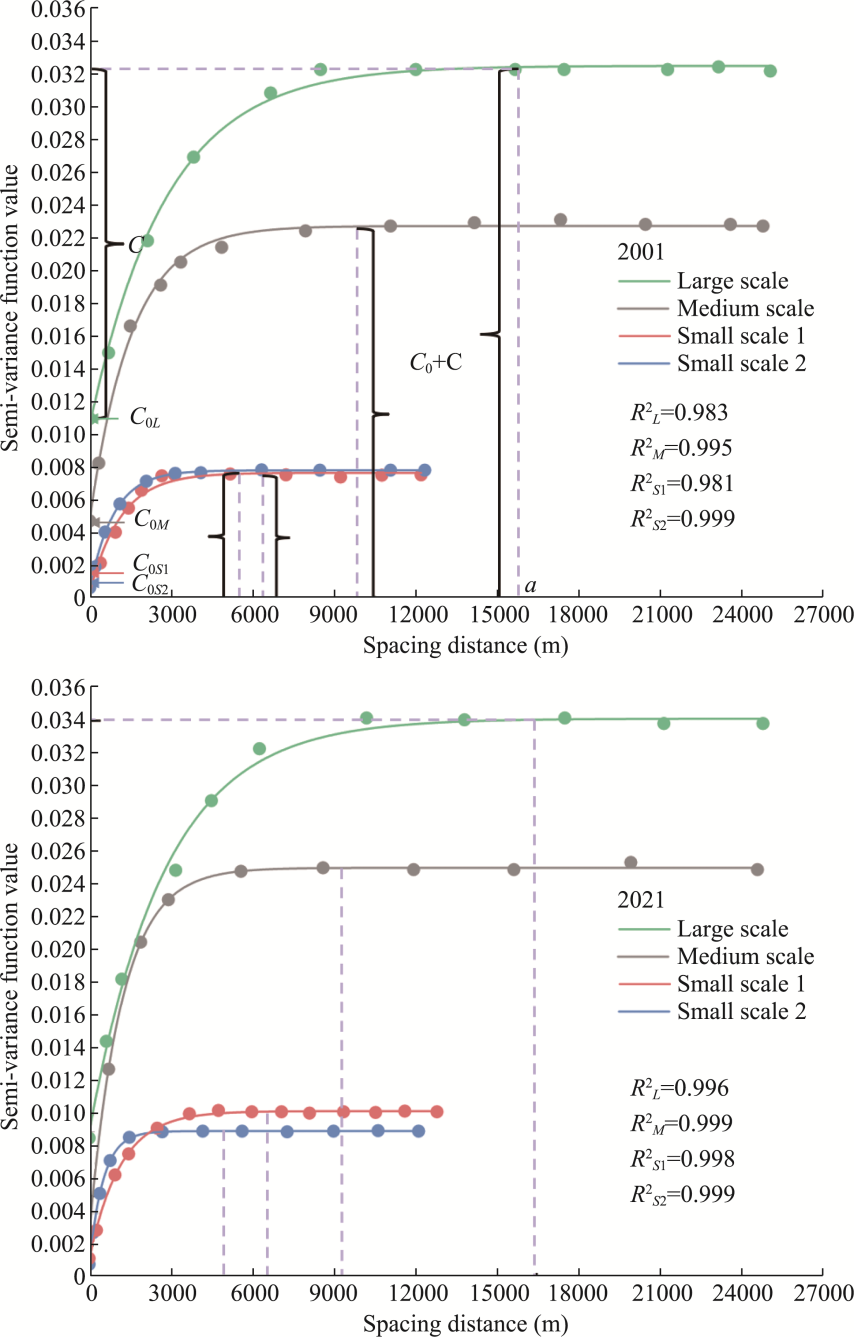
Theoretical models and their parameters for fitting semi-variance functions
Figure 5
Optimal fitting curves for semi-variational functions at each scale (L, M and S are the same meaning in
Figure 3
)
Table 6
Irrigation district scale ecological factor singleton detection results
Table 7
Irrigation district scale ecological factor singleton detection results
Table 8
Sub-irrigation district scale ecological factor singleton detection results
Figure 7
Results of the interactive detection of irrigation district driving factors
Figure 8
Results of the interactive detection of sub-irrigation district driving factors
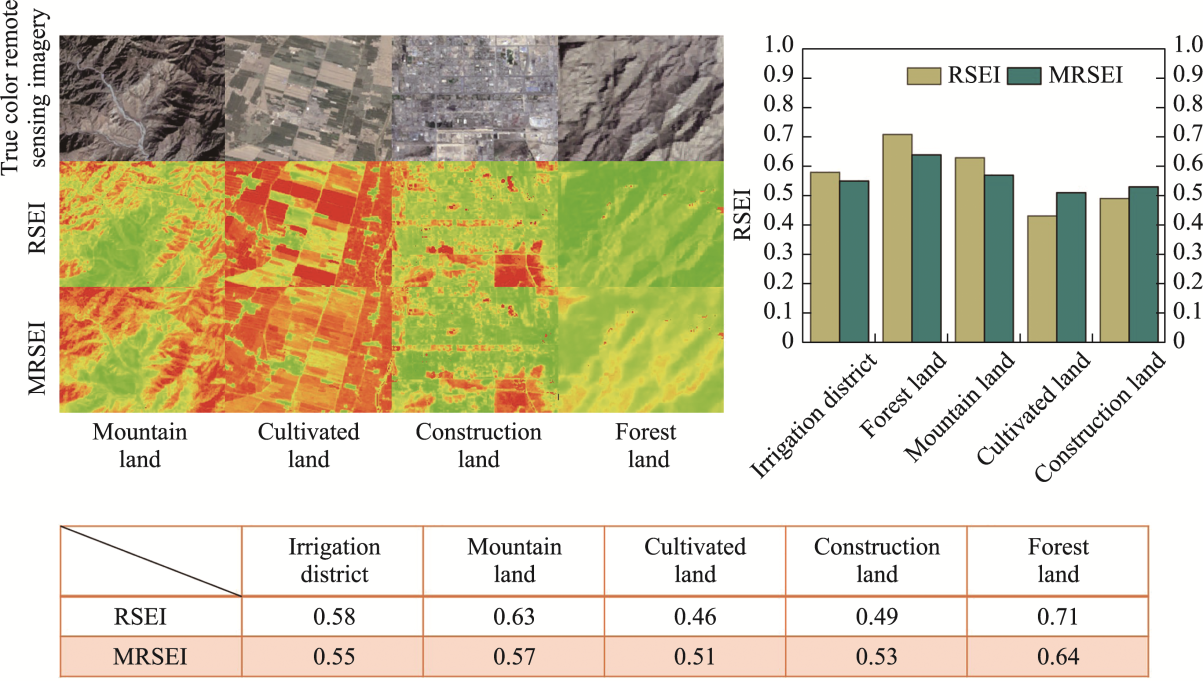
Figure 9
Local-scale detail comparison between MRSEI and RSEI
Figure 10
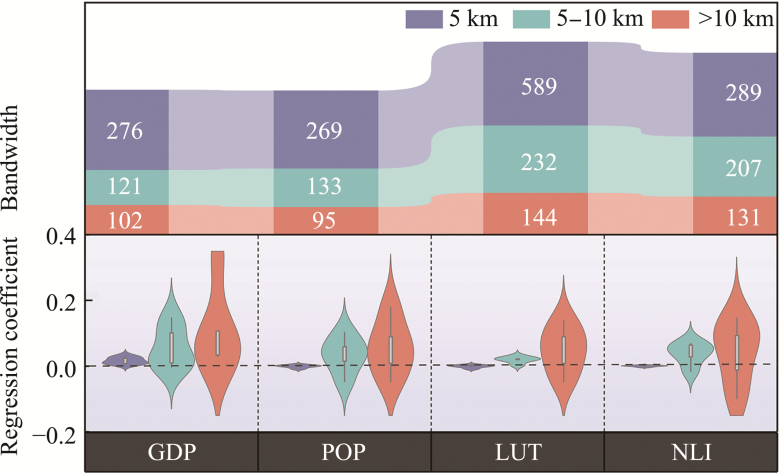
MGWR regression coefficients
Figure 11
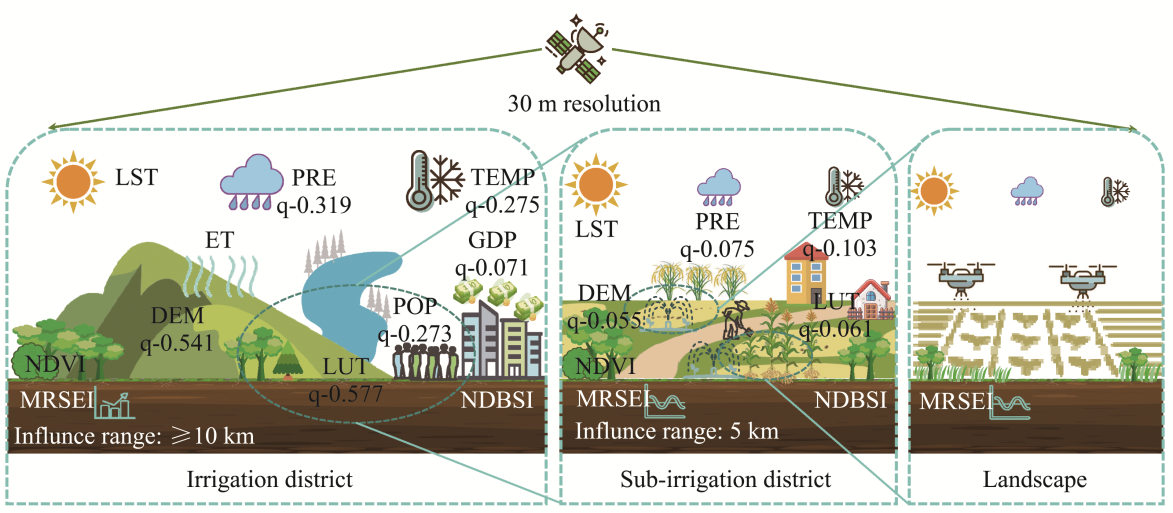
Diagram of driving process on ecological quality at different scales (L, M and S are the same meaning in
Figure 5
; NDVI: normalized difference vegetation index; ET: evapotranspiration; LST: land surface temperature; NDBSI: normalized difference built-up and soil index; PRE: precipitation; TEMP: temperature; LUT: land use type; GDP: gross domestic product; DEM: digital elevation model; POP: population)