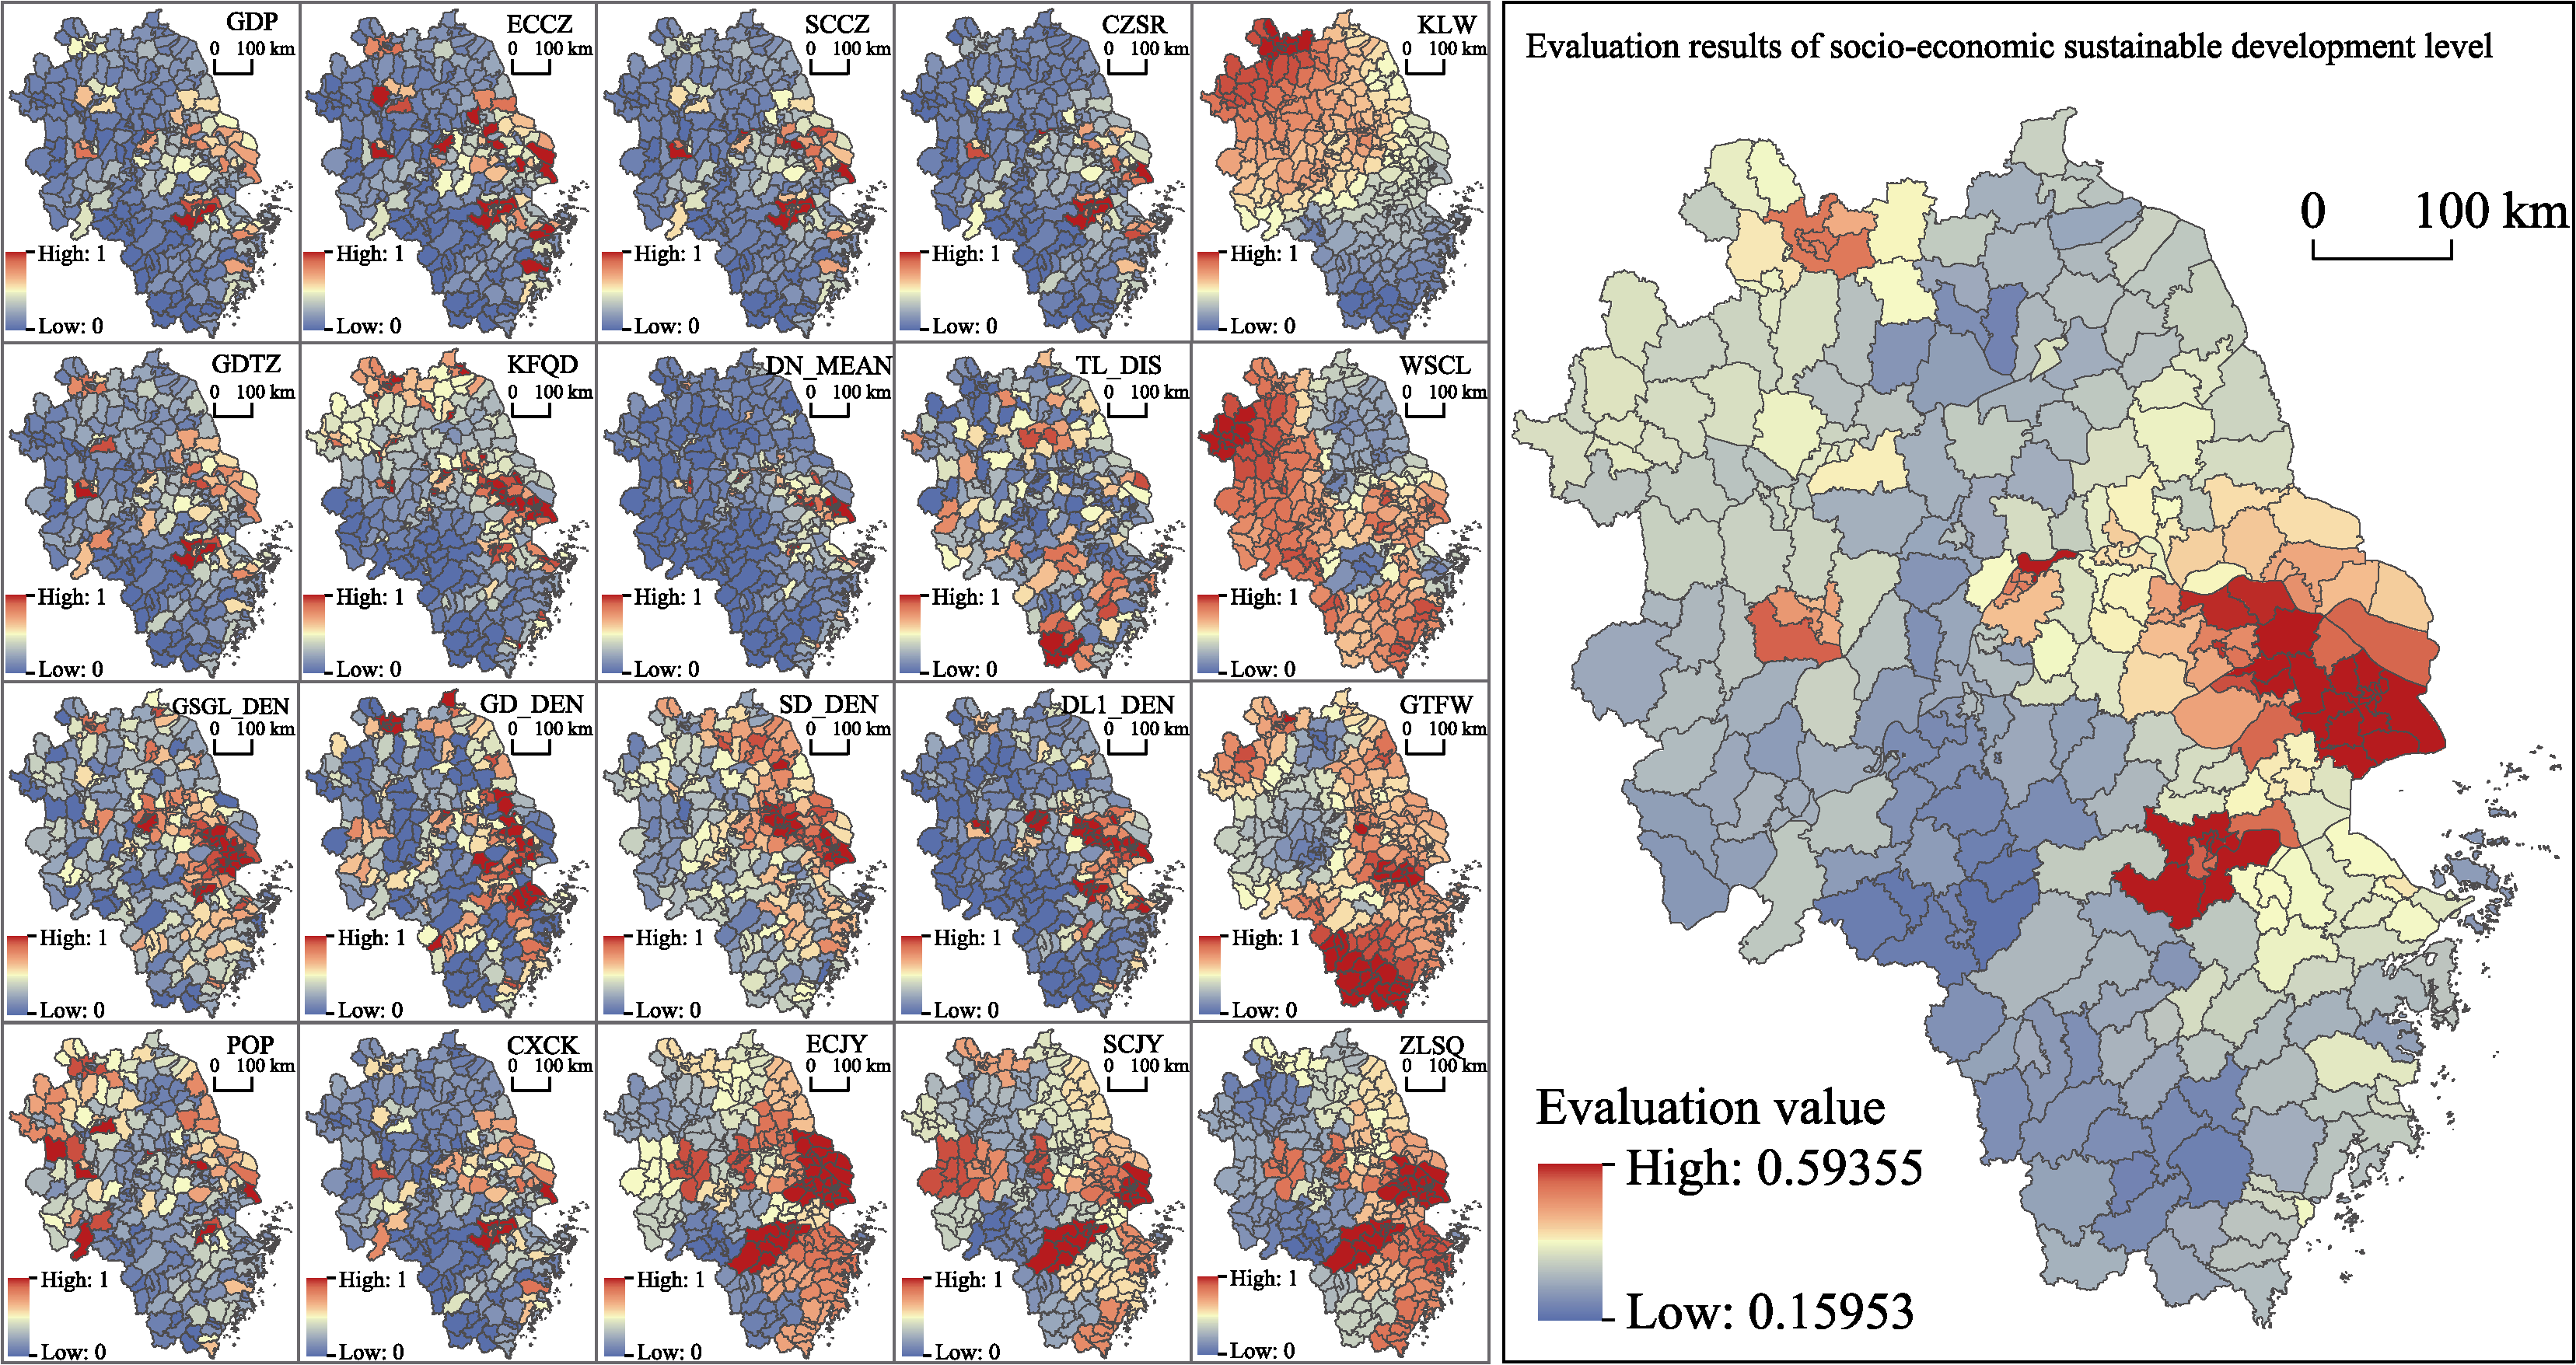
| Indicators | Weight assignment results calculated using CRITICS method (W1) | Weight assignment results calculated using entropy weight method (W2) | Weight assignment results calculated using CRITIC-entropy weight method (WT) |
|---|---|---|---|
| Gross domestic product (GDP) | 0.0082 | 0.0610 | 0.0346 |
| Output value of secondary industry (ECCZ) | 0.0156 | 0.0750 | 0.0453 |
| Output value of tertiary industry (SCCZ) | 0.0121 | 0.0495 | 0.0308 |
| Development intensity of construction land (KFQD) | 0.0633 | 0.0361 | 0.0497 |
| DN mean value of nighttime lighting data (DN) | 0.1030 | 0.0779 | 0.0904 |
| Financial revenue (CZSR) | 0.0124 | 0.0603 | 0.0364 |
| Investment in fixed assets (GDTZ) | 0.0188 | 0.0704 | 0.0446 |
| Distance to railway (TL_DIS) | 0.1077 | 0.0242 | 0.0660 |
| Highway network density (GSGL_DEN) | 0.0281 | 0.0206 | 0.0244 |
| National road network density (GD_DEN) | 0.0368 | 0.0588 | 0.0478 |
| Provincial road network density (SD_DEN) | 0.0526 | 0.0429 | 0.0477 |
| Network density of urban first-class roads (DL1_DEN) | 0.0259 | 0.0468 | 0.0364 |
| Total registered population (HJRK) | 0.0406 | 0.0340 | 0.0373 |
| Year-end balance of saving deposit of urban and rural residents (CXCK) | 0.0176 | 0.0551 | 0.0364 |
| Employees of urban institutions in the secondary industry (ECJY) | 0.0428 | 0.0625 | 0.0526 |
| Employees of urban institutions in the tertiary industry (SCJY) | 0.0494 | 0.0293 | 0.0394 |
| Annual average concentration of inhalable fine particles (KLW) | 0.1197 | 0.0611 | 0.0904 |
| Centralized treatment rate of sewage treatment plant (WSCL) | 0.1206 | 0.0248 | 0.0727 |
| Comprehensive utilization rate of industrial solid waste (GTFW) | 0.0896 | 0.0581 | 0.0739 |
| Patent authorization (ZLSQ) | 0.0354 | 0.0513 | 0.0434 |