×
模态框(Modal)标题
在这里添加一些文本
关闭
关闭
提交更改
取消
确定并提交
×
模态框(Modal)标题
×
期刊
文章
图表
检索
EN
中文
首页
关于期刊
期刊介绍
数据库收录
期刊荣誉
编委会
投稿指南
在线期刊
当期目录
优先出版
过刊浏览
推荐文章
专题
按栏目浏览
阅读排行
下载排行
引用排行
E-mail Alert
RSS
期刊订阅
广告合作
联系我们
EN
中文
图/表 详细信息
Multi-objective spatial optimization by considering land use suitability in the Yangtze River Delta region
CHENG Qianwen, LI Manchun, LI Feixue, LIN Yukun, DING Chenyin, XIAO Lishan, LI Weiyue
地理学报(英文版), 2026, 36(
1
): 45-78. DOI:
10.1007/s11442-026-2438-4
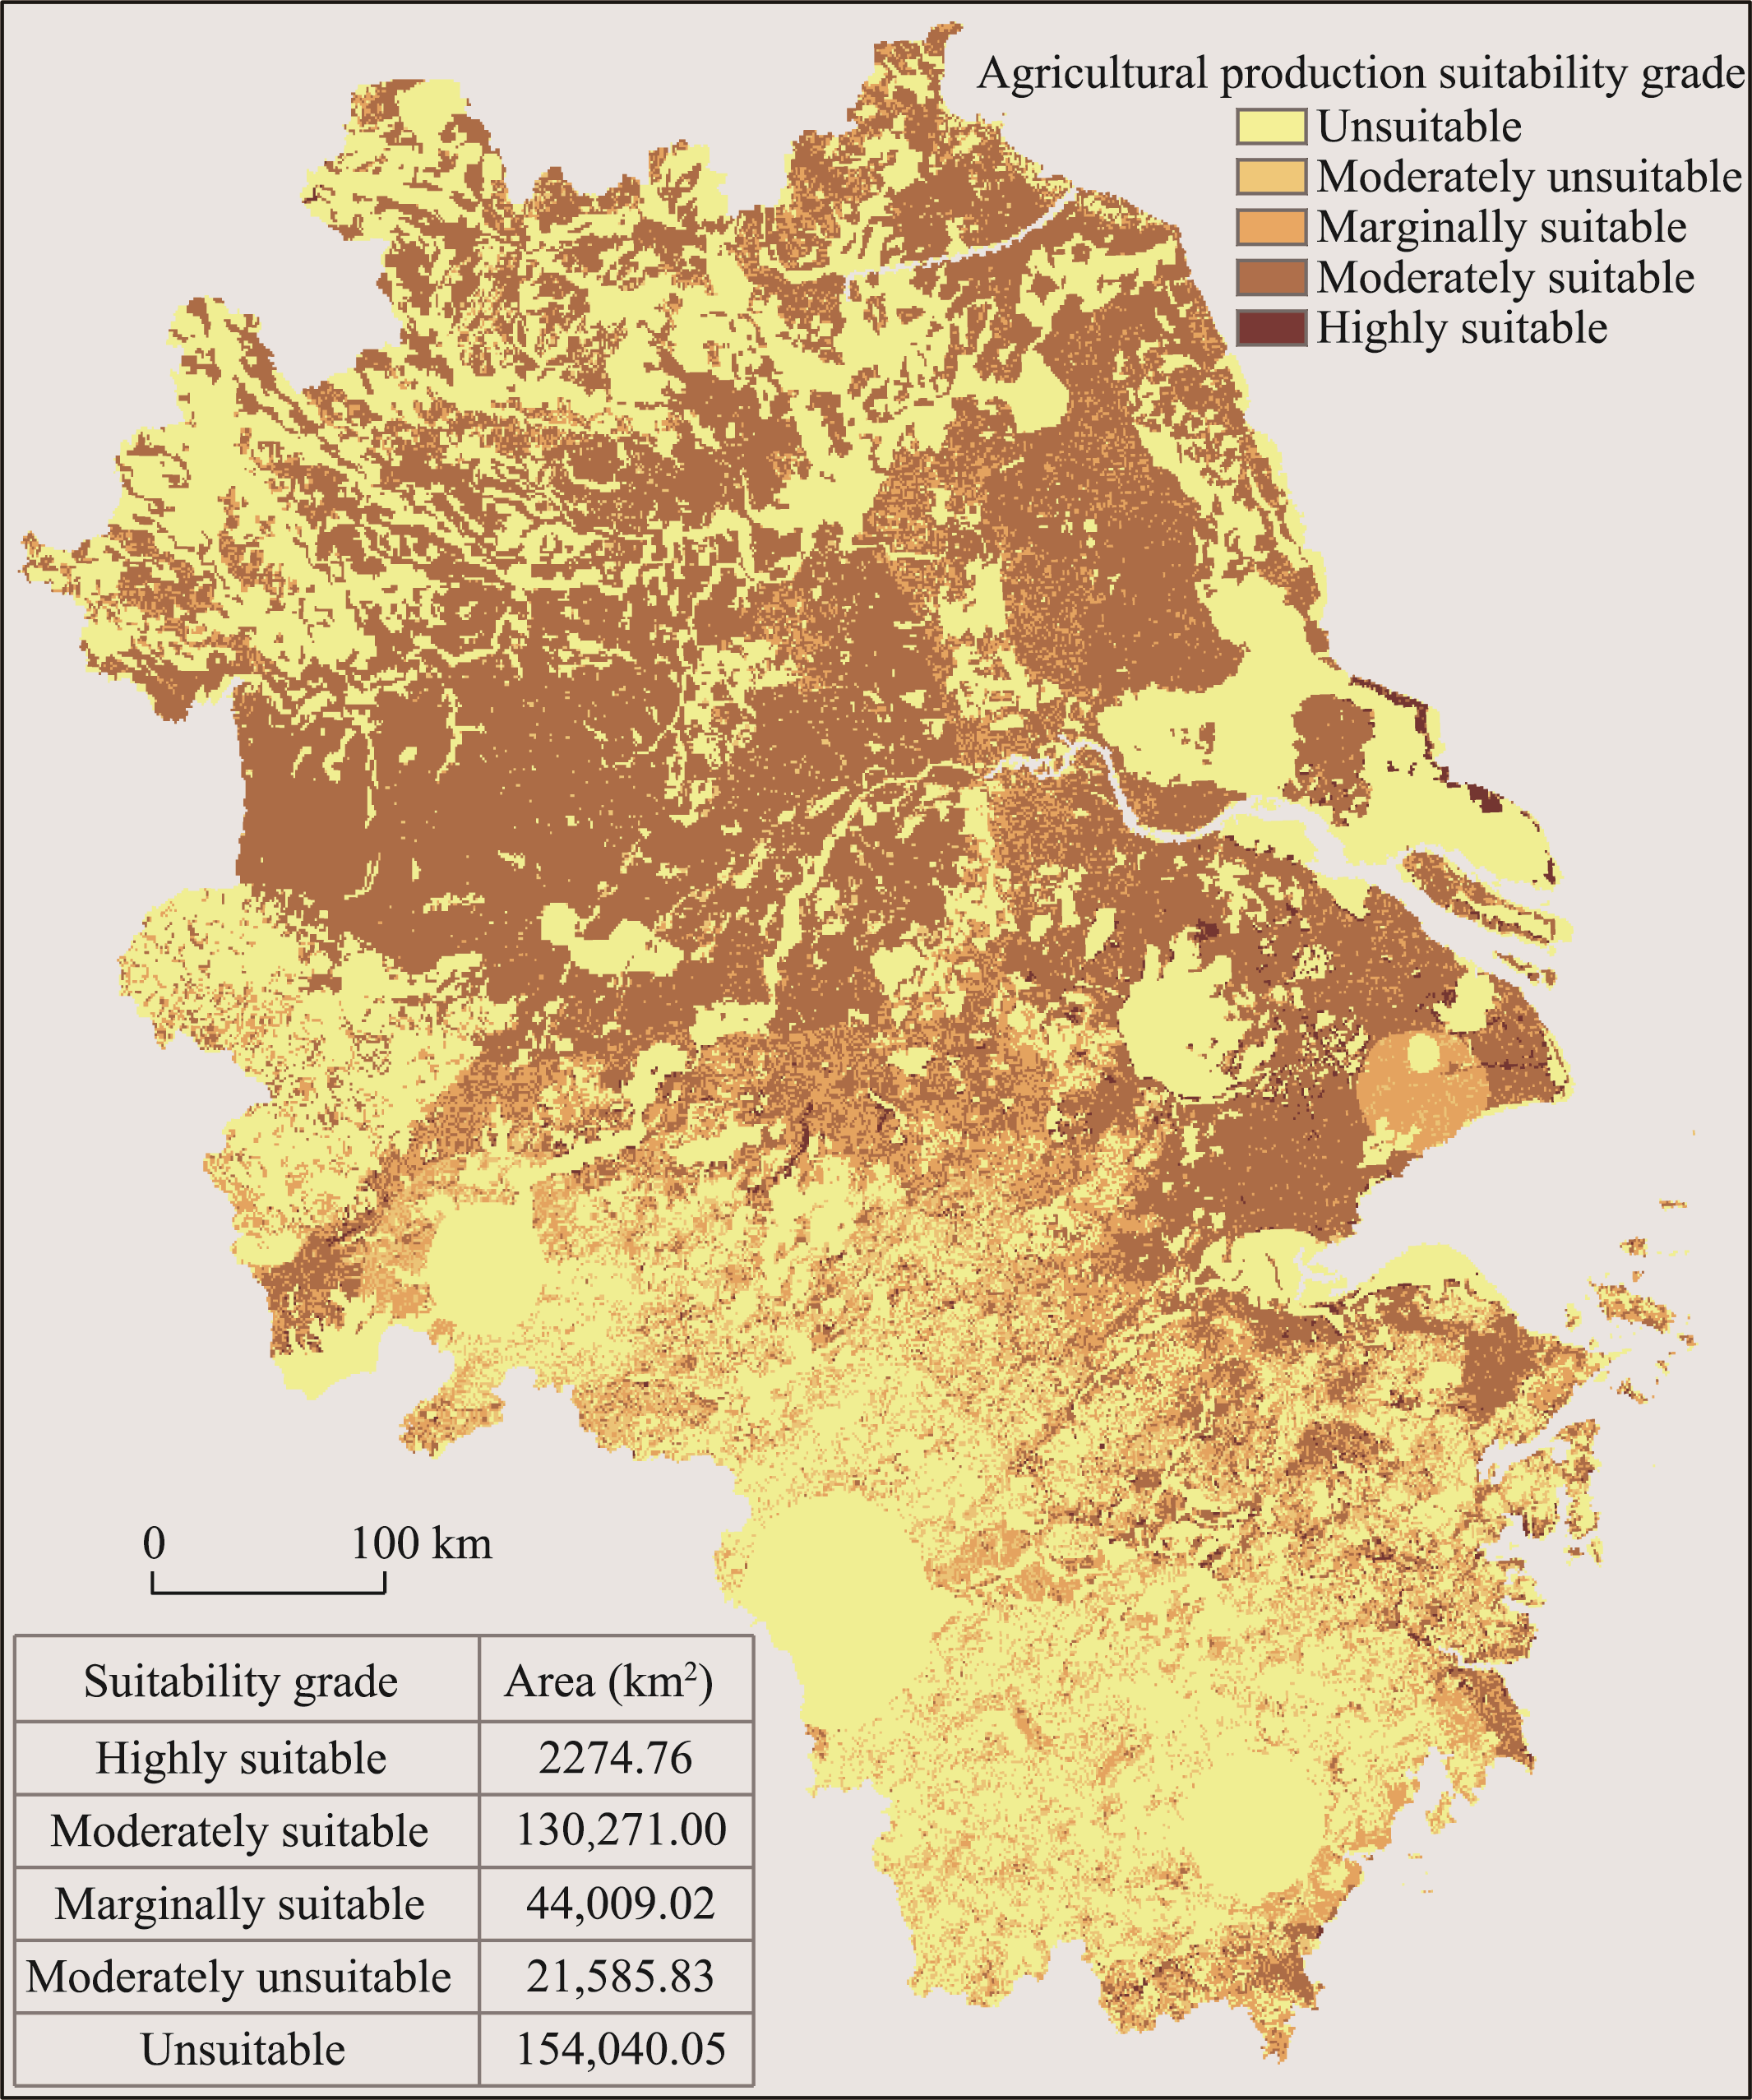
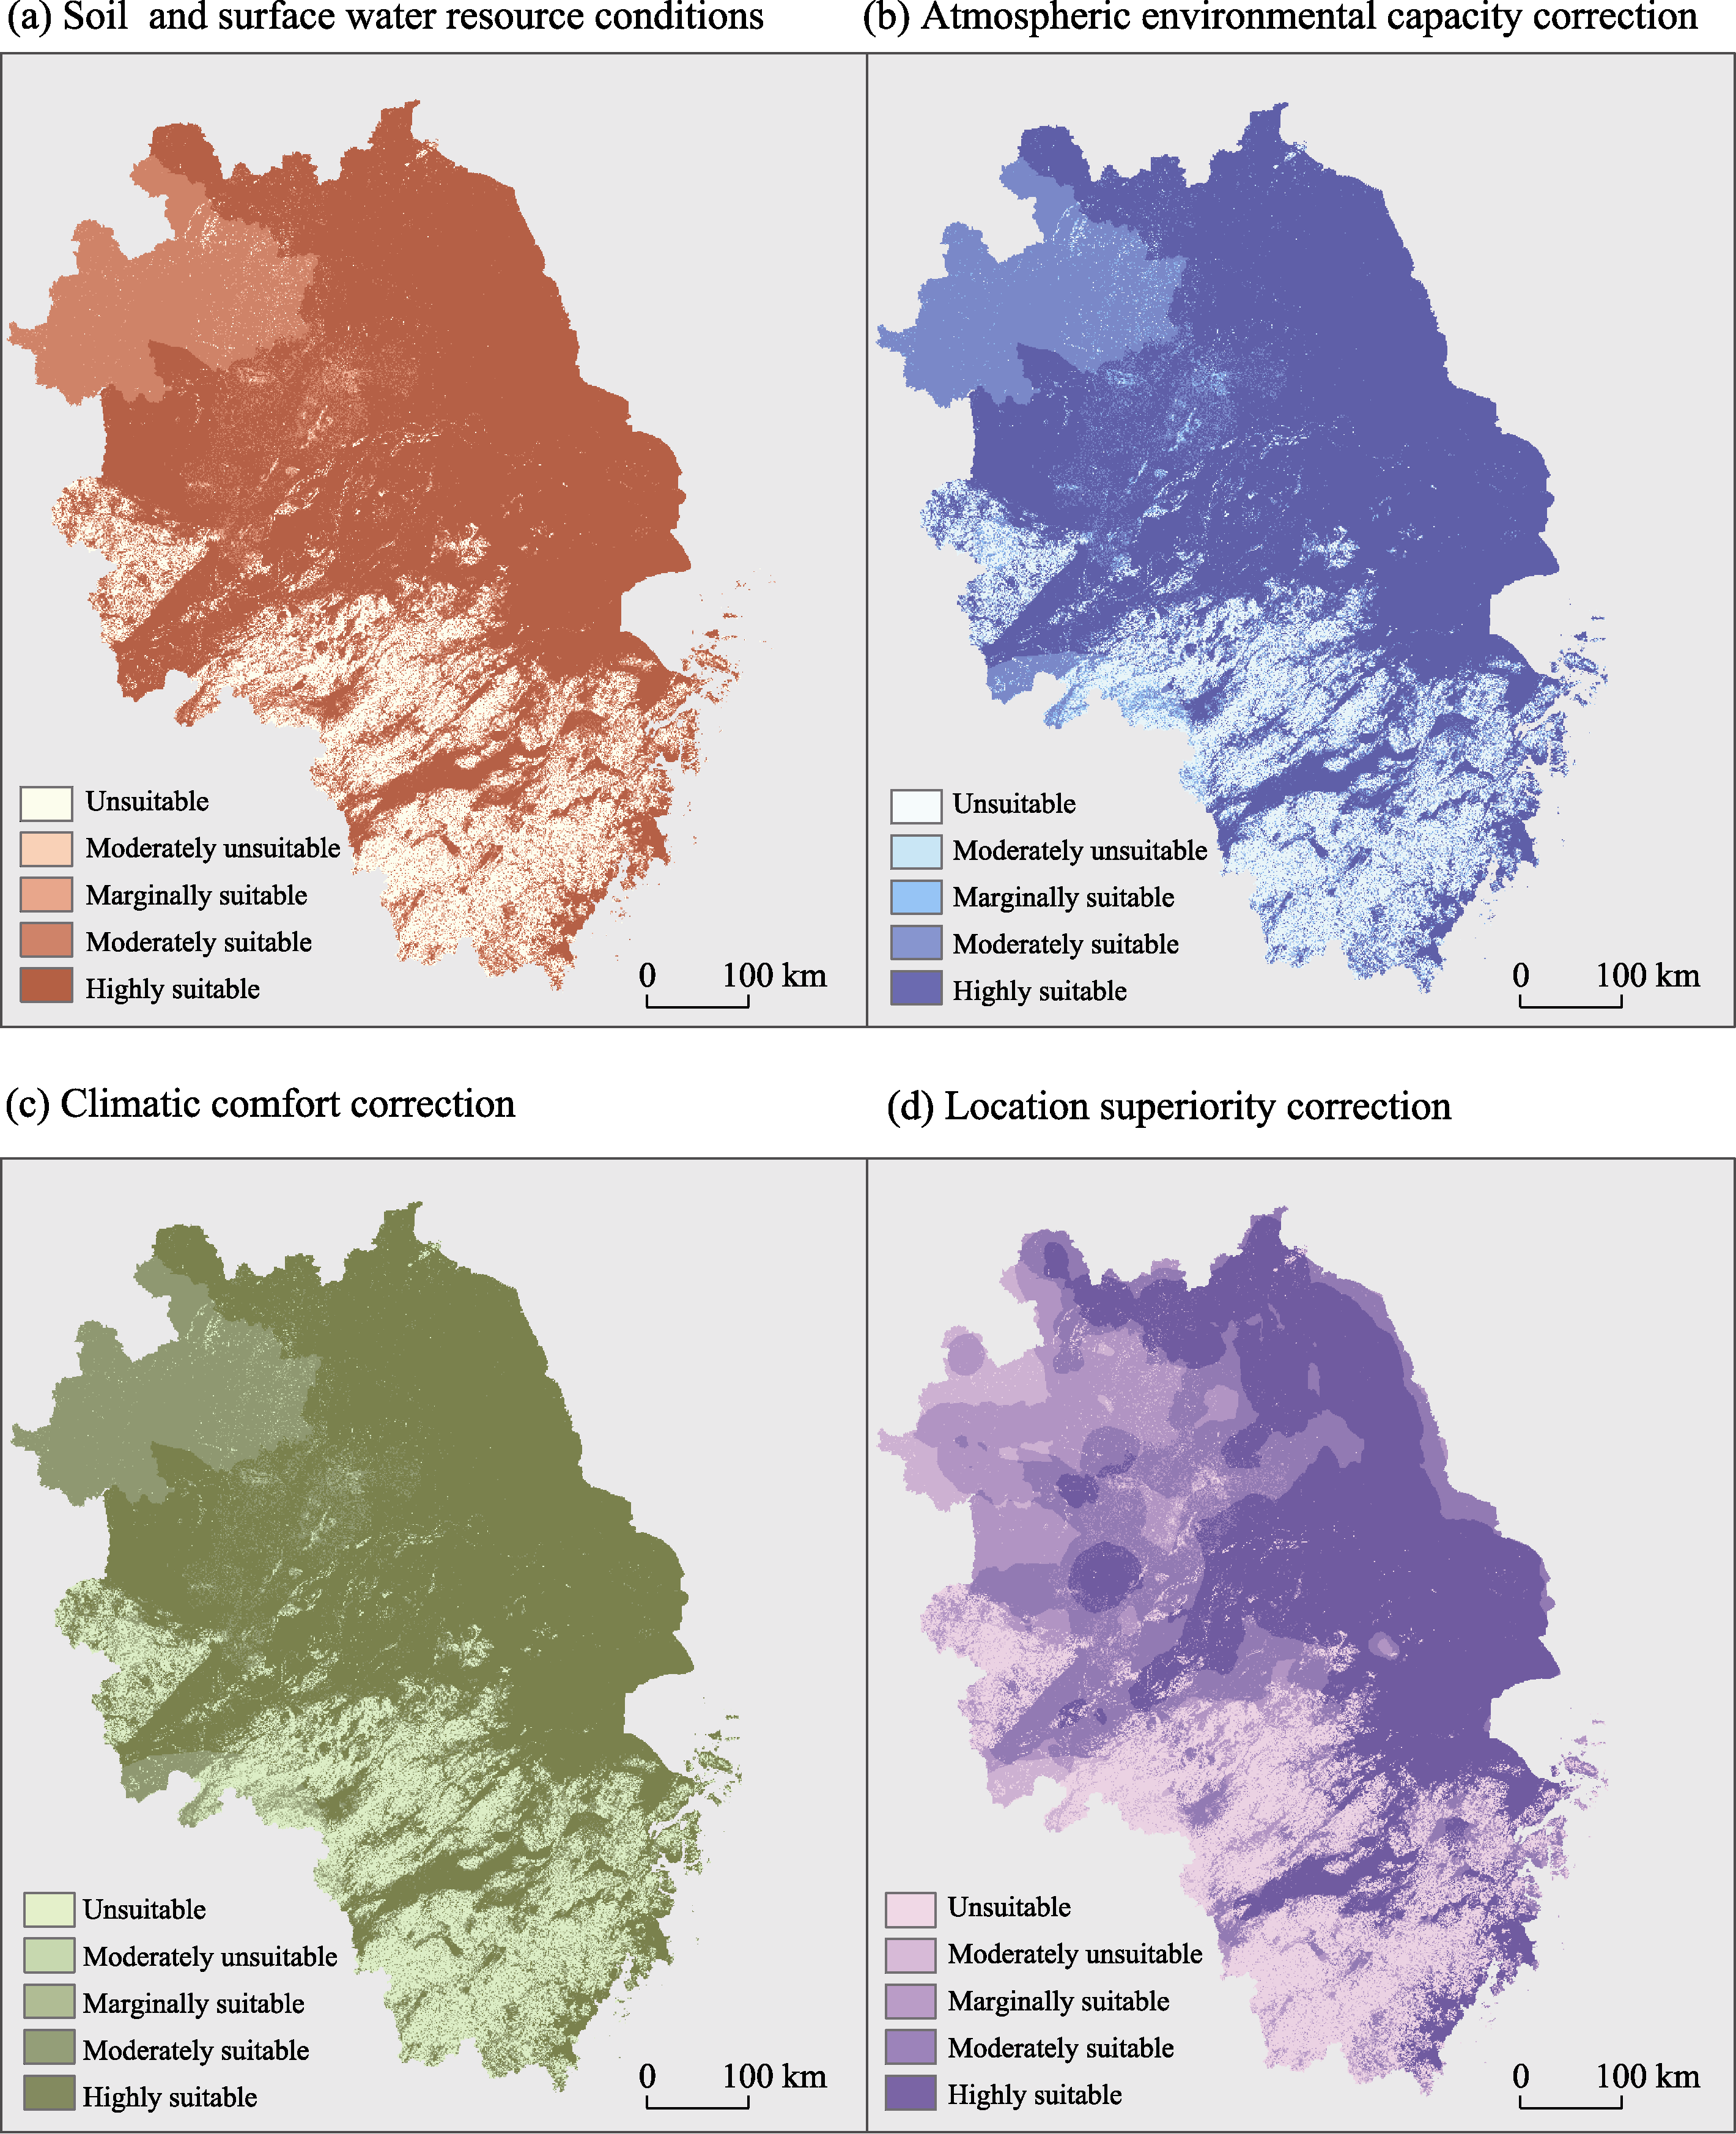
Figure 9
Result of the evaluation of agricultural production suitability in the Yangtze River Delta region
本文的其它图/表
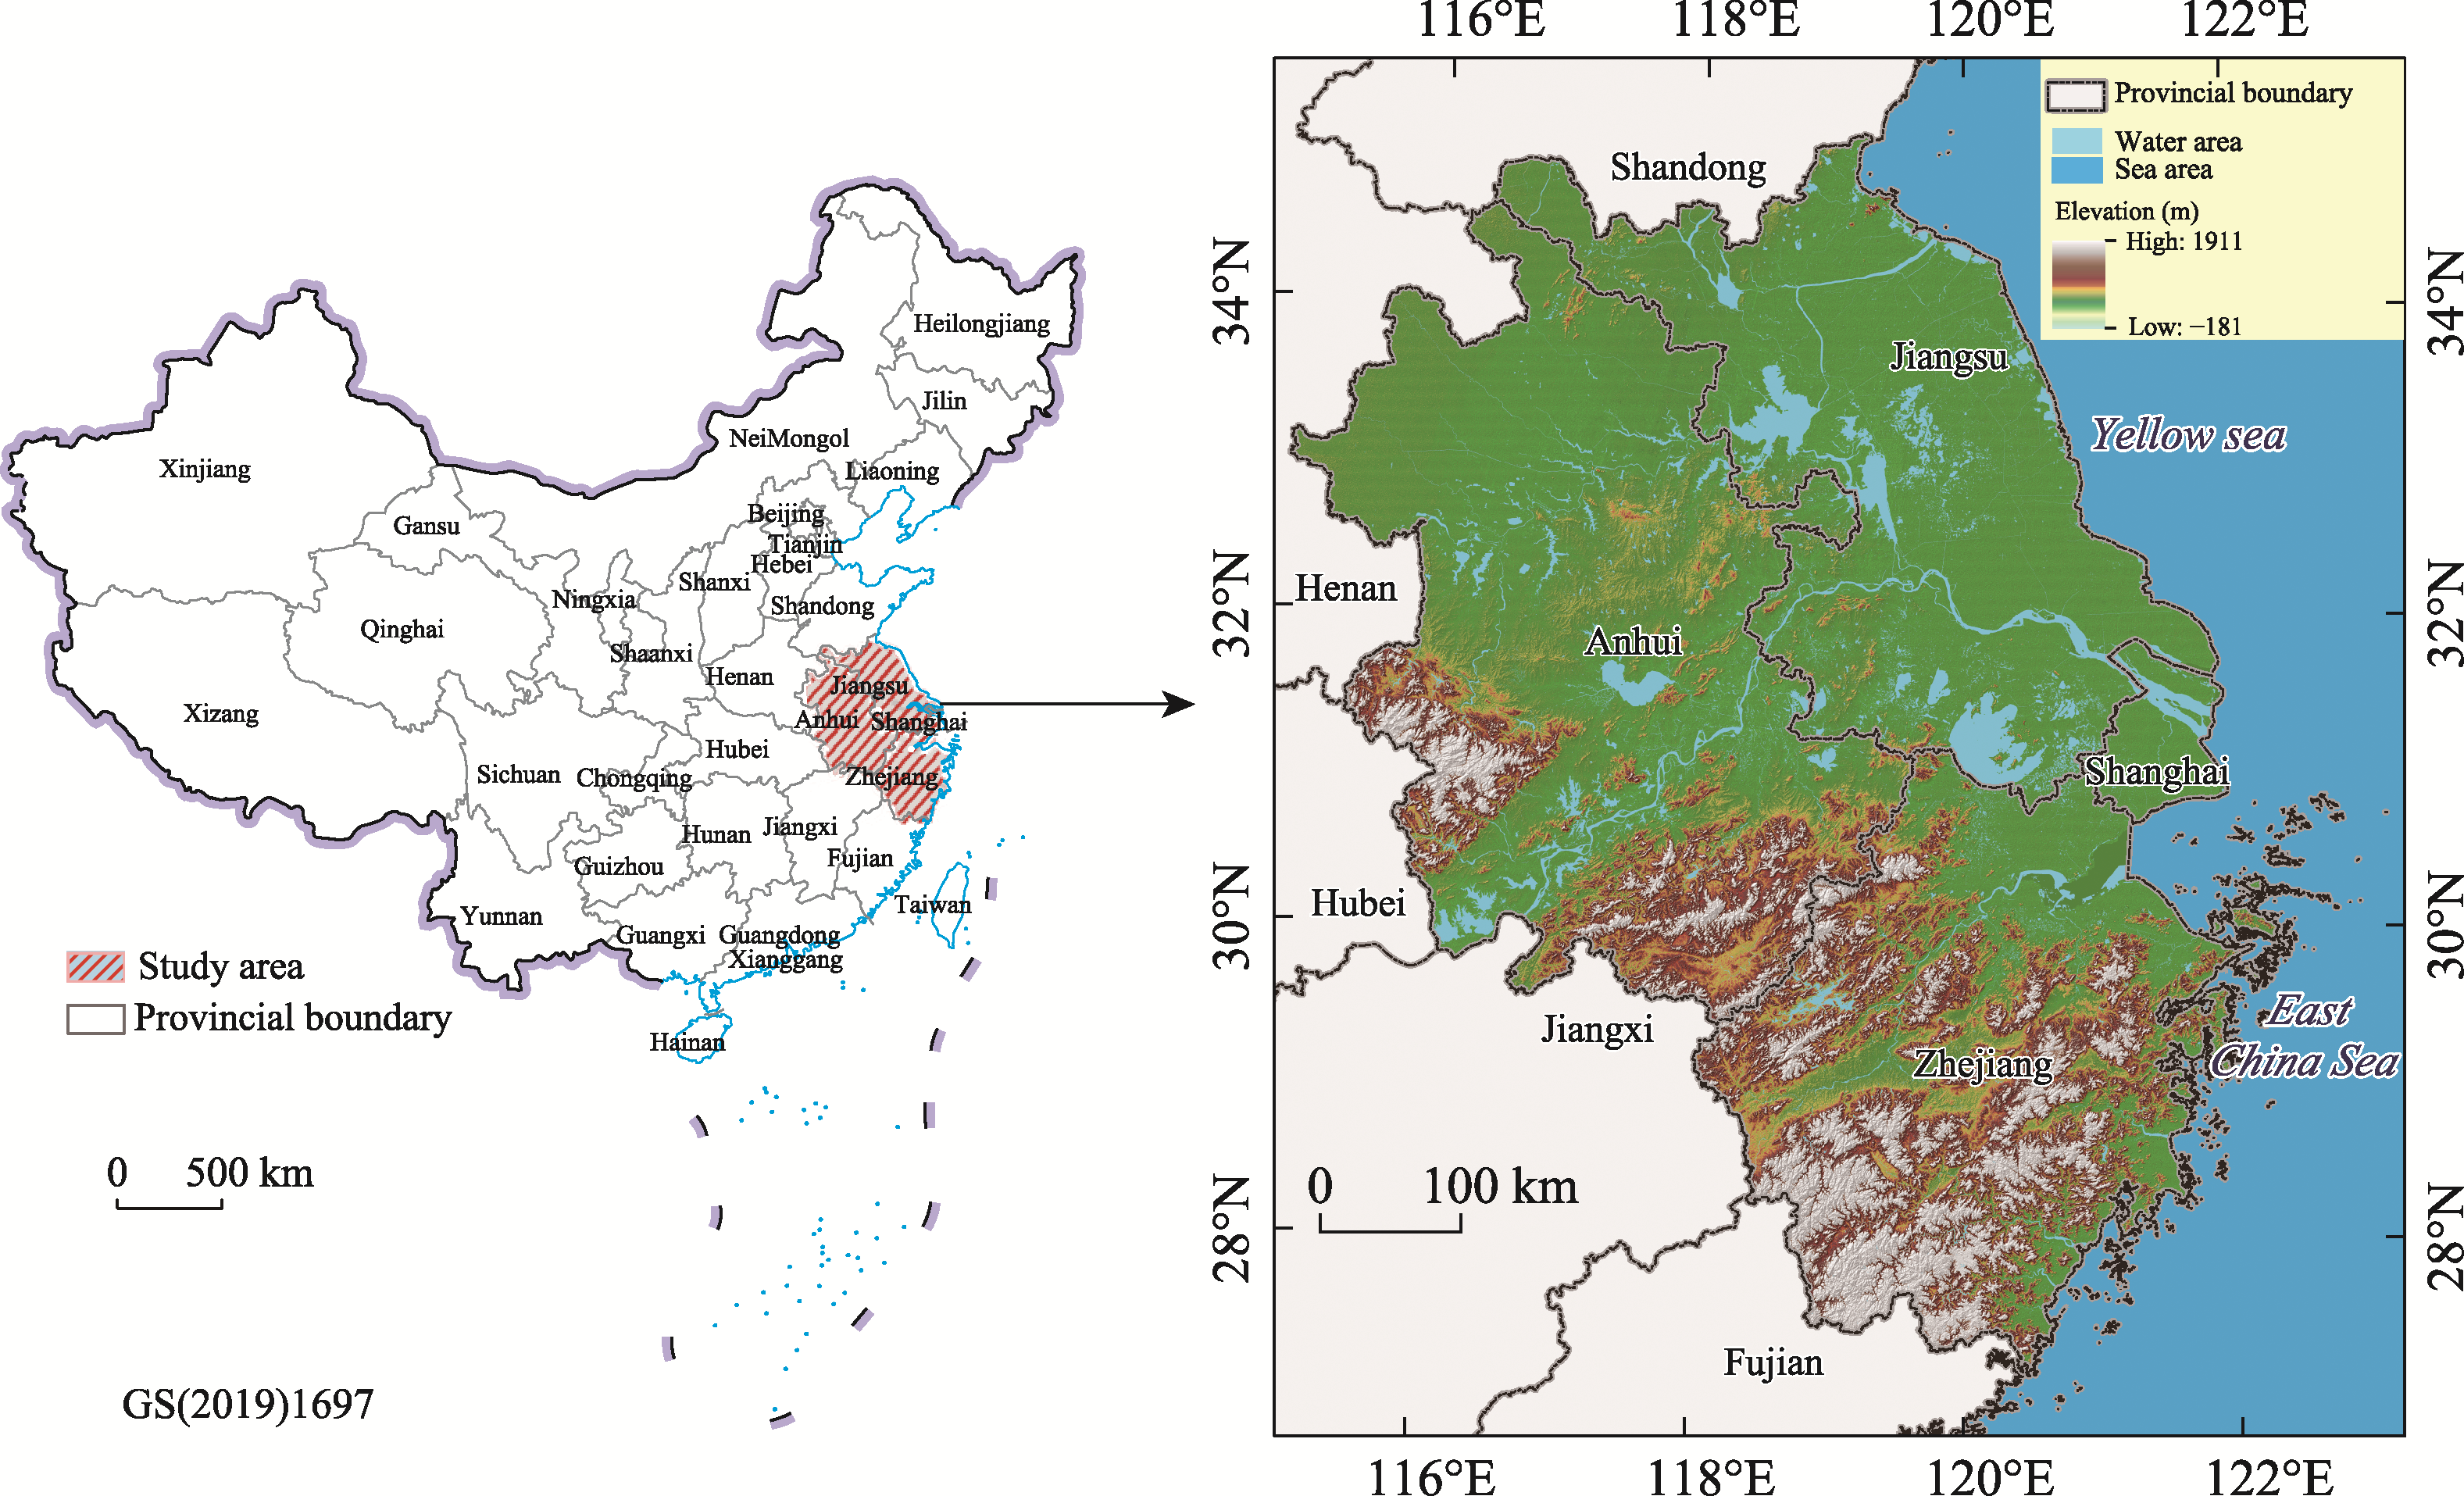
Figure 1
Location of the study area (Yangtze River Delta region)
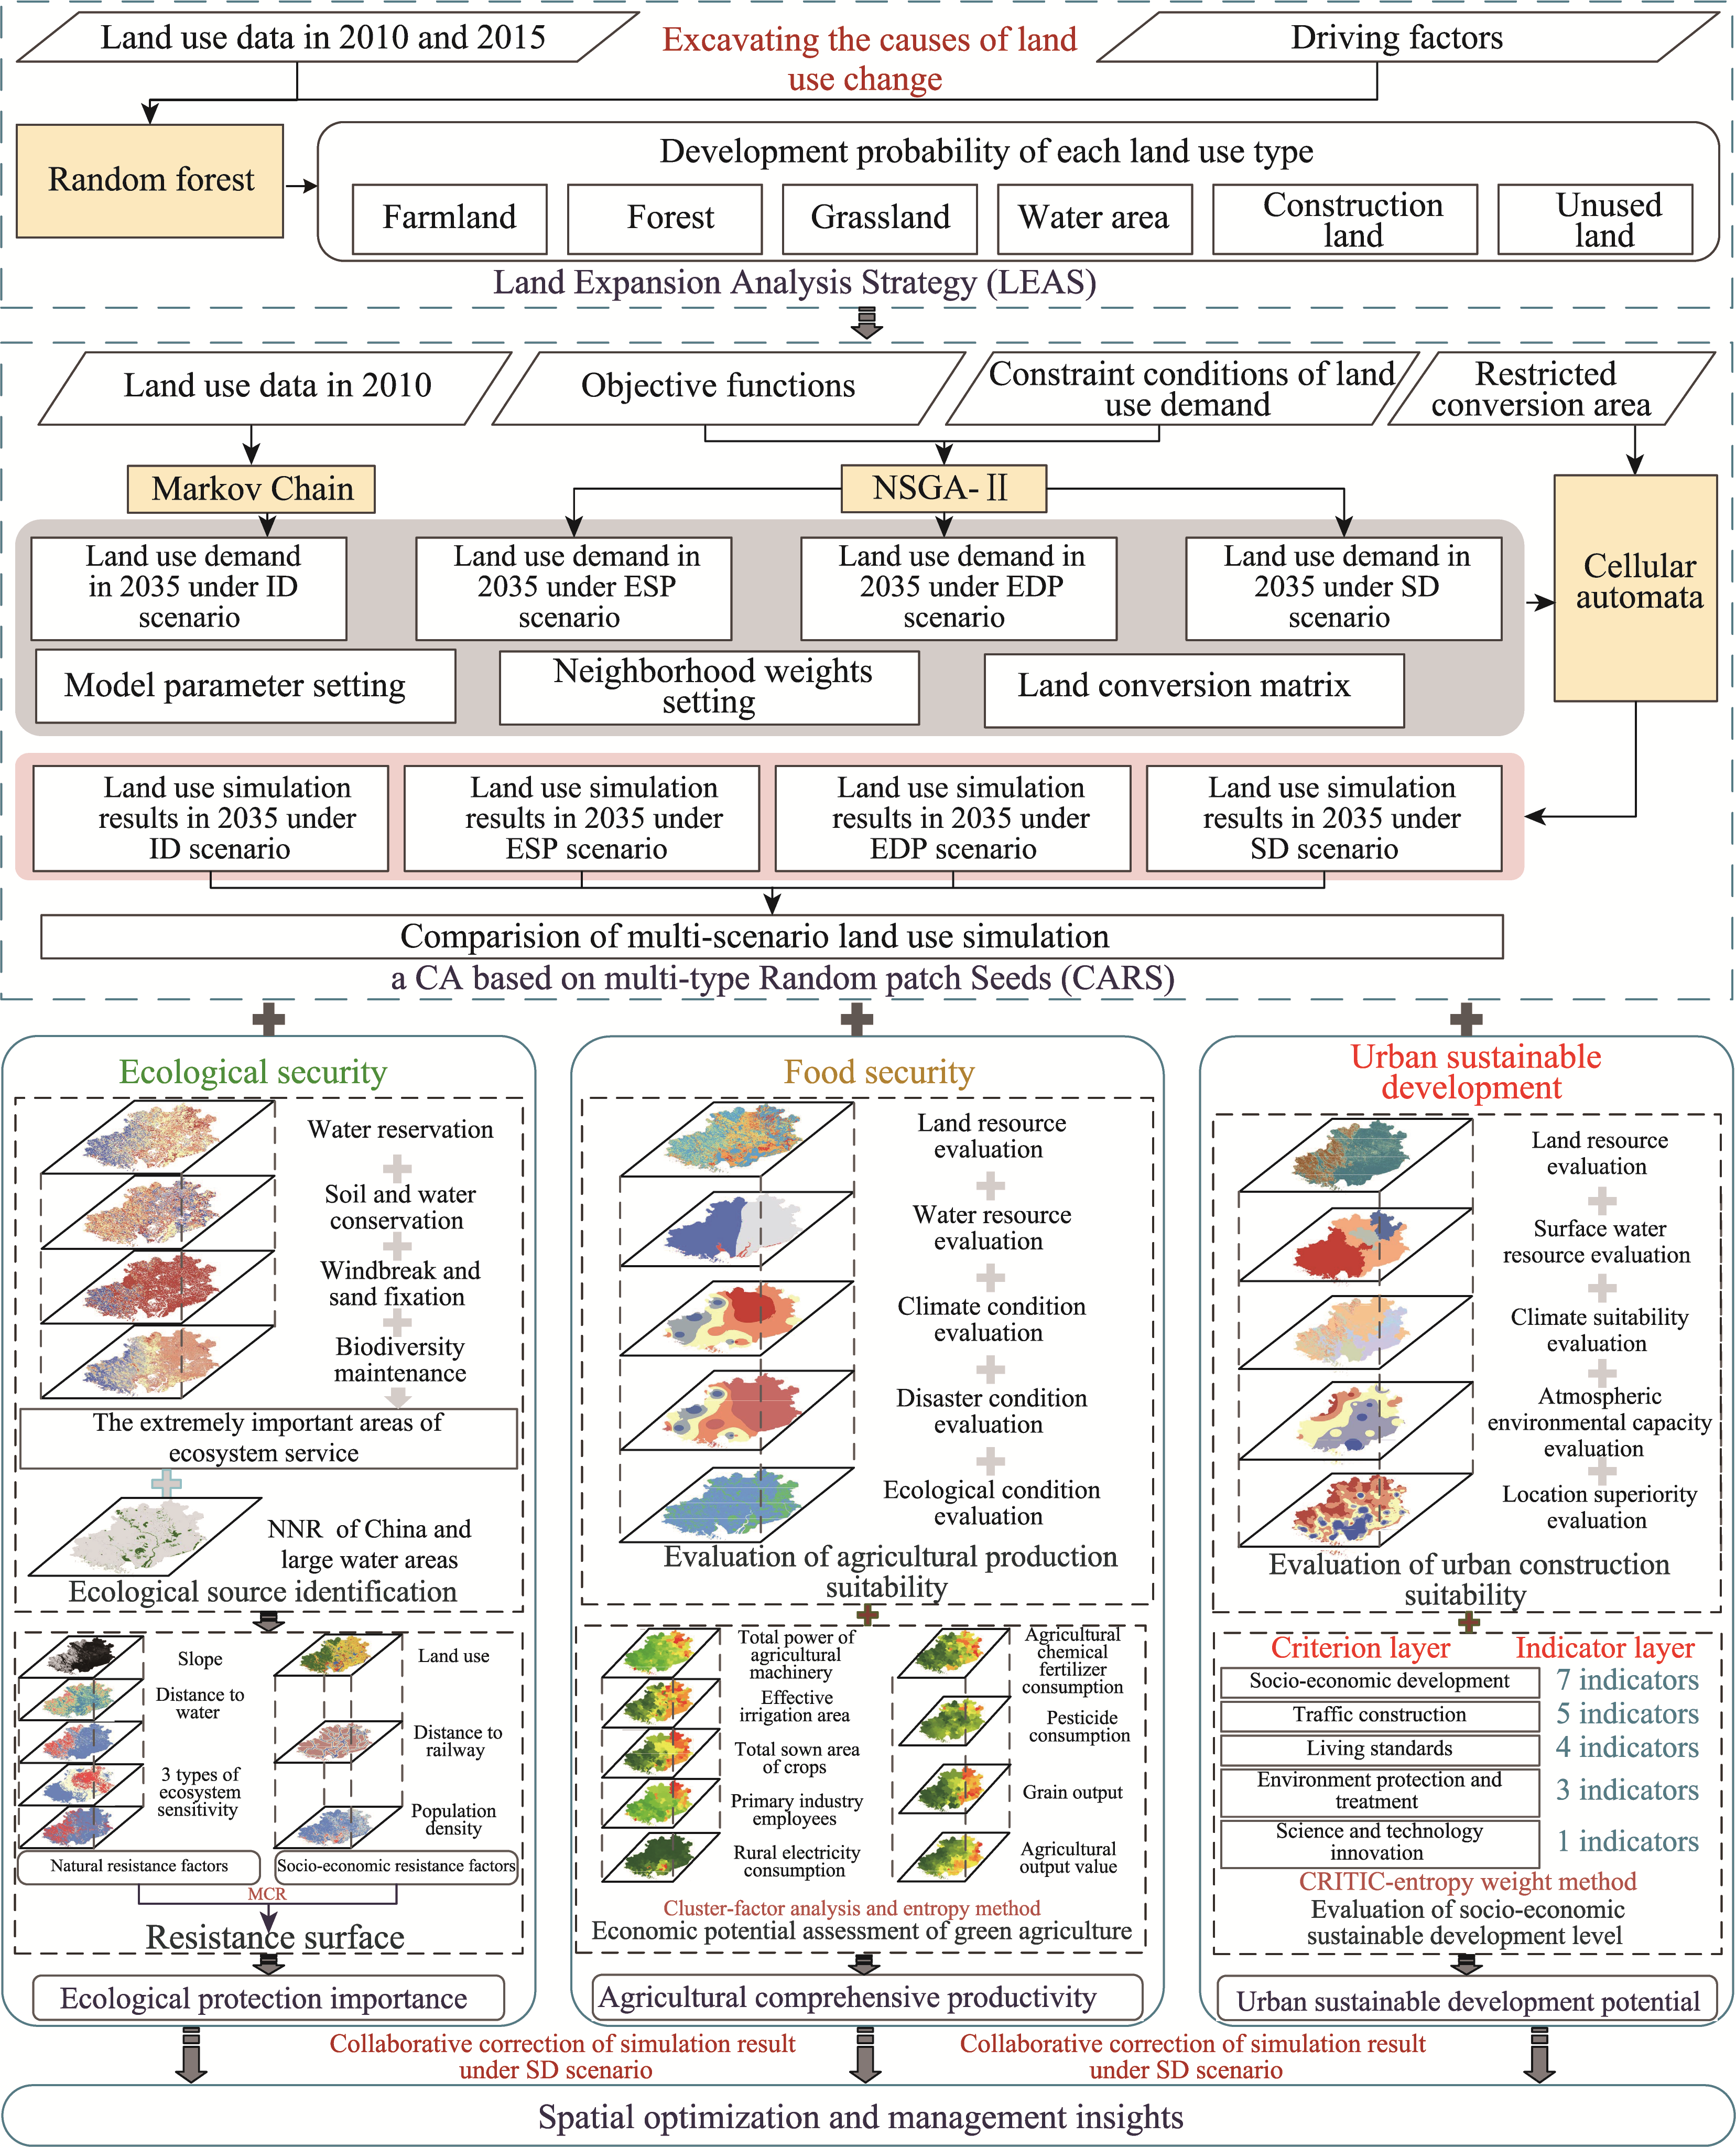
Figure 2
The ES-FS-USD spatial optimization framework
Table 1
Constraint conditions of land-use demand
Table 2
Land-use demand in the Yangtze River Delta region in 2035 under four scenarios (km
2
)
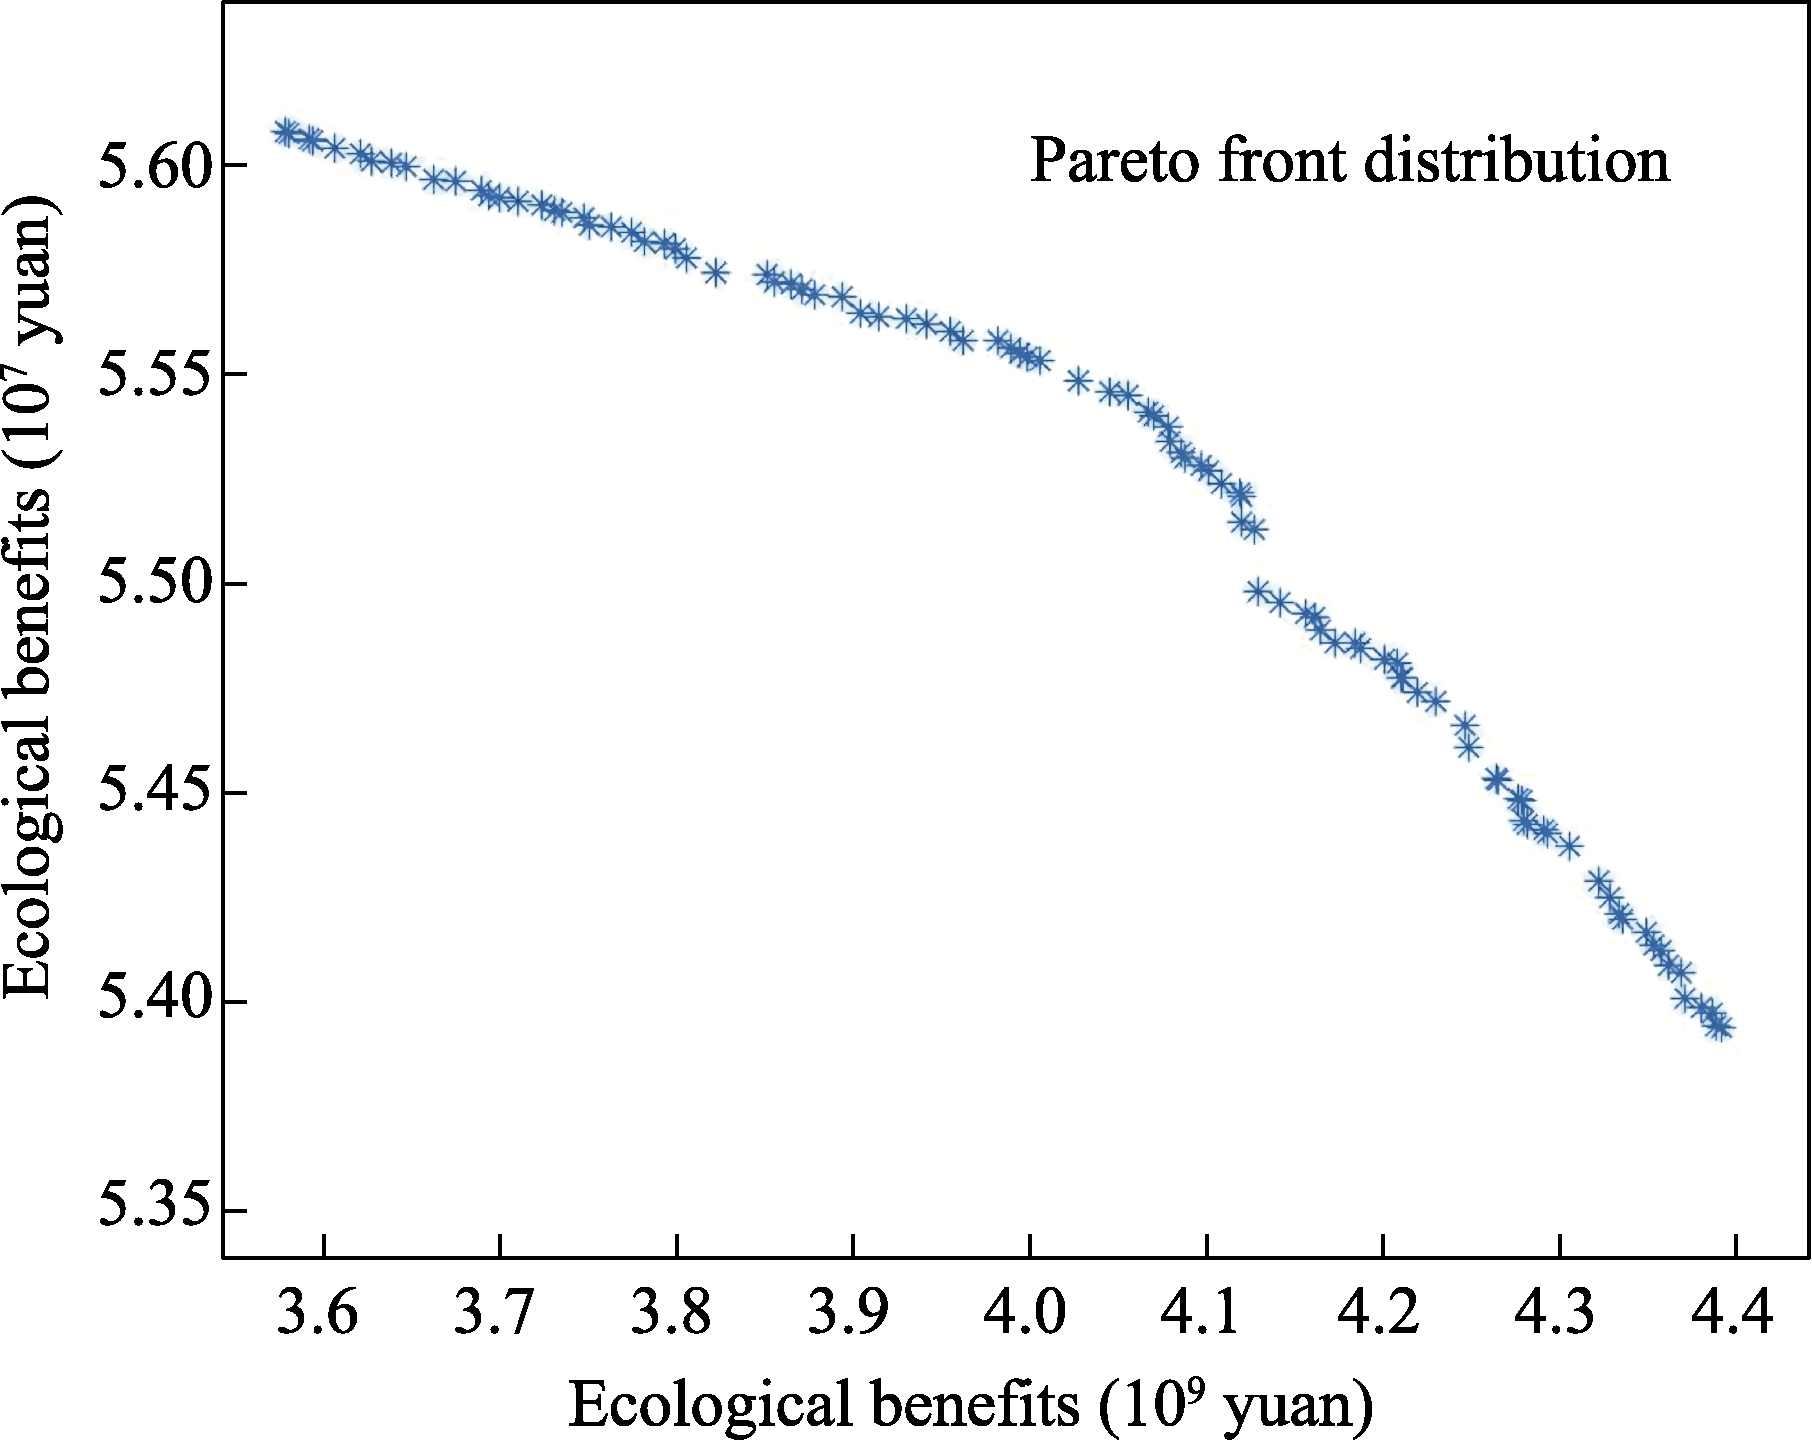
Figure 3
Pareto front distribution based on the double objectives of economic benefits and ecological benefits under the SD scenario
Table 3
Calculation methods for ecosystem services
Table 4
Calculation methods of ecosystem sensitivity
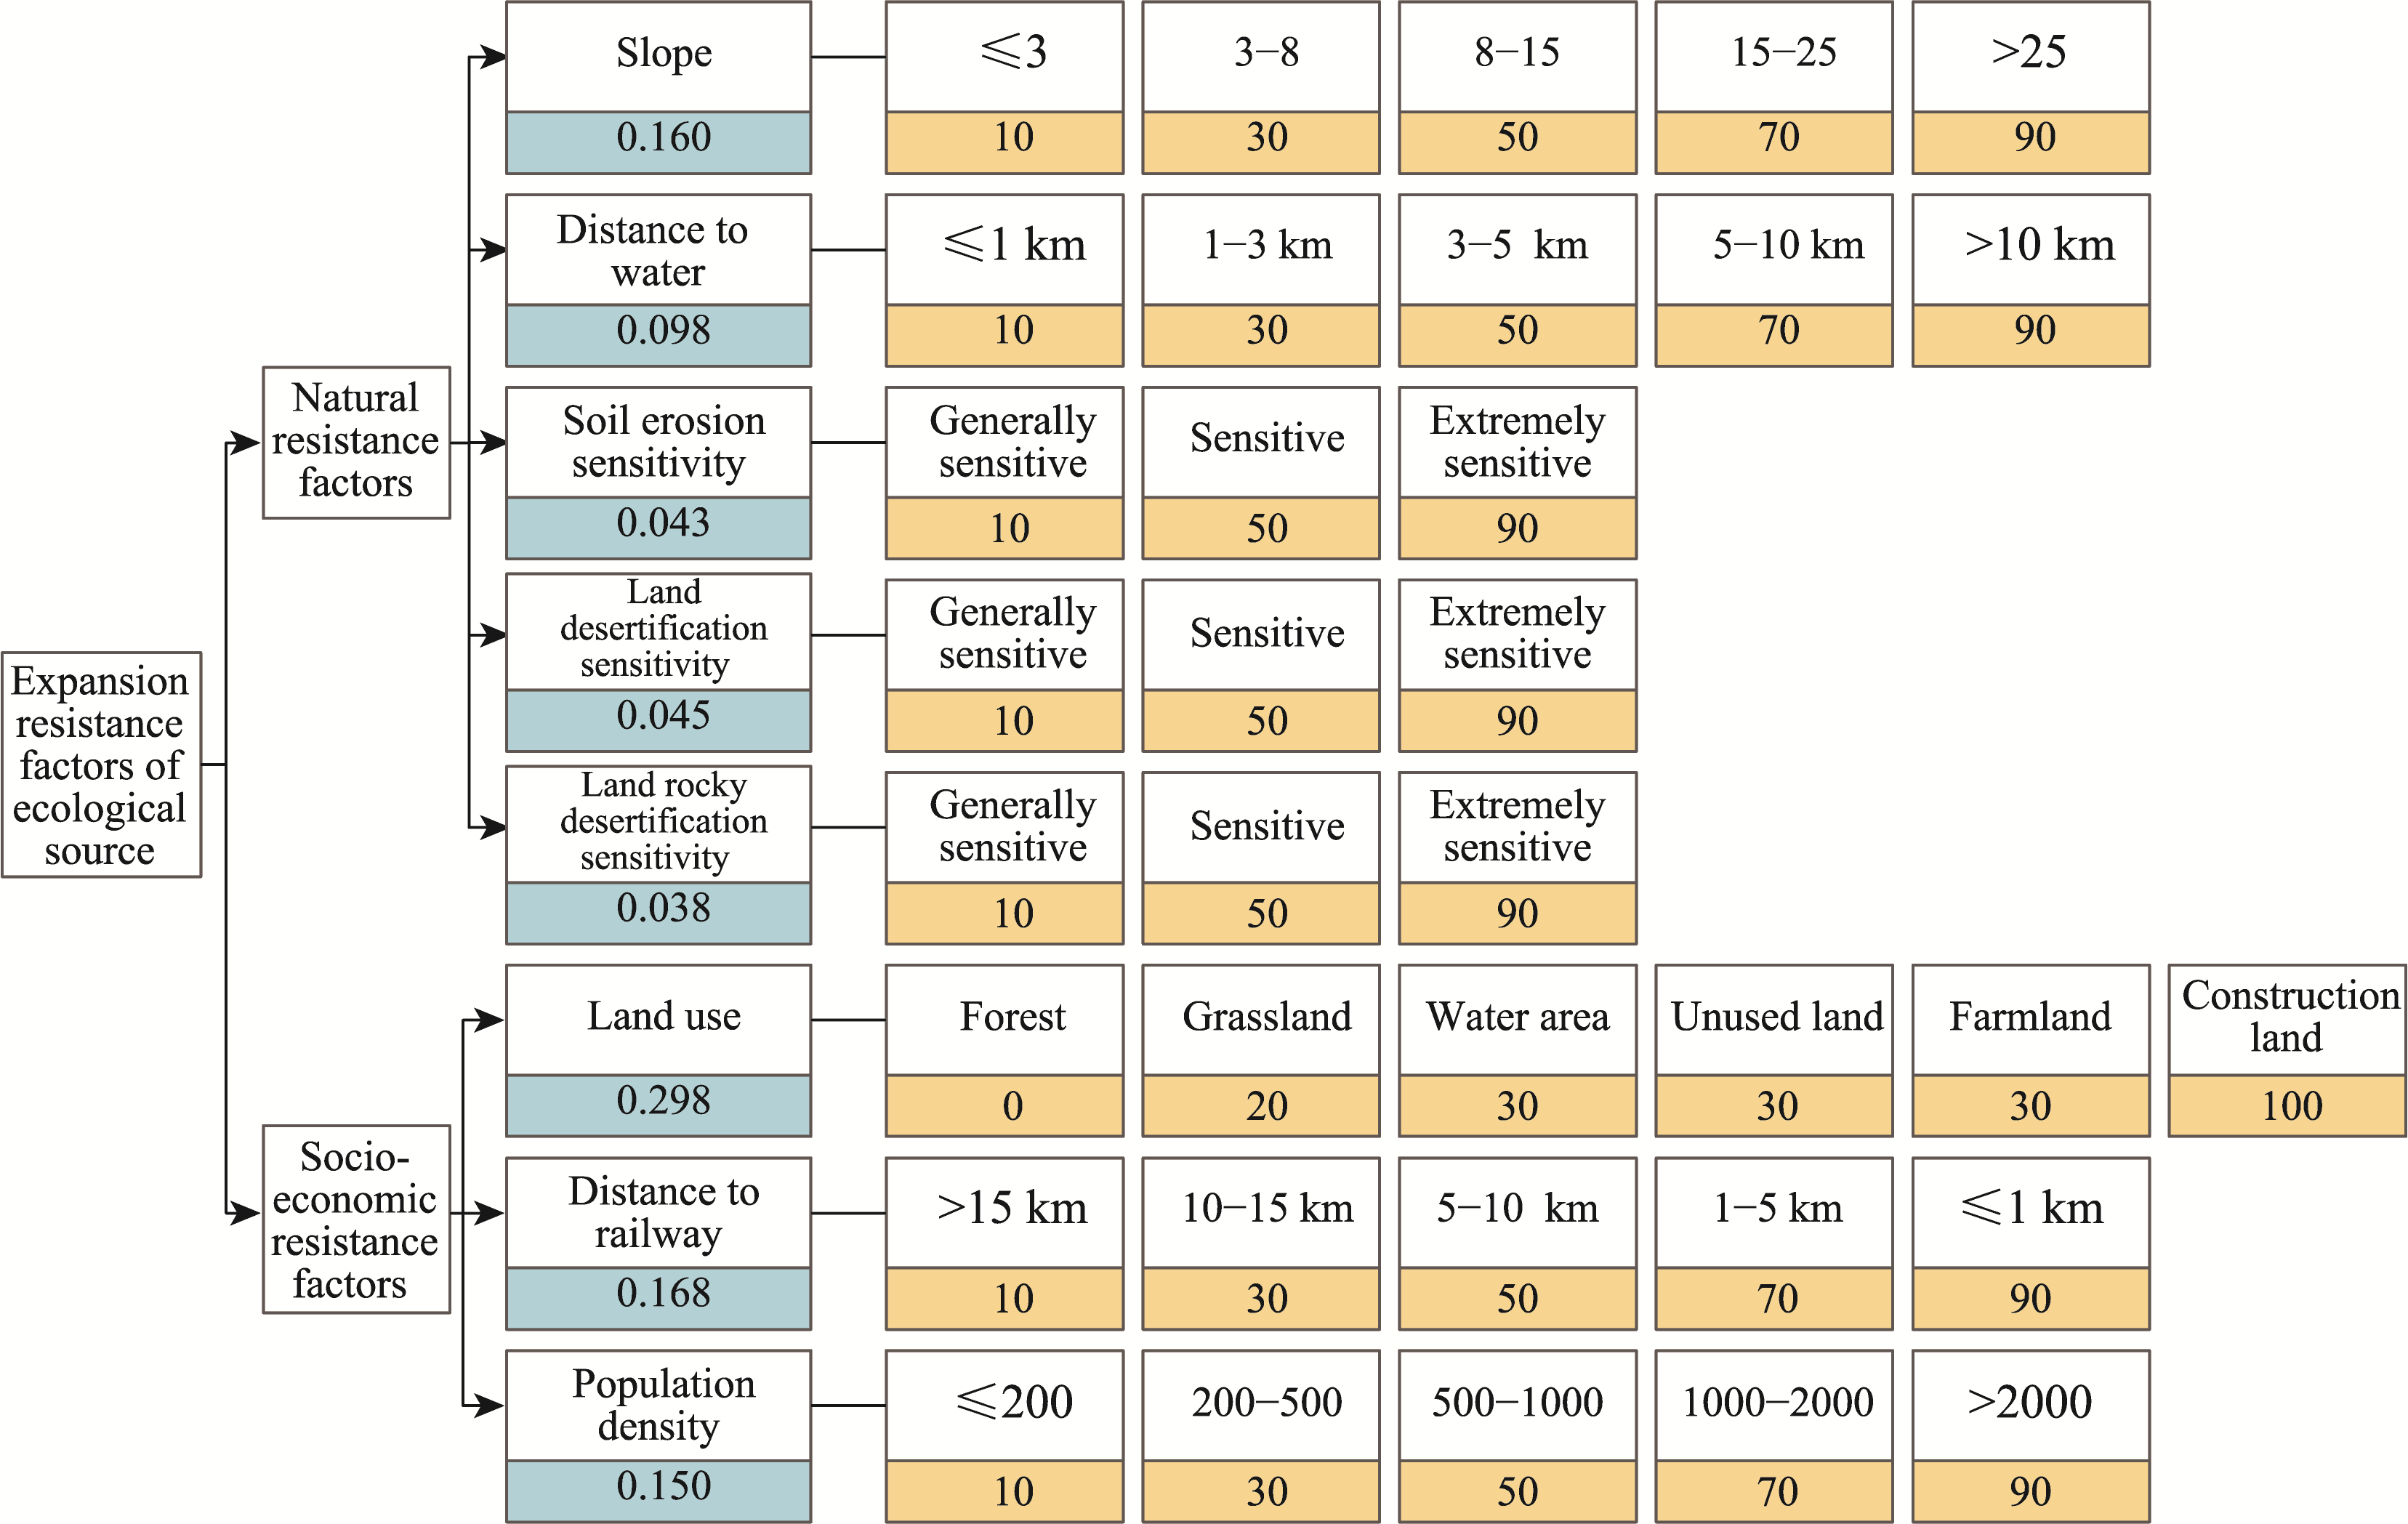
Figure 4
Weights and resistance values of expansion resistance factors of ecological source in the Yangtze River Delta region
Table 5
Cluster-factor analysis results
Table 6
Weighting based on the entropy method
Table 7
Evaluation index system for the socio-economic sustainable development level in the Yangtze River Delta region
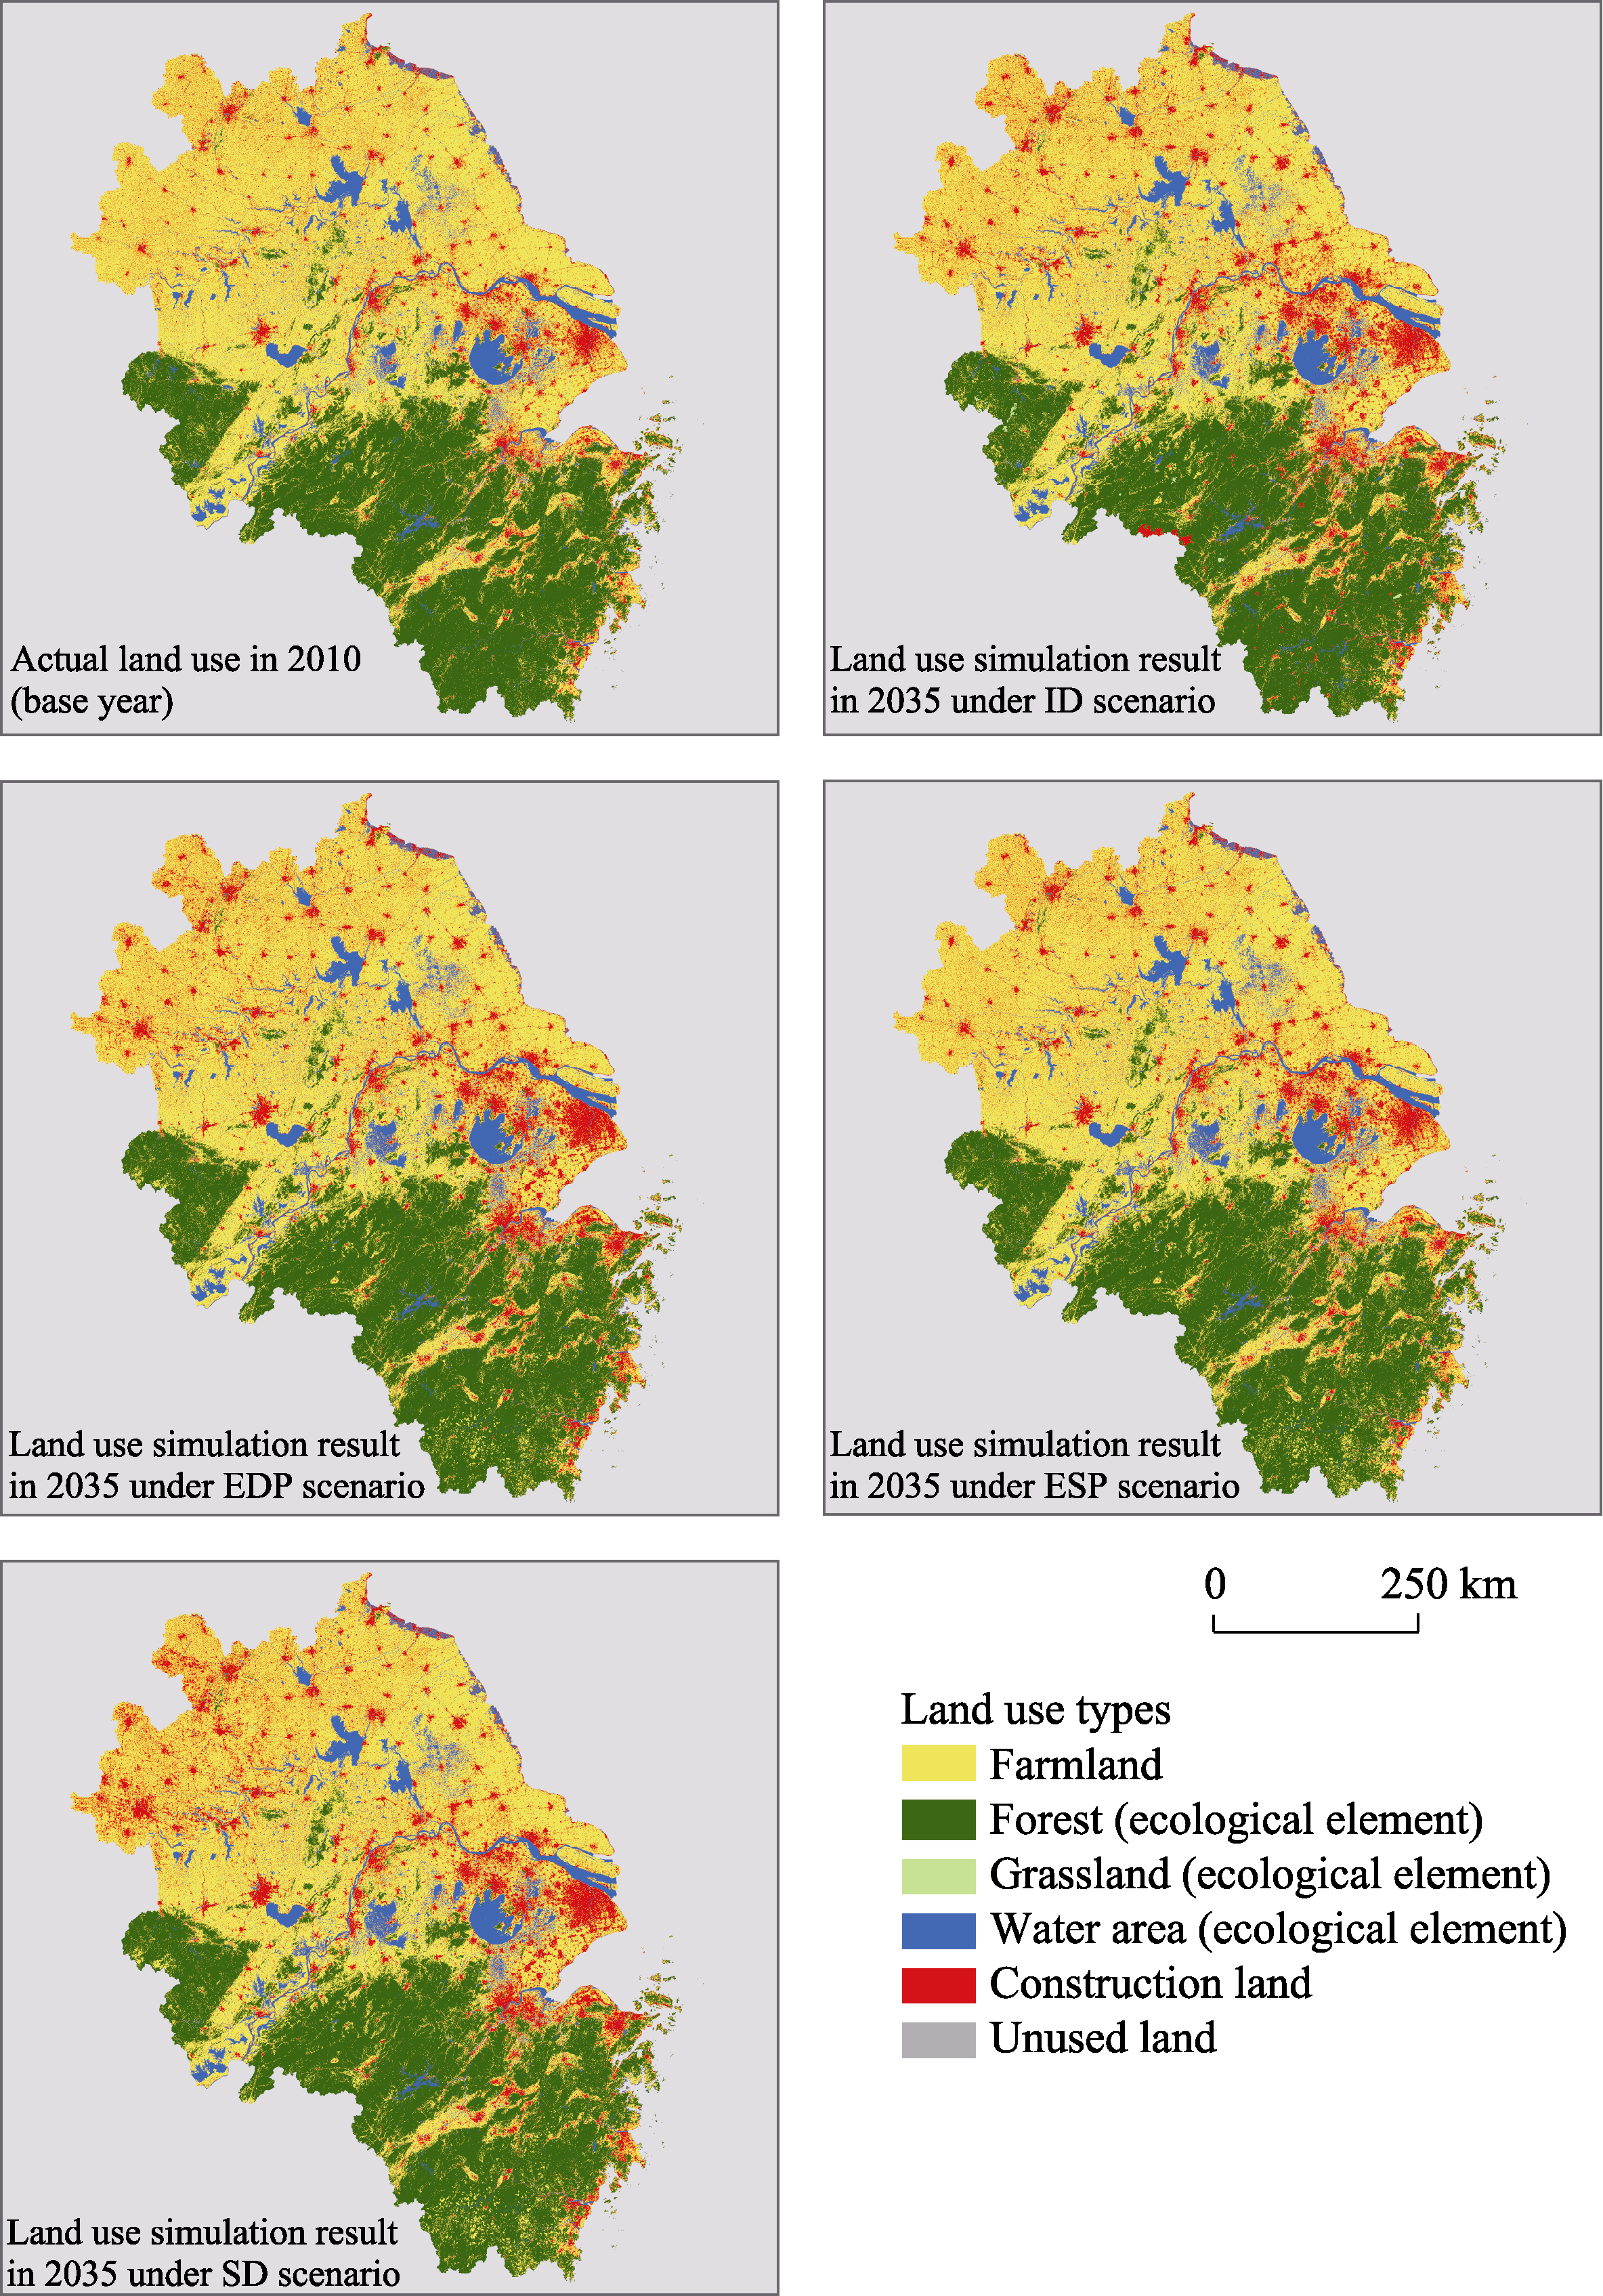
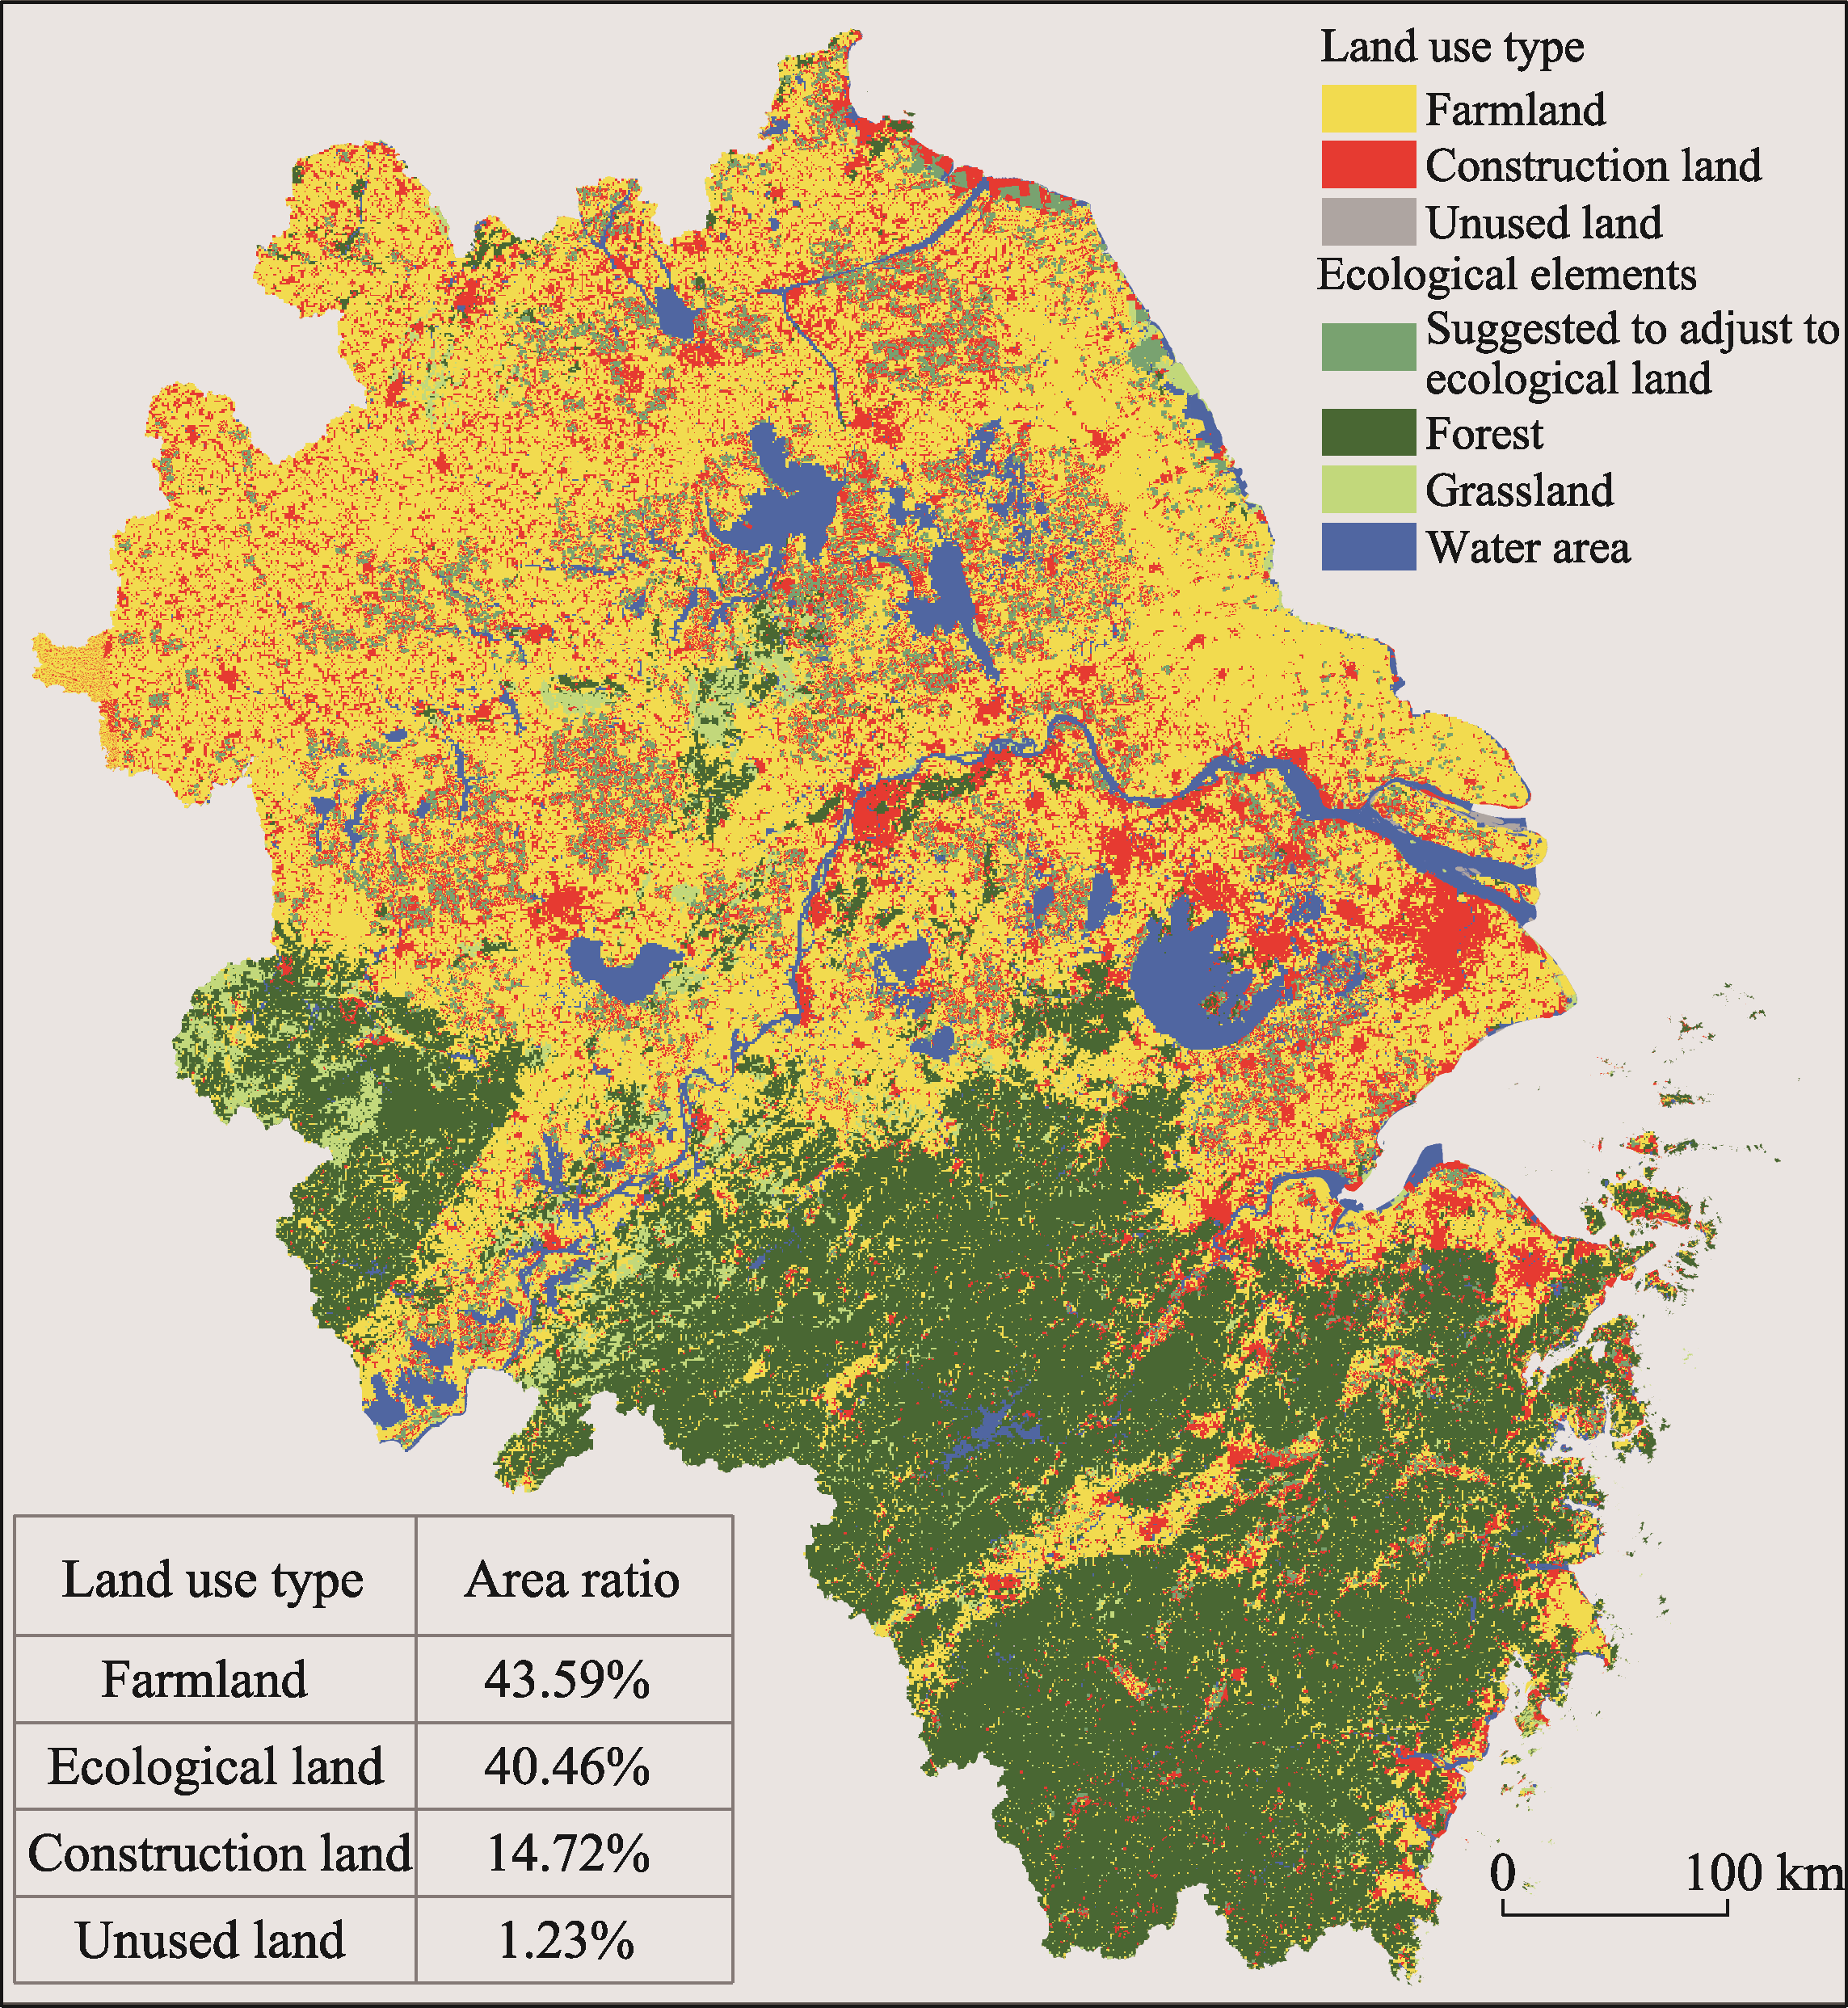
Figure 5
Land-use simulation results in 2035 under four scenarios in the Yangtze River Delta region
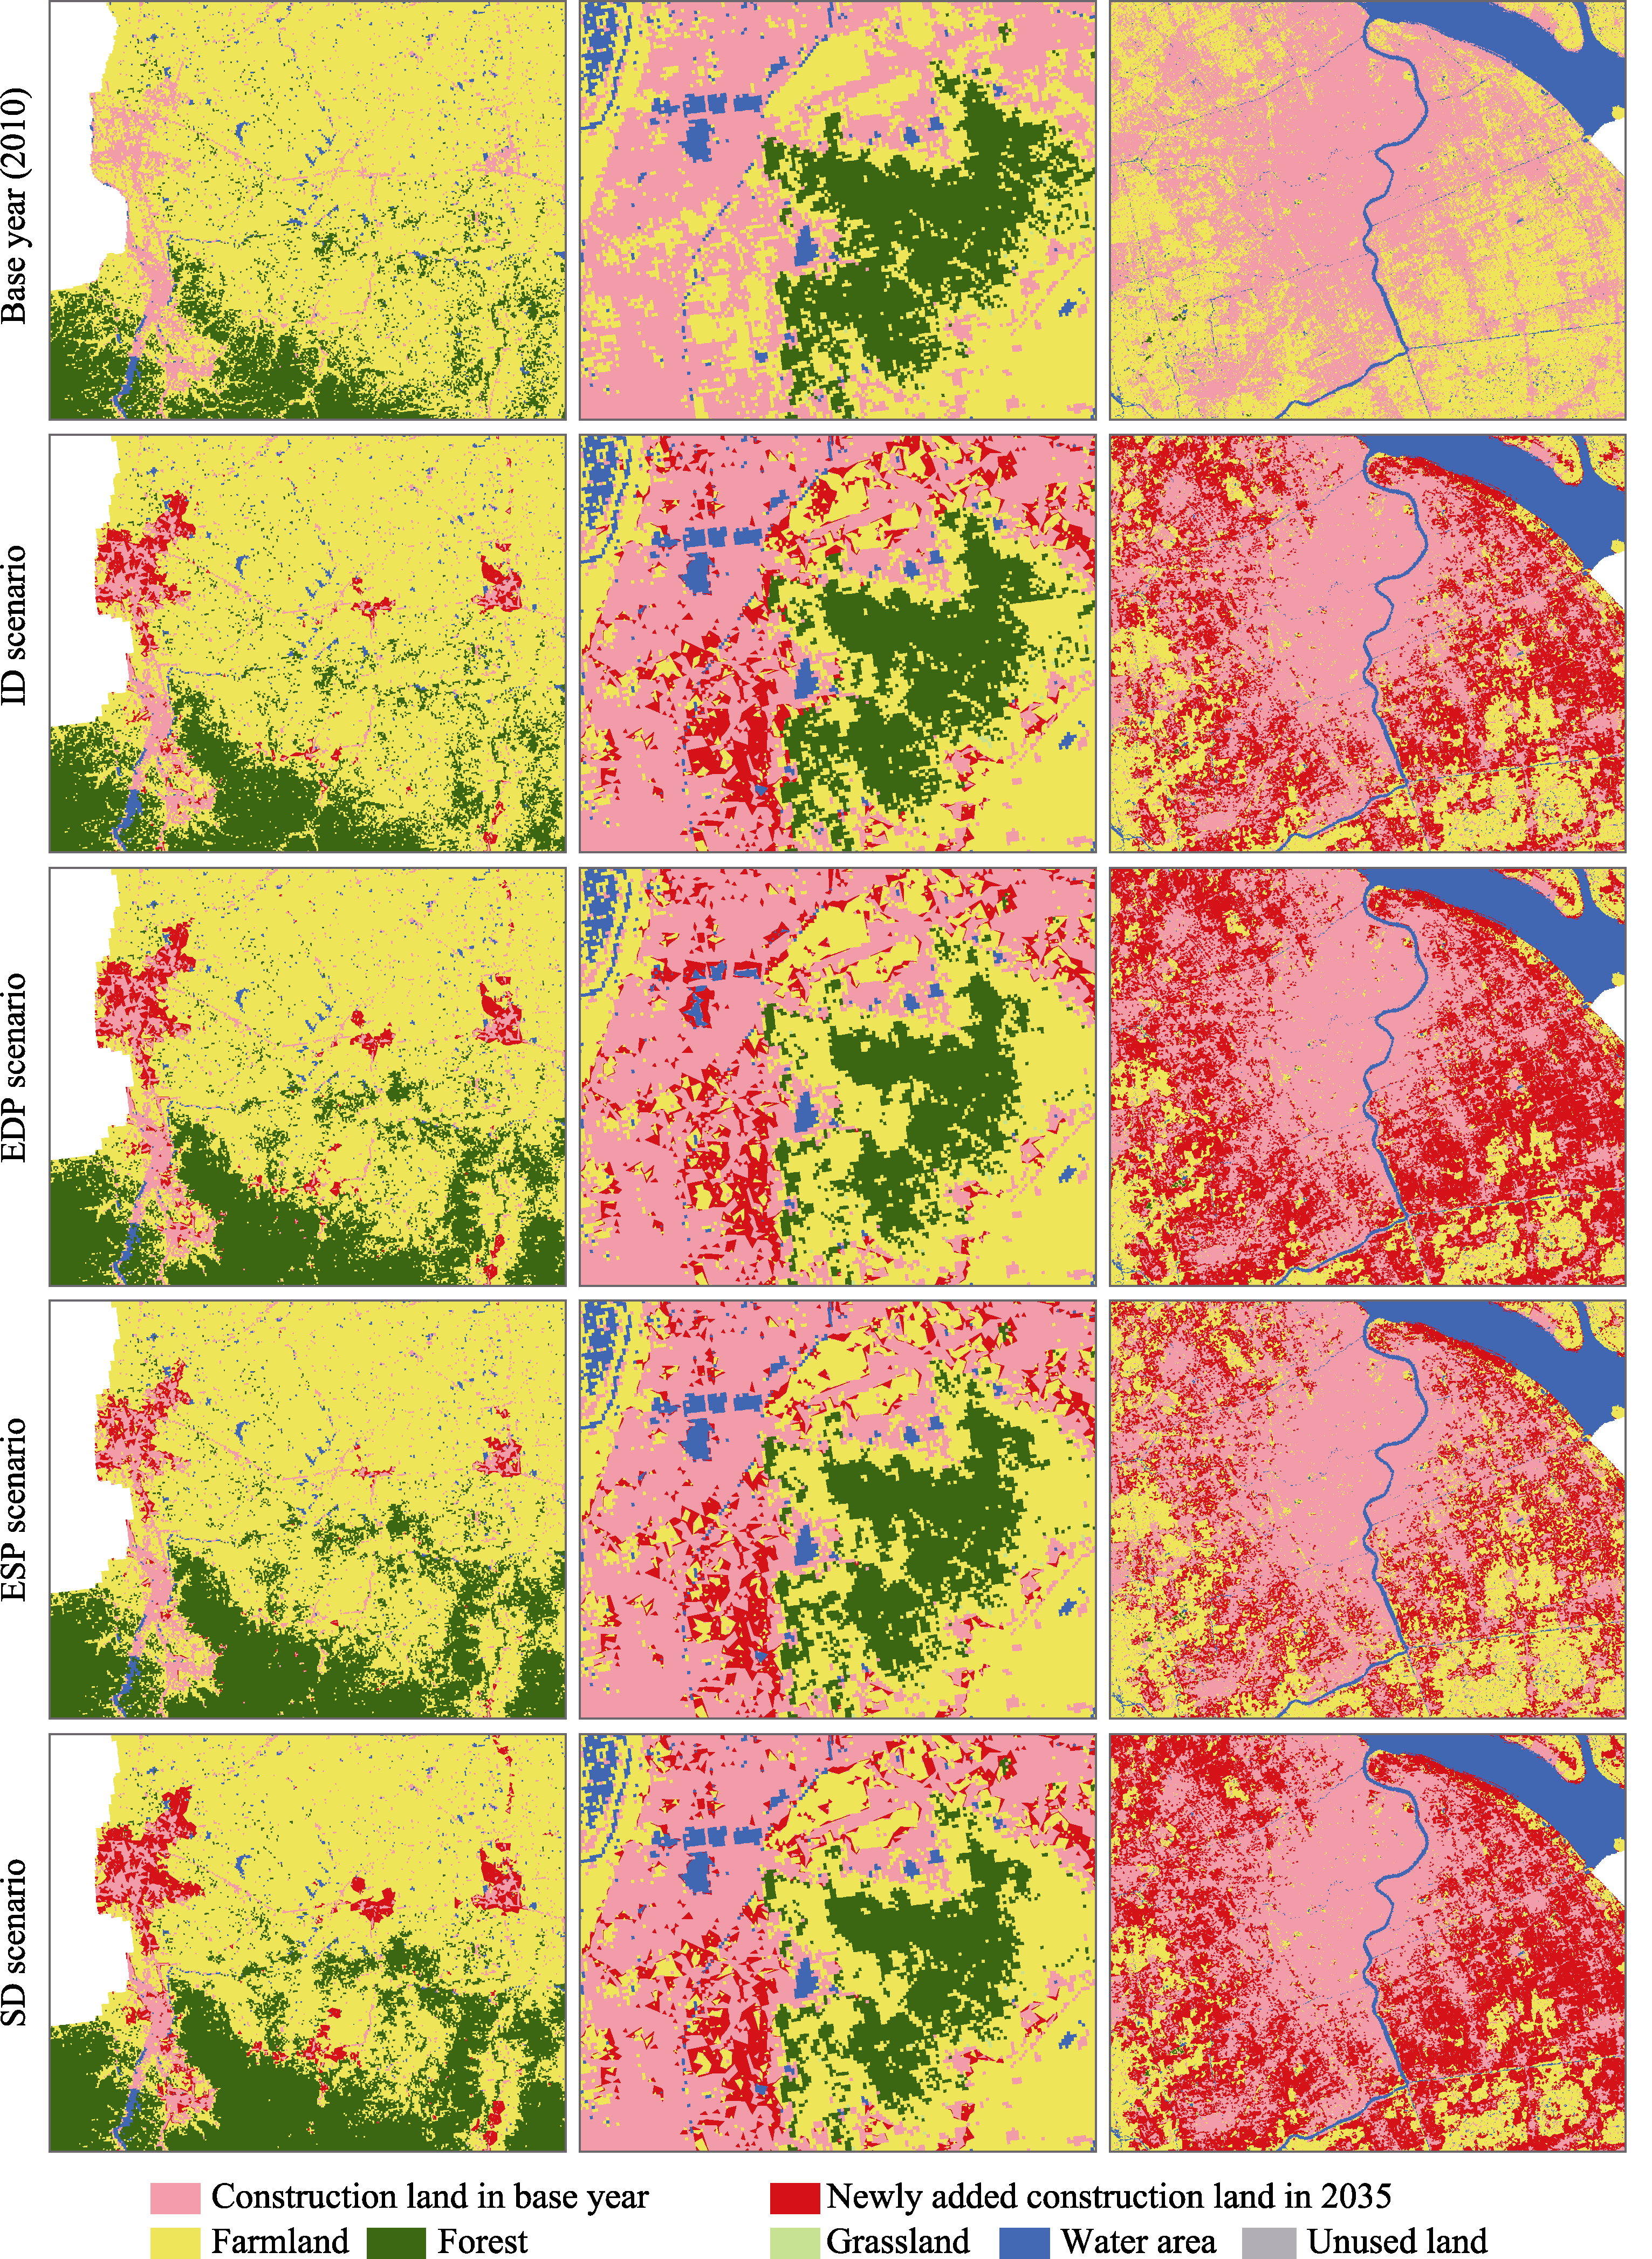
Figure 6
Differences in detail in land-use patterns in the Yangtze River Delta region
Table 8
Landscape pattern index of different land-use types in the Yangtze River Delta region
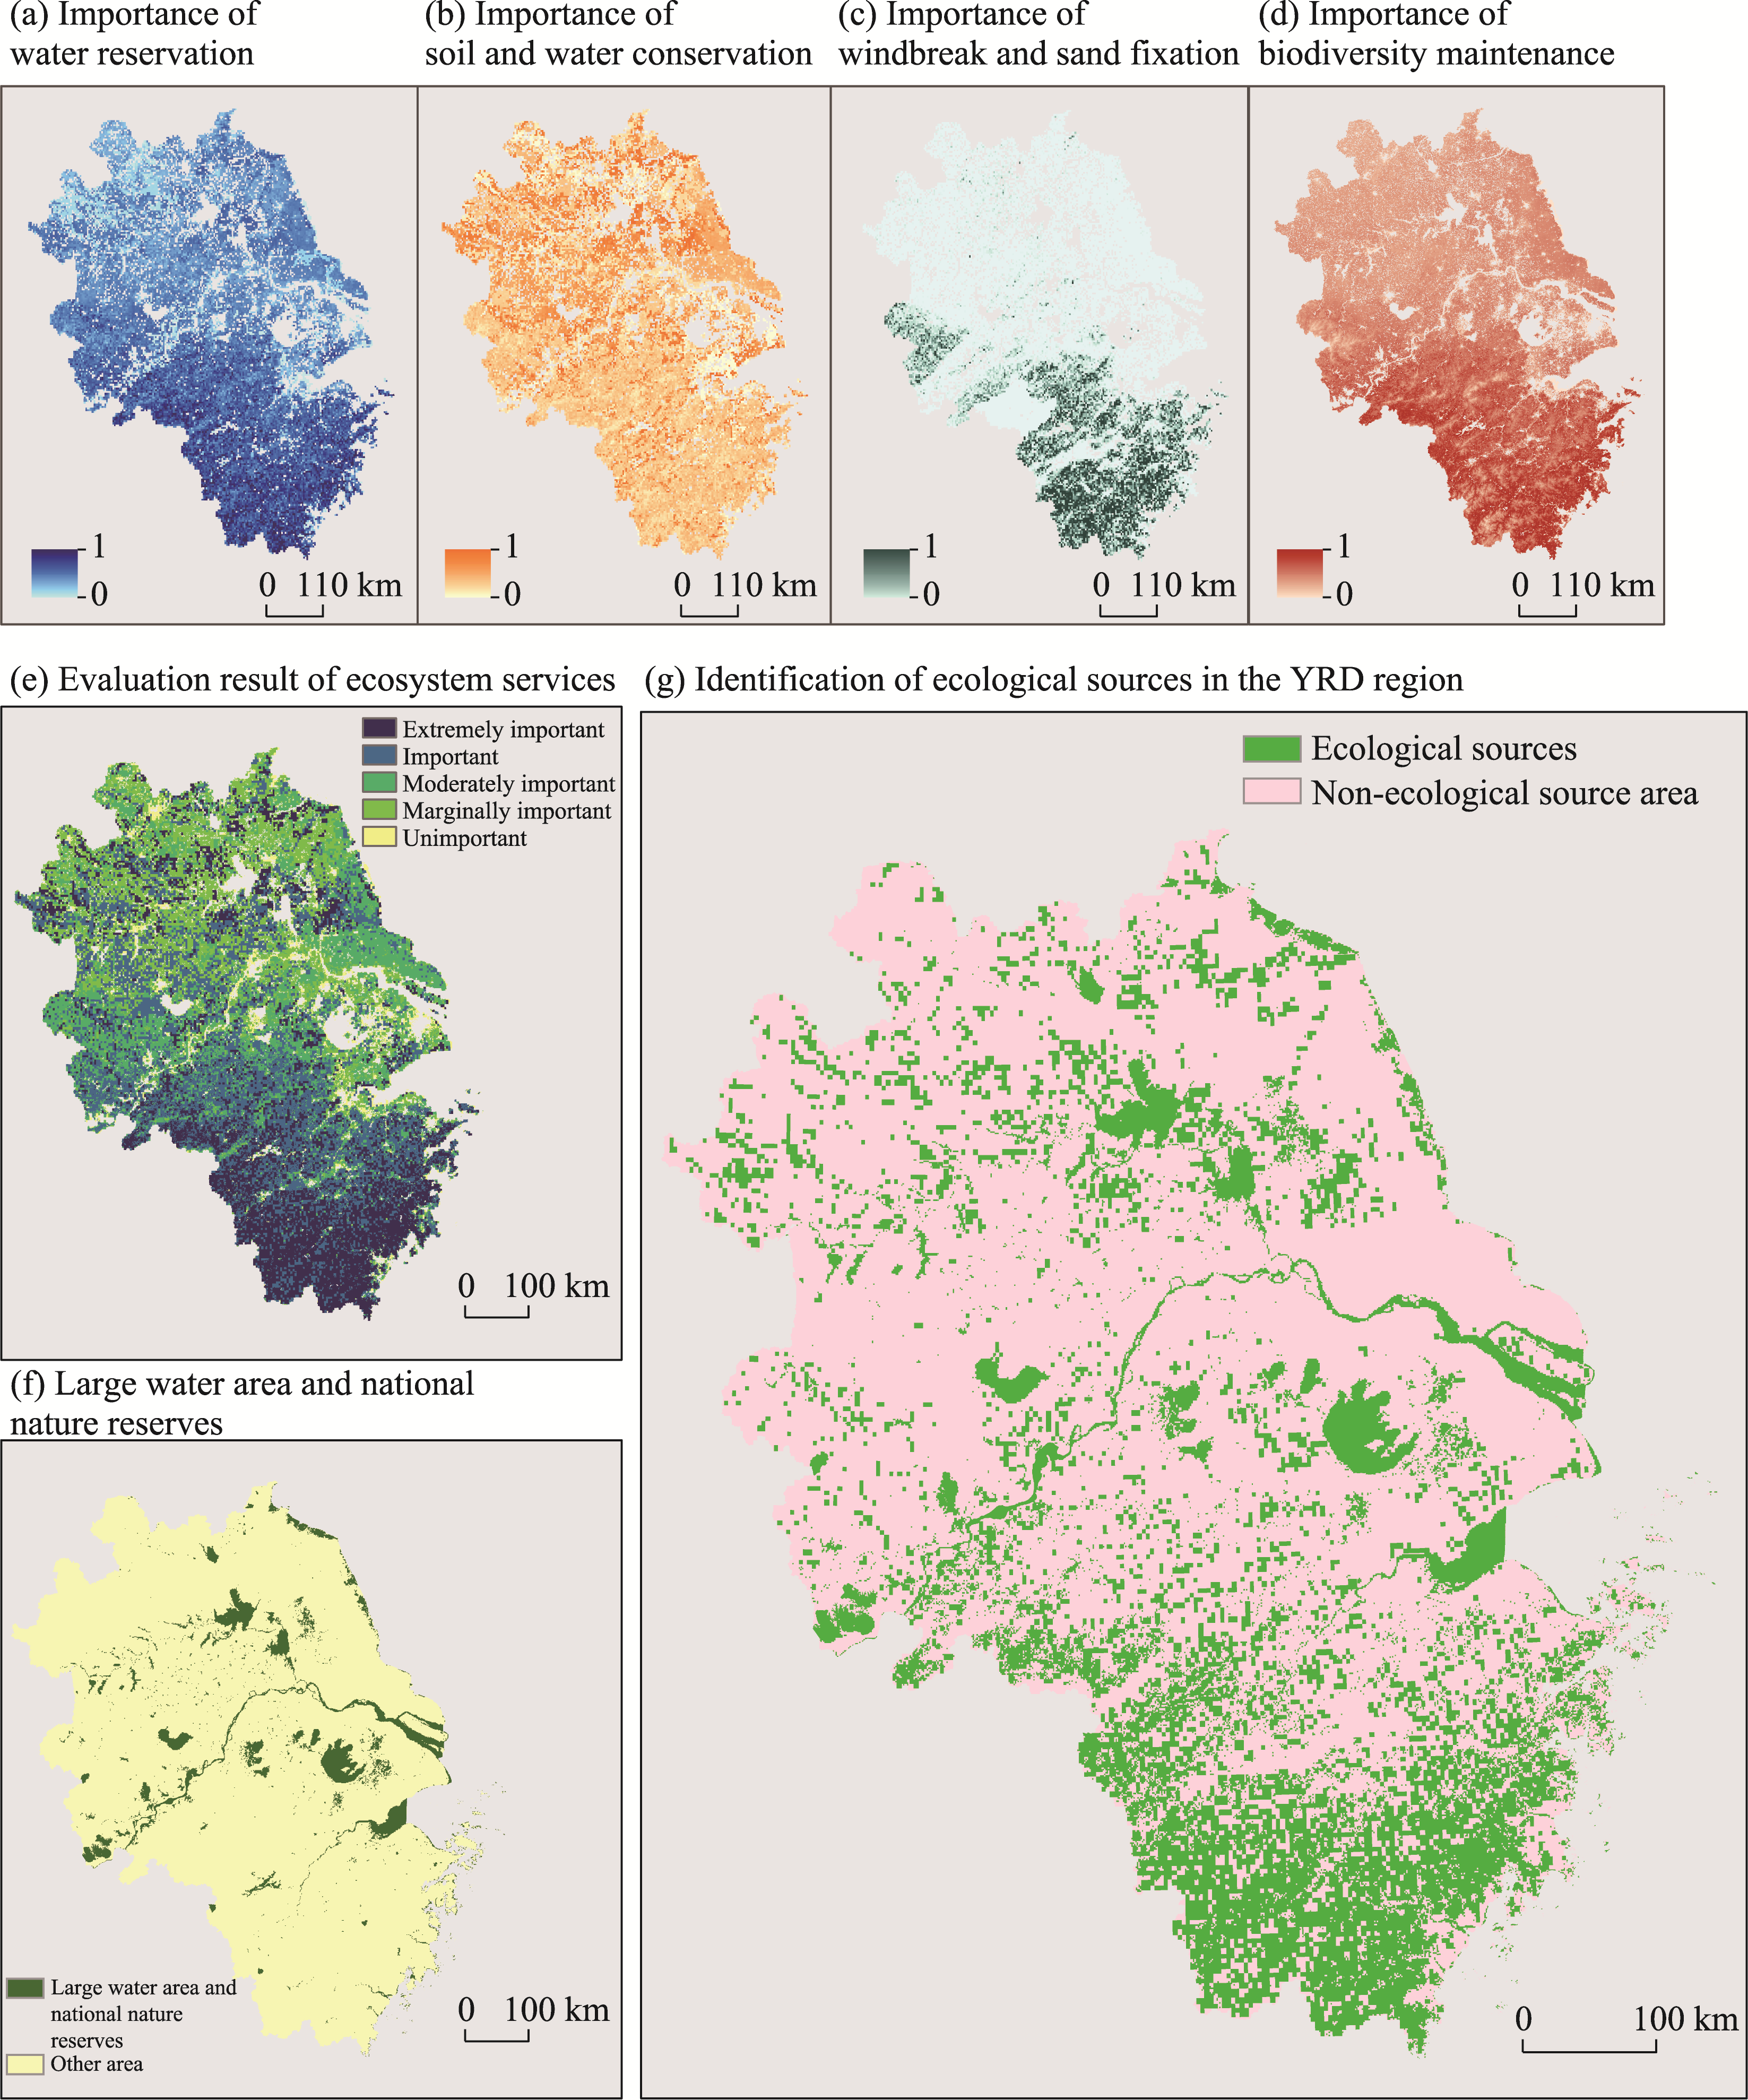
Figure 7
Identification of ecological sources in the Yangtze River Delta region
Figure 8
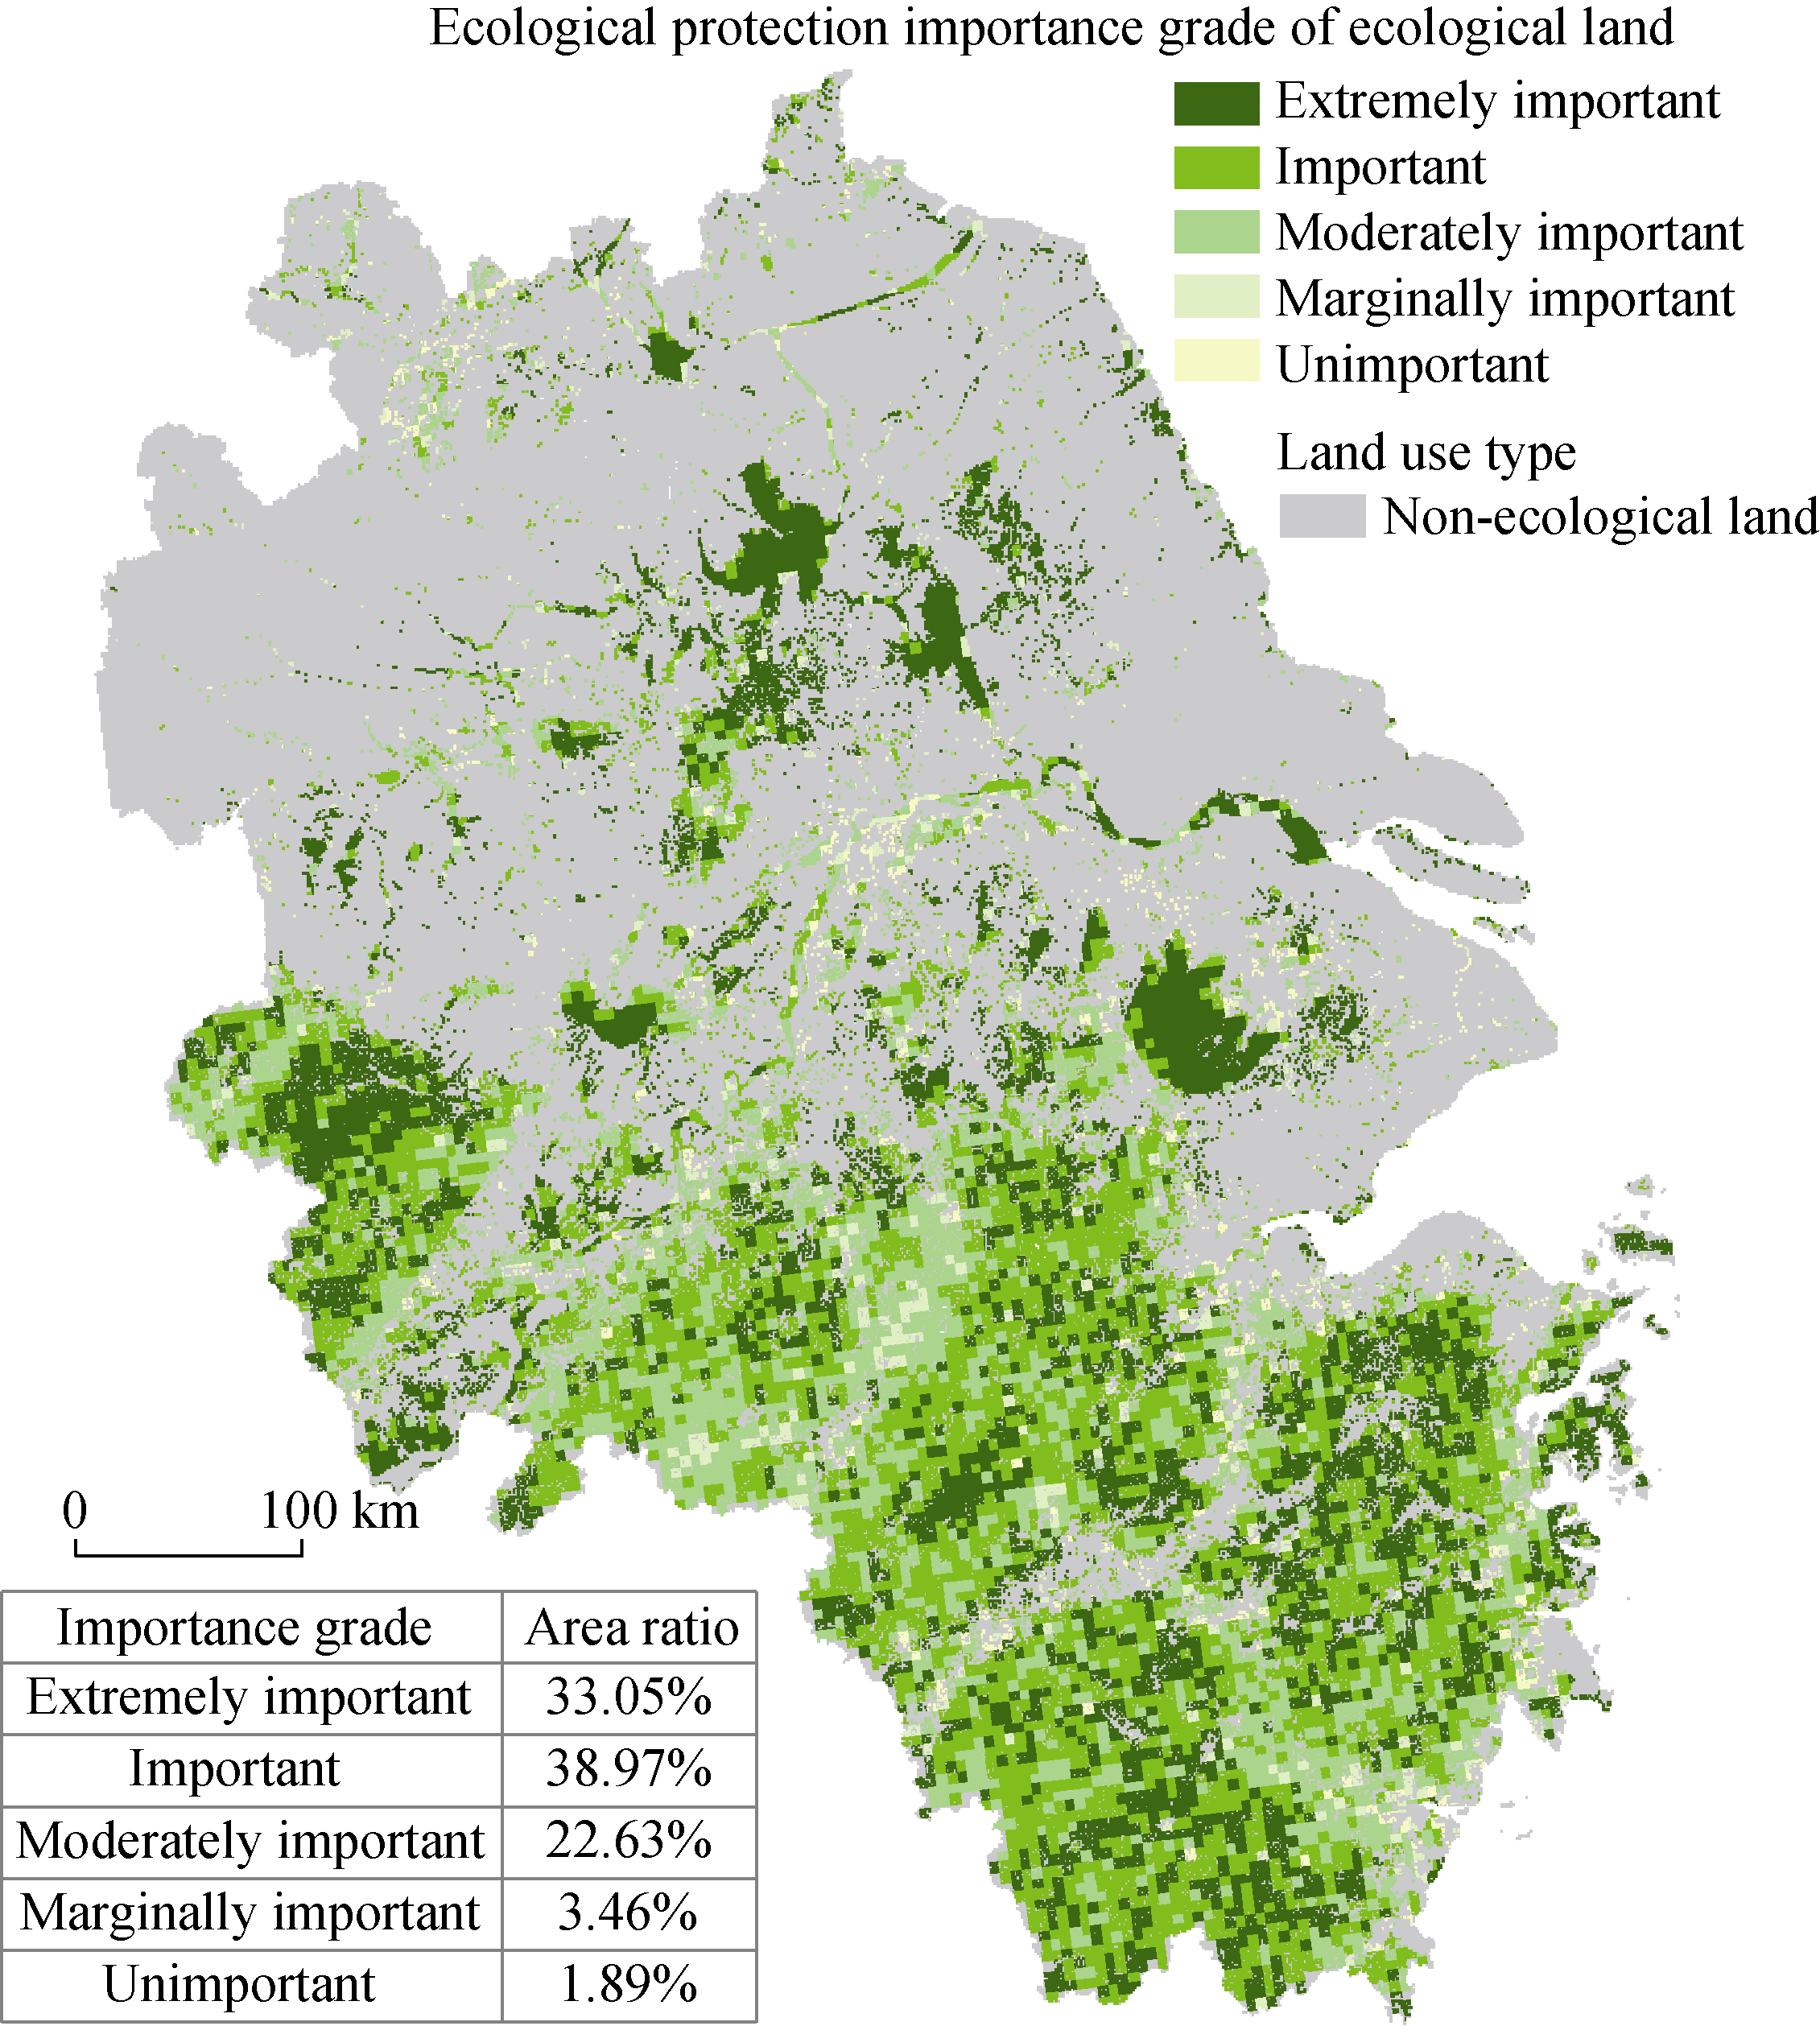
Distribution of ecological protection importance of ecological land in 2035 simulated under the SD scenario in the Yangtze River Delta region
Figure 10
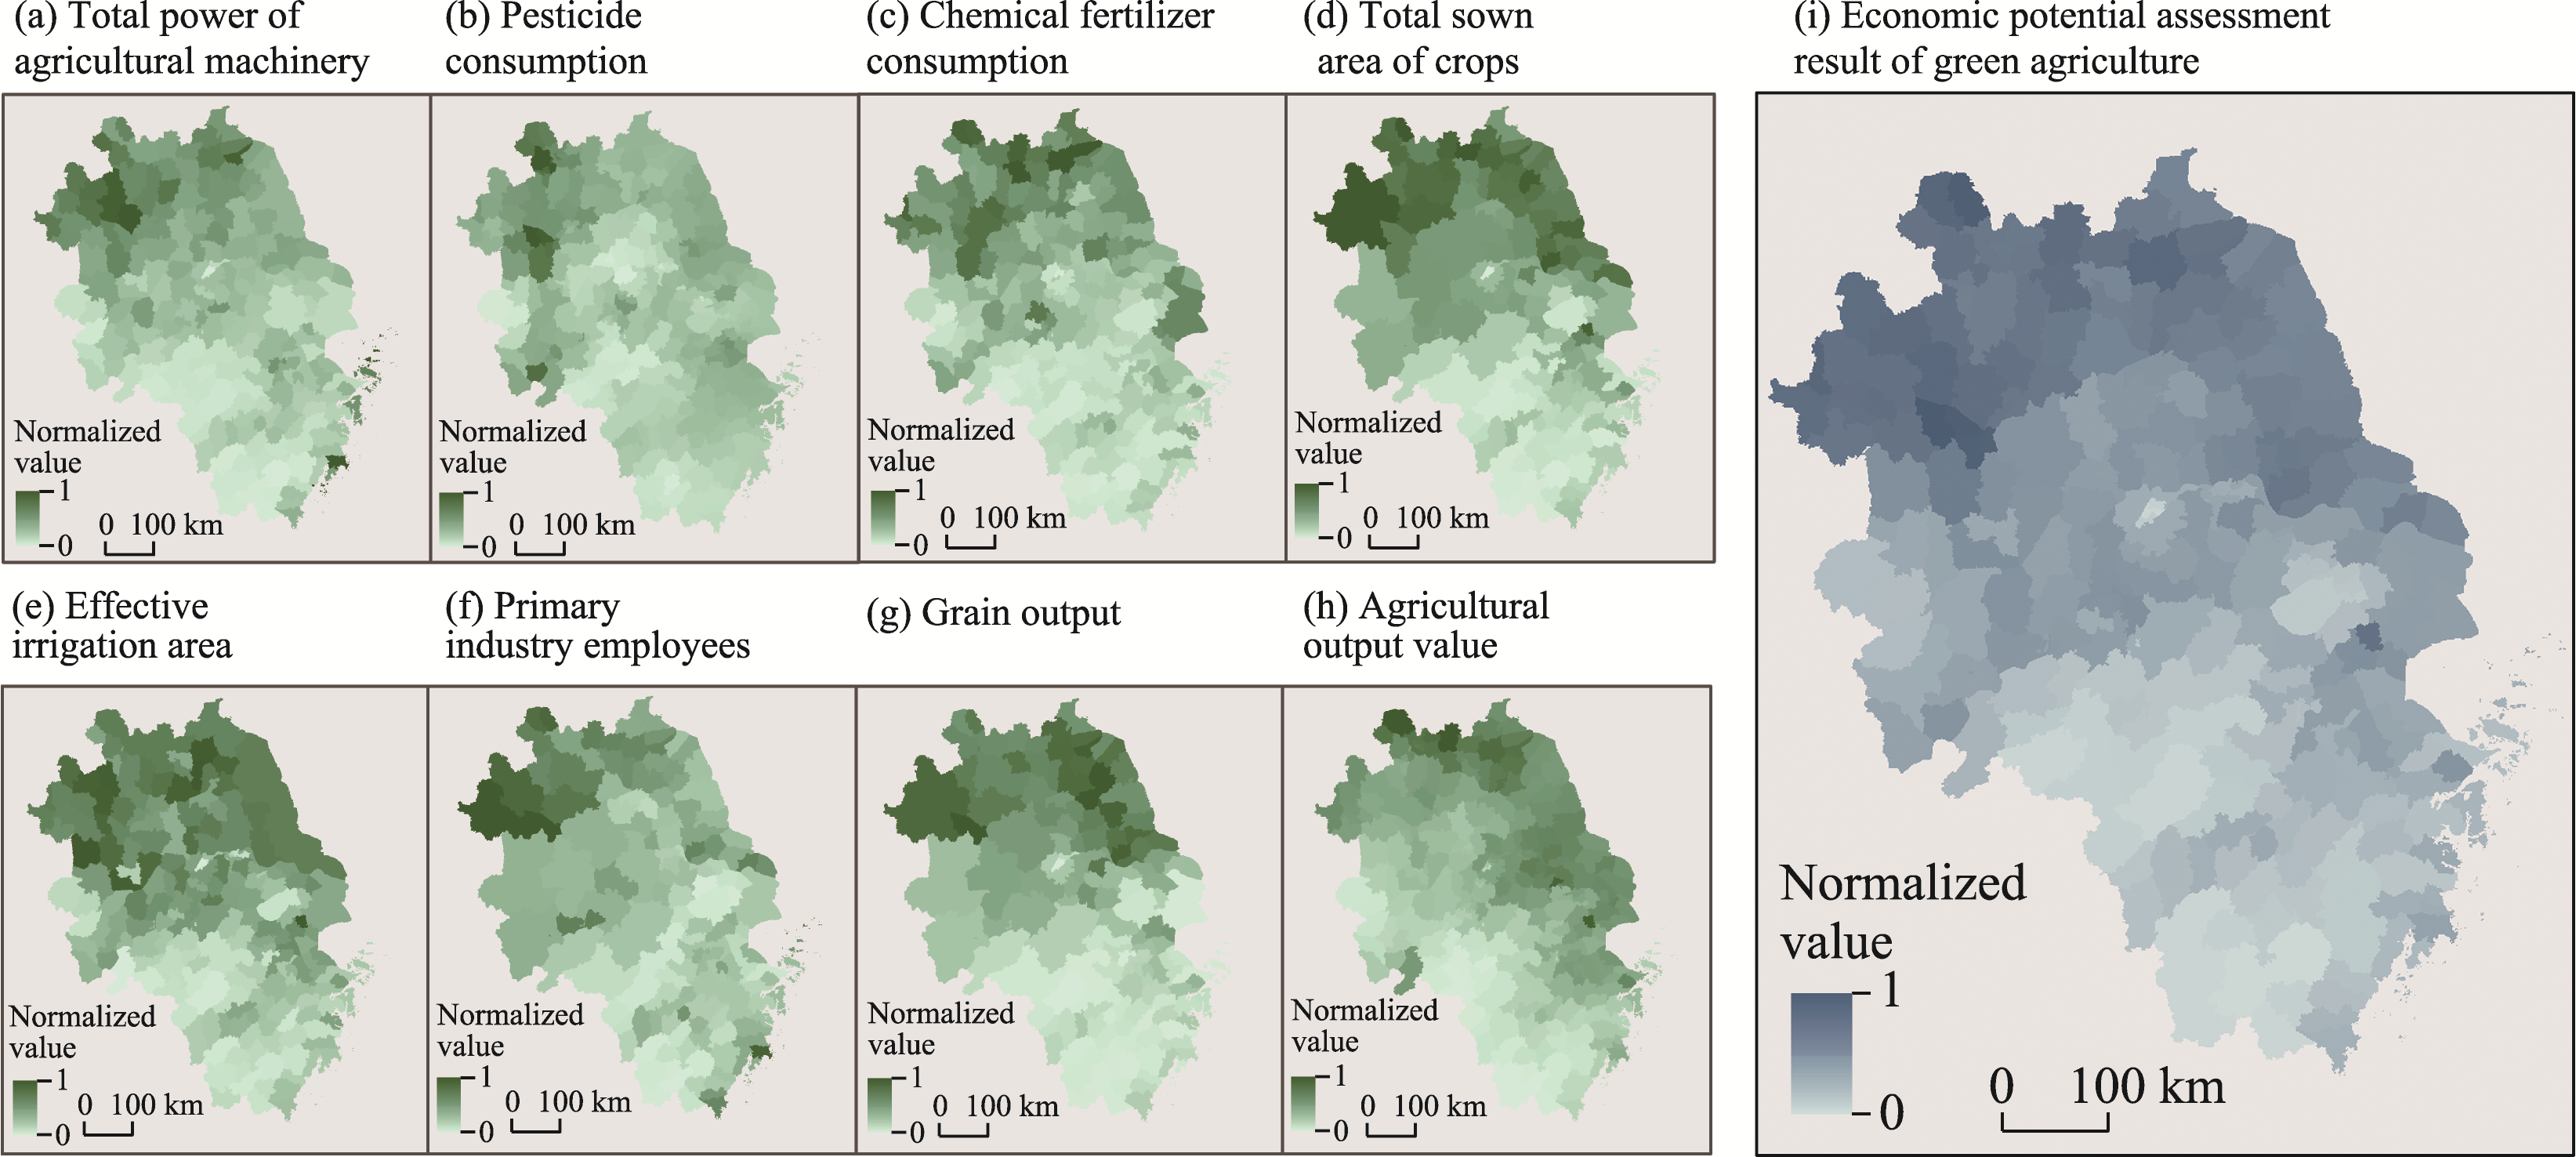
Normalized assessment index and assessment of the economic potential of green agriculture in the Yangtze River Delta region
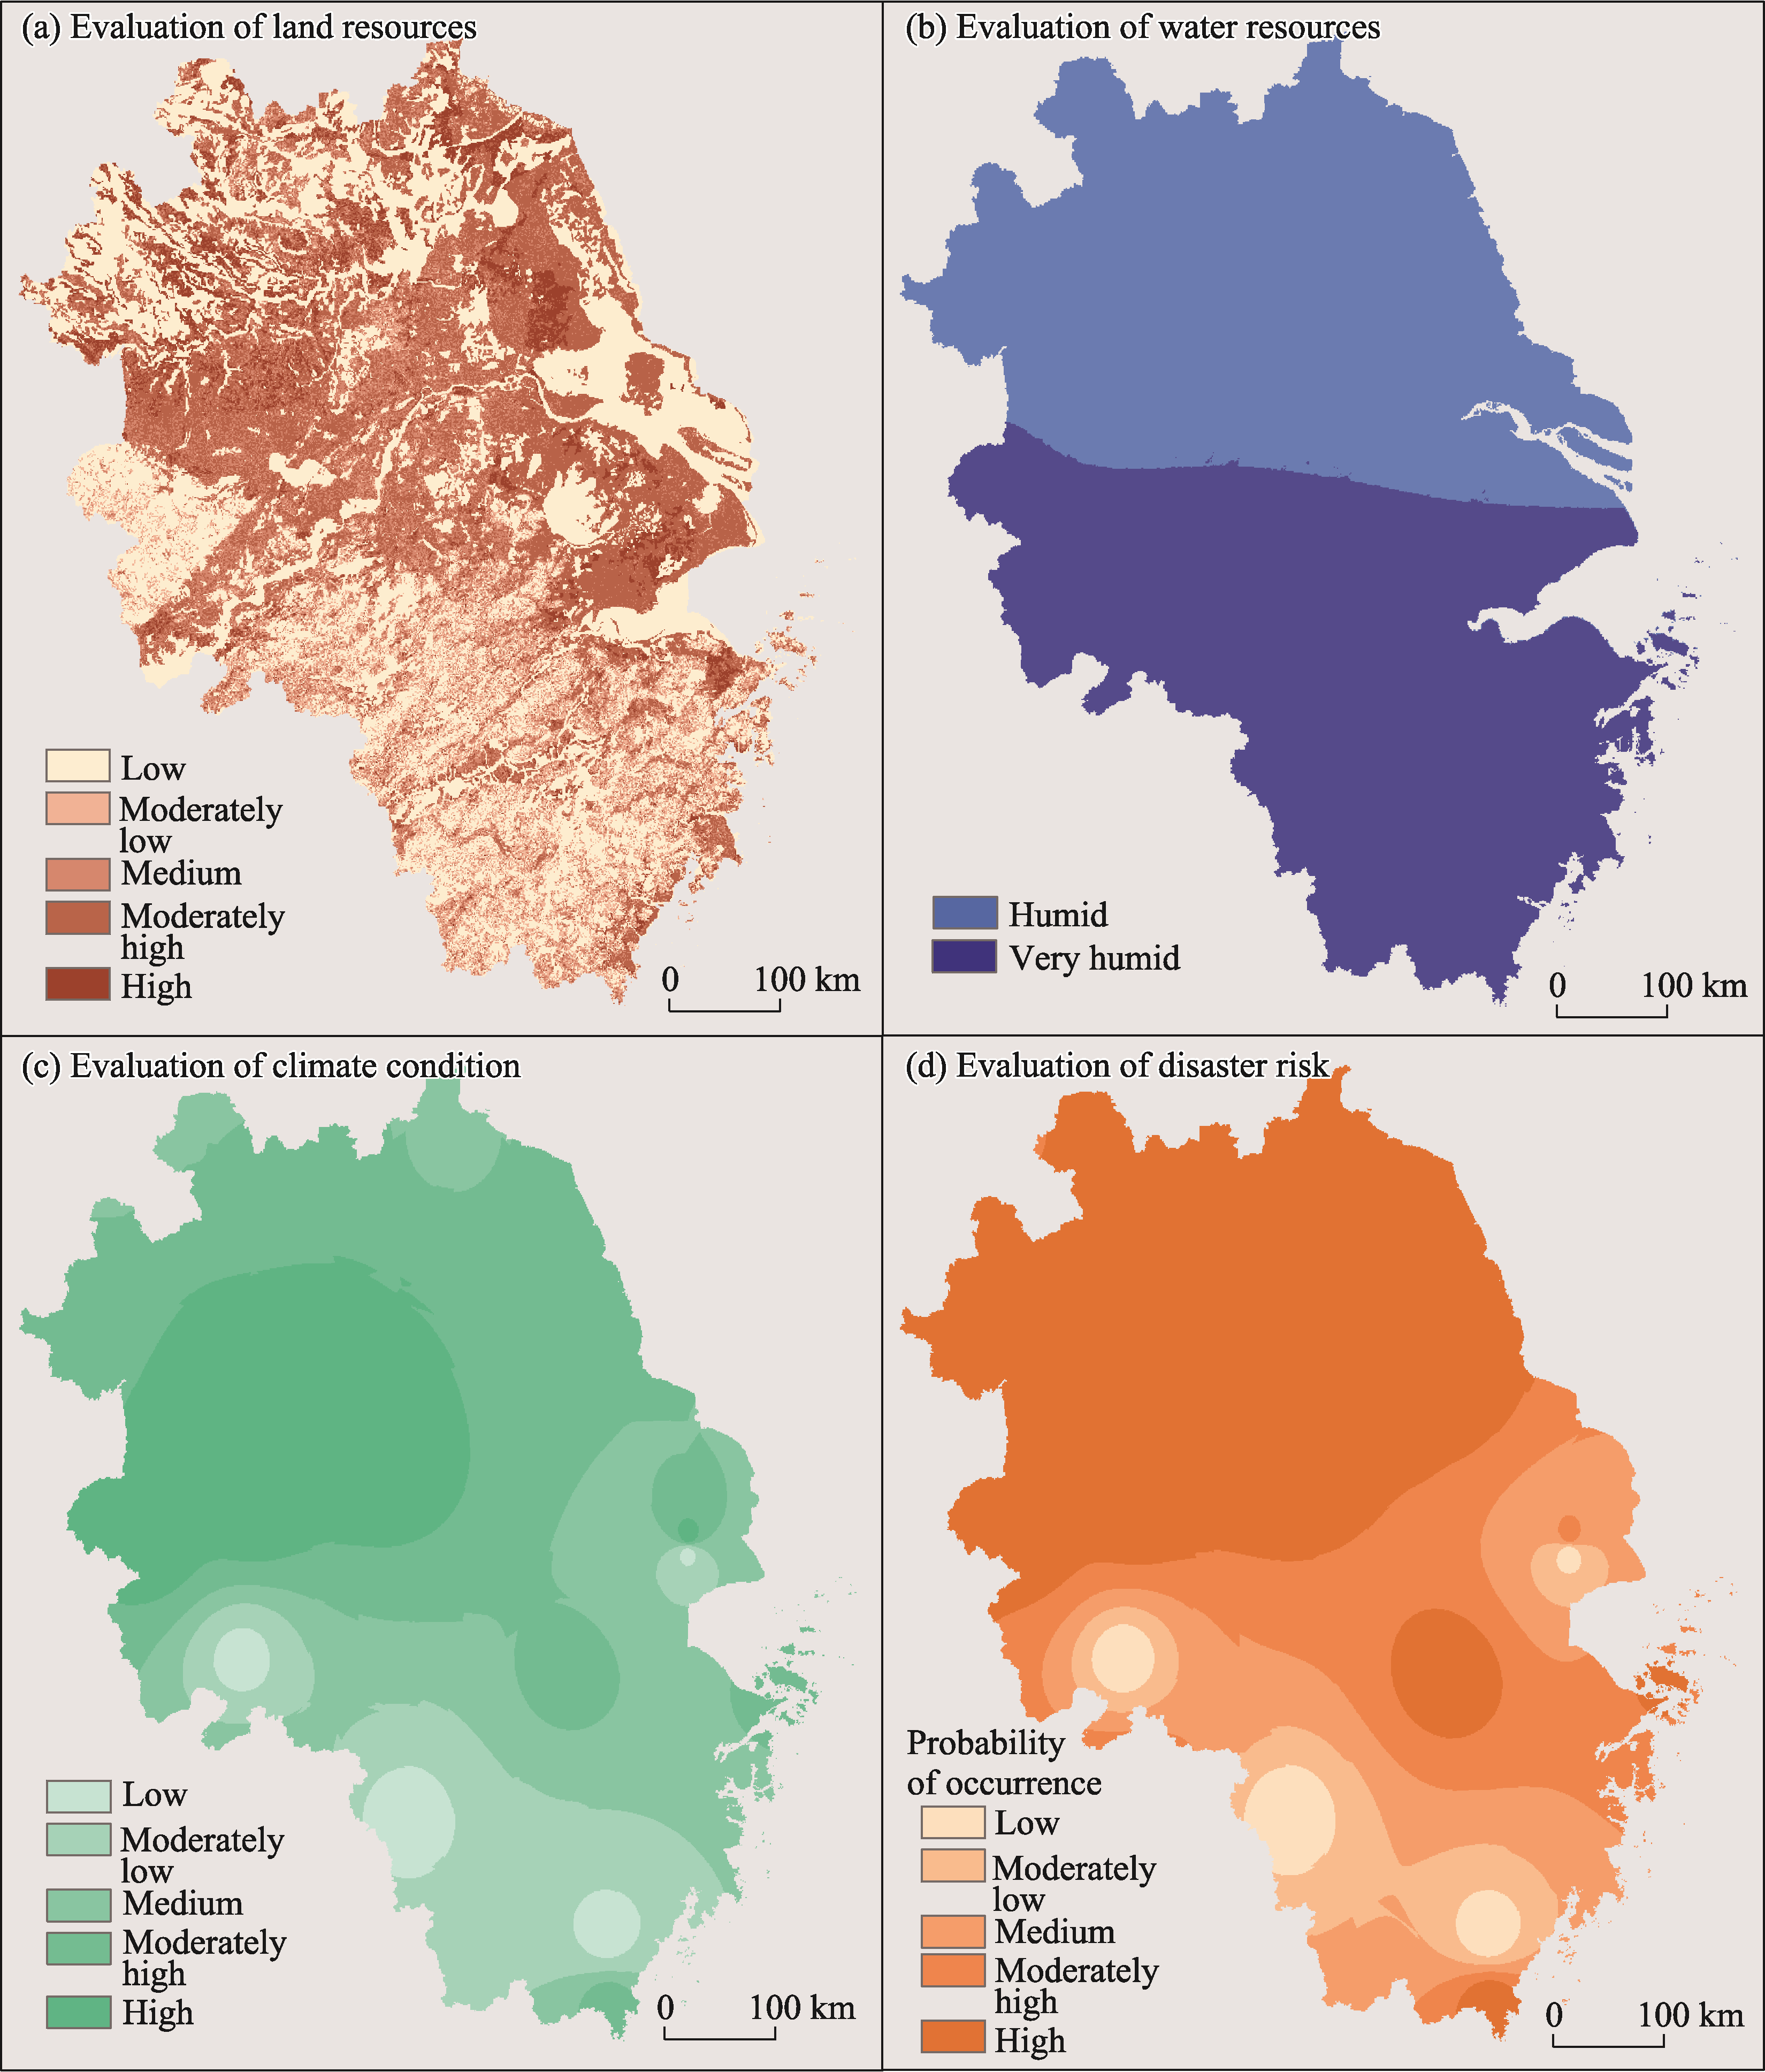
Figure 11
Integrated evaluation of urban construction suitability in the Yangtze River Delta region
Figure 12
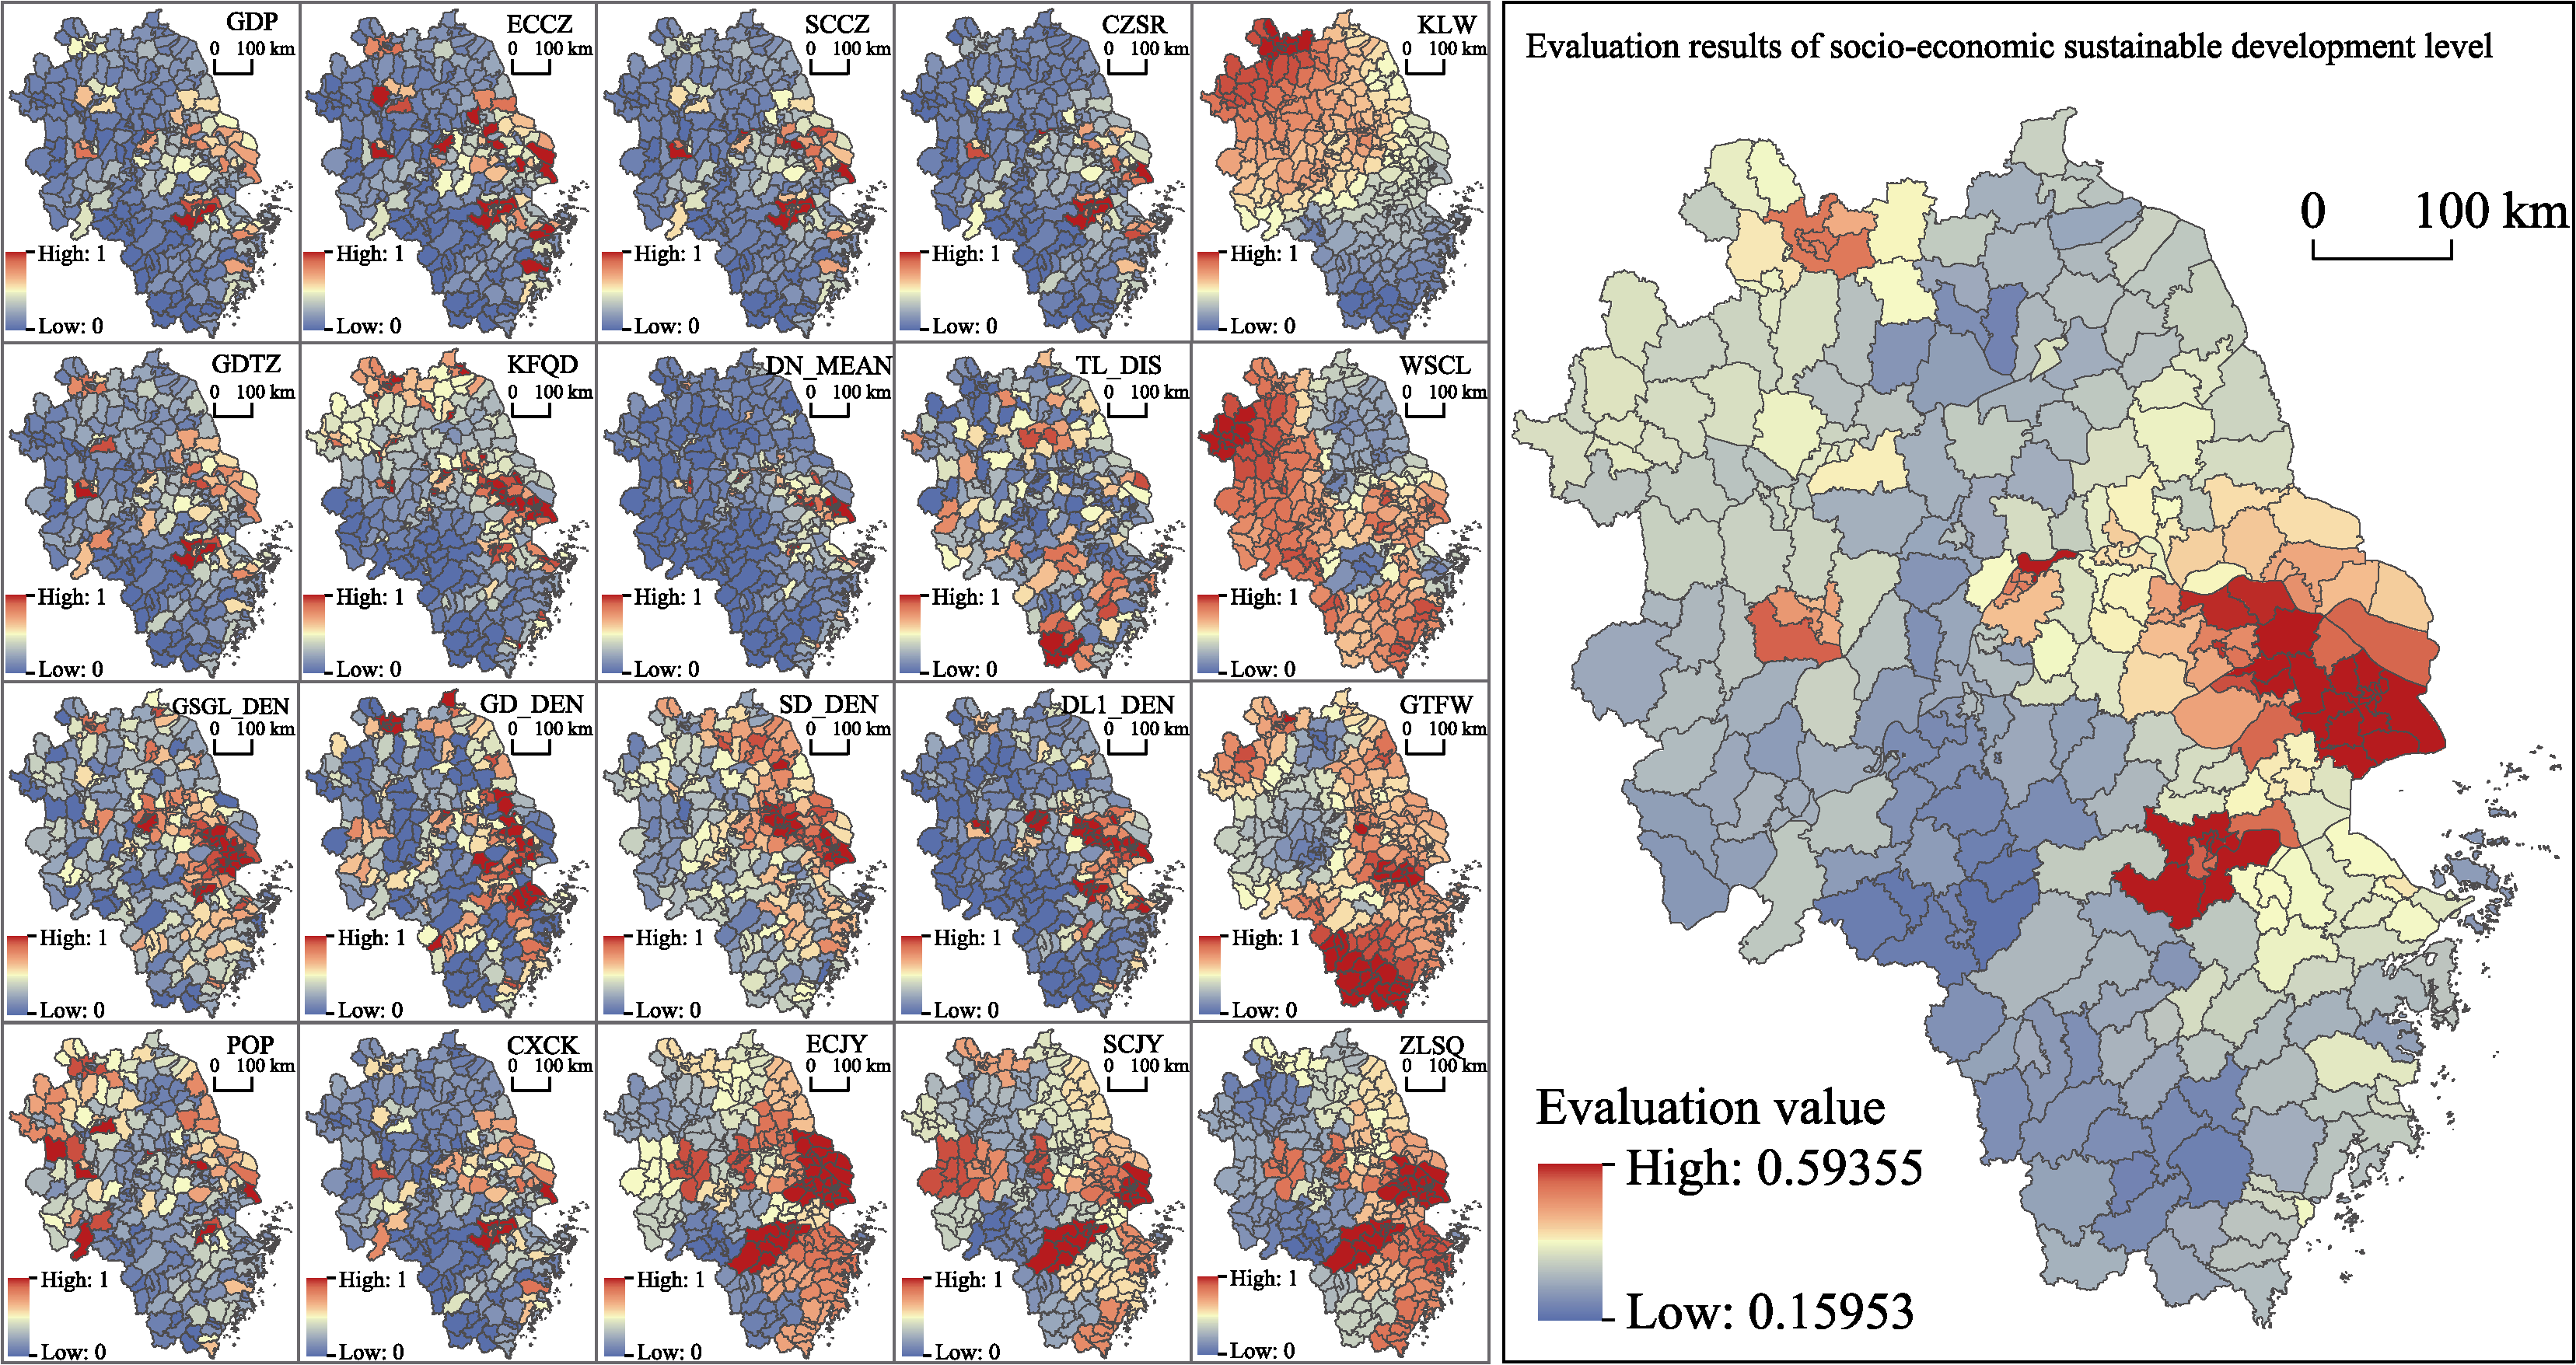
Evaluation indices and result of the socioeconomic sustainable development level in the Yangtze River Delta region
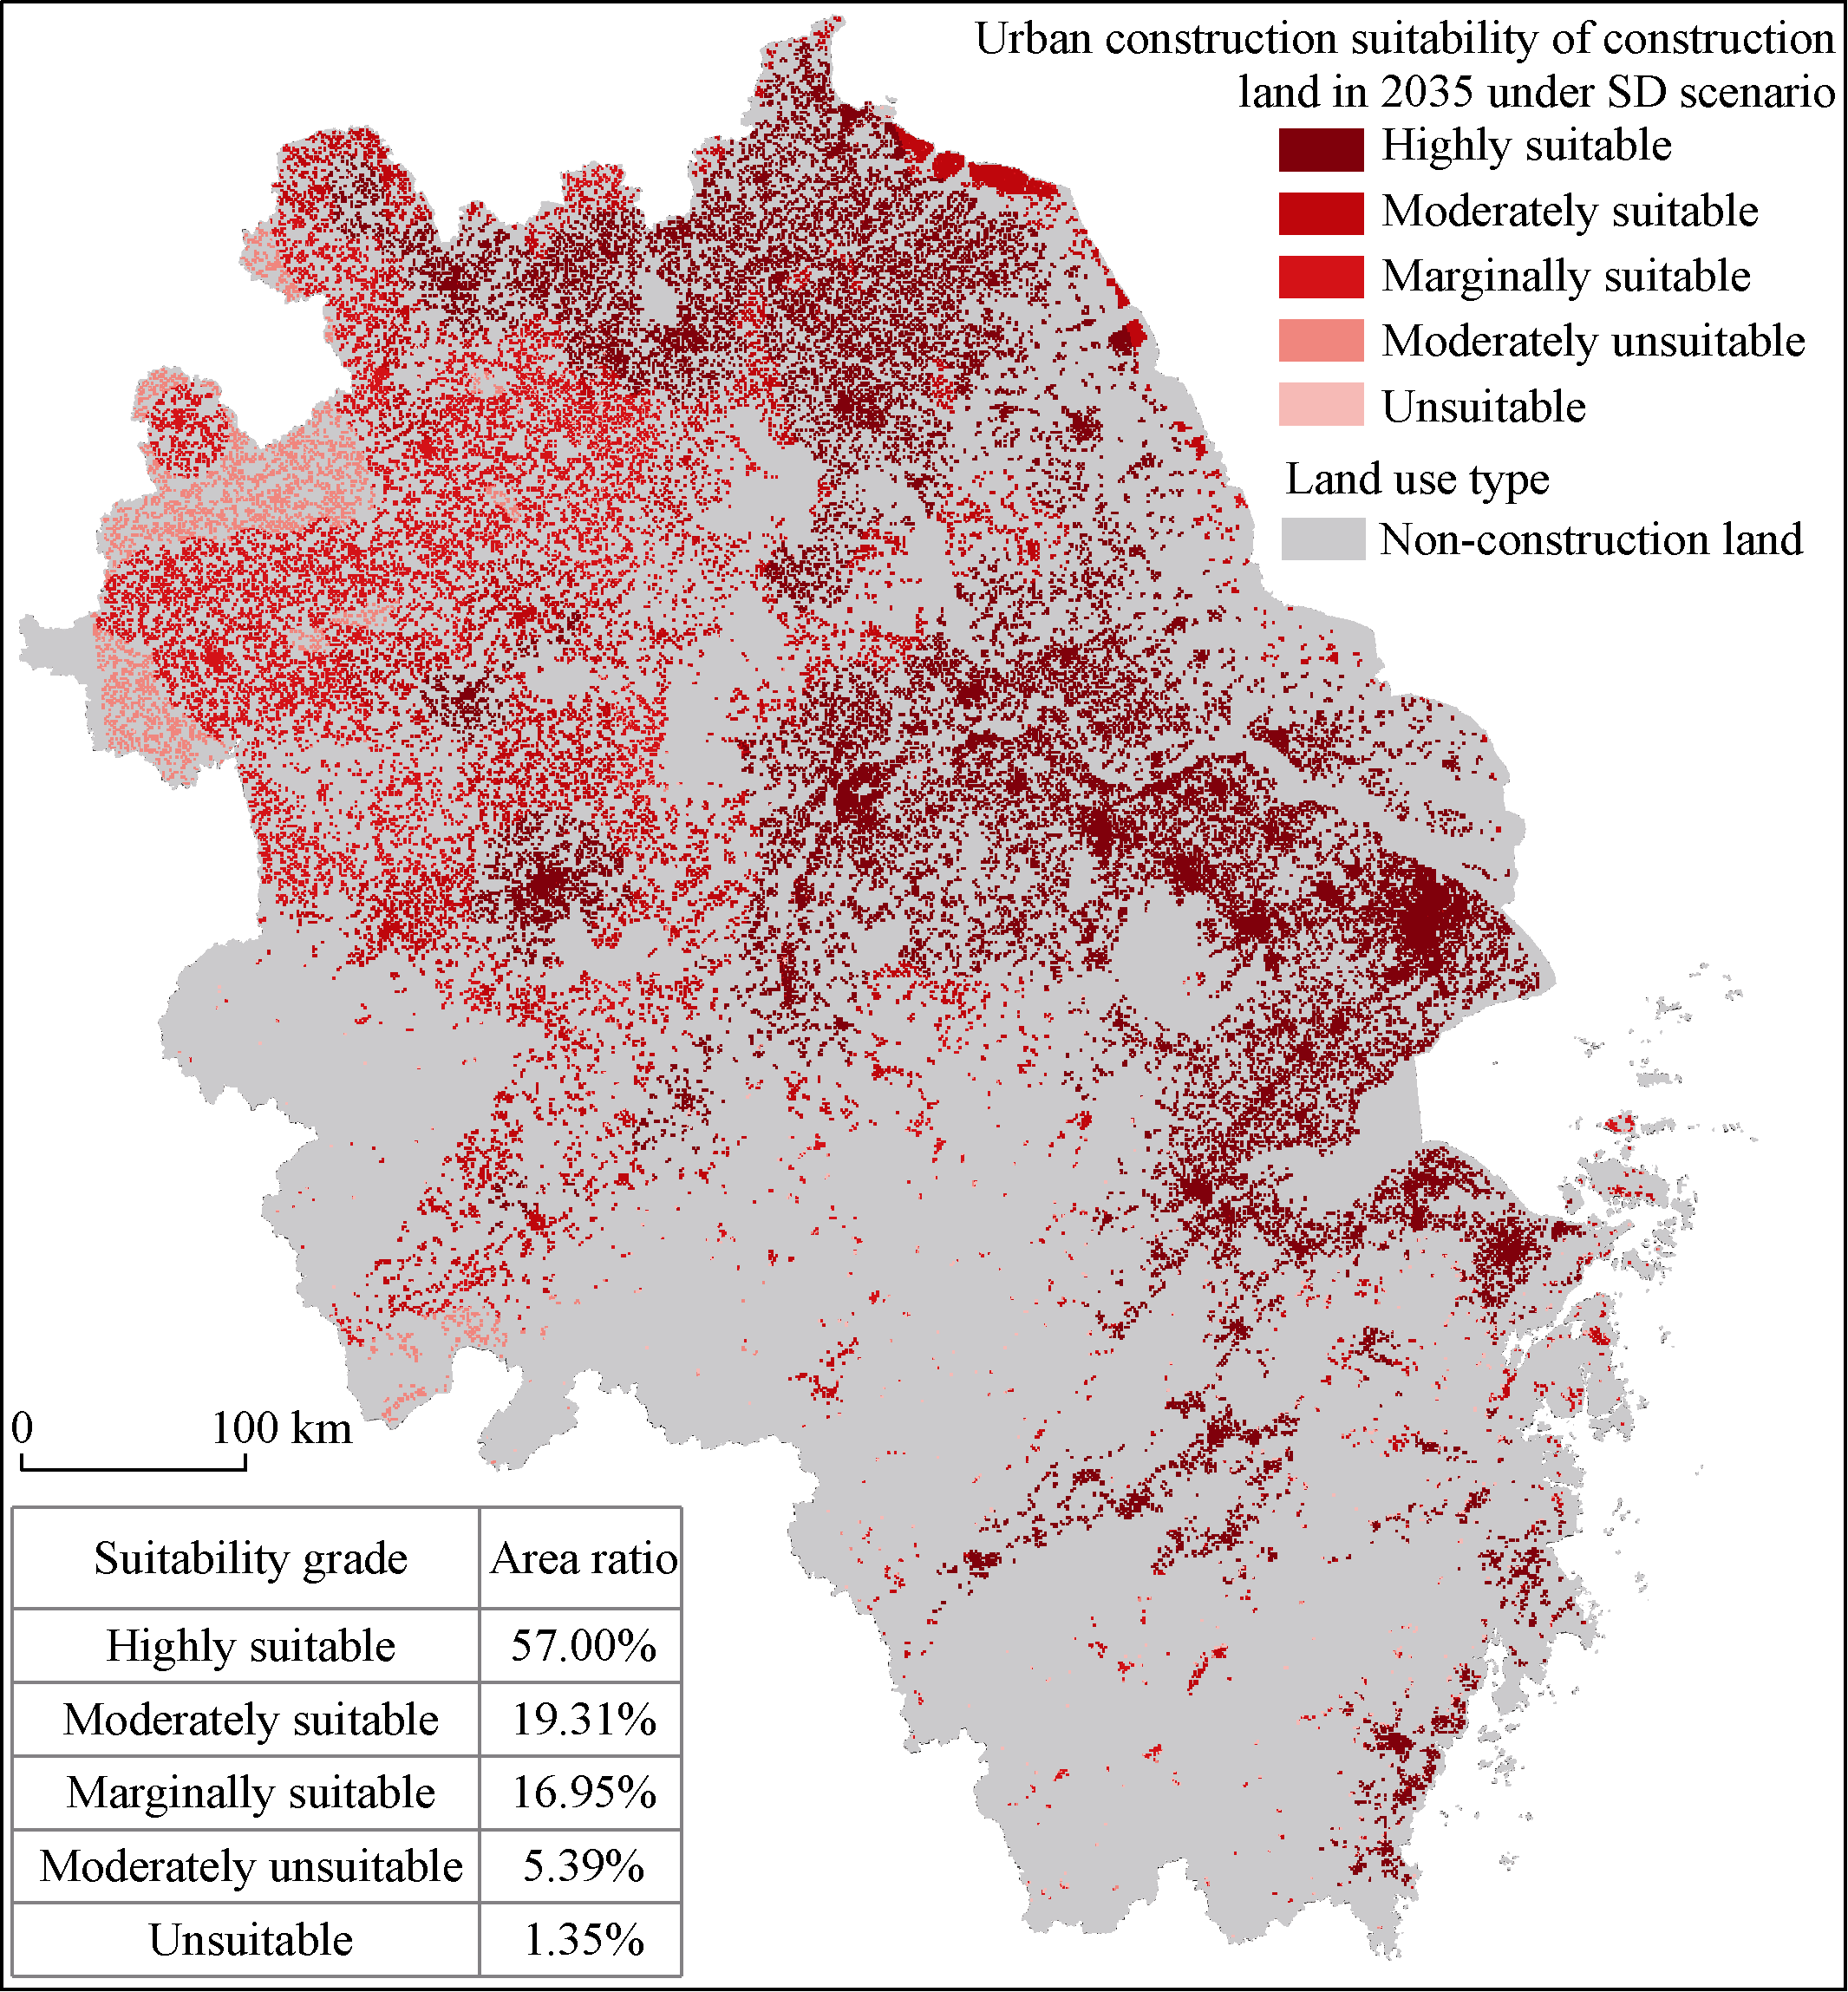
Figure 13
Urban construction suitability of construction land in 2035 under the SD scenario in the Yangtze River Delta region
Figure 14
Spatial optimization of the Yangtze River Delta region in 2035
Table S1
Land use conversion matrix under ID scenario
Table S2
Land use conversion matrix under ESP scenario
Table S3
Land use conversion matrix under EDP scenario
Table S4
Land use conversion matrix under SD scenario
Table S5
Neighborhood weight setting for each land use type under four simulated scenarios
Table S6
Weight assignment results of evaluation indicators of socio-economic sustainable development
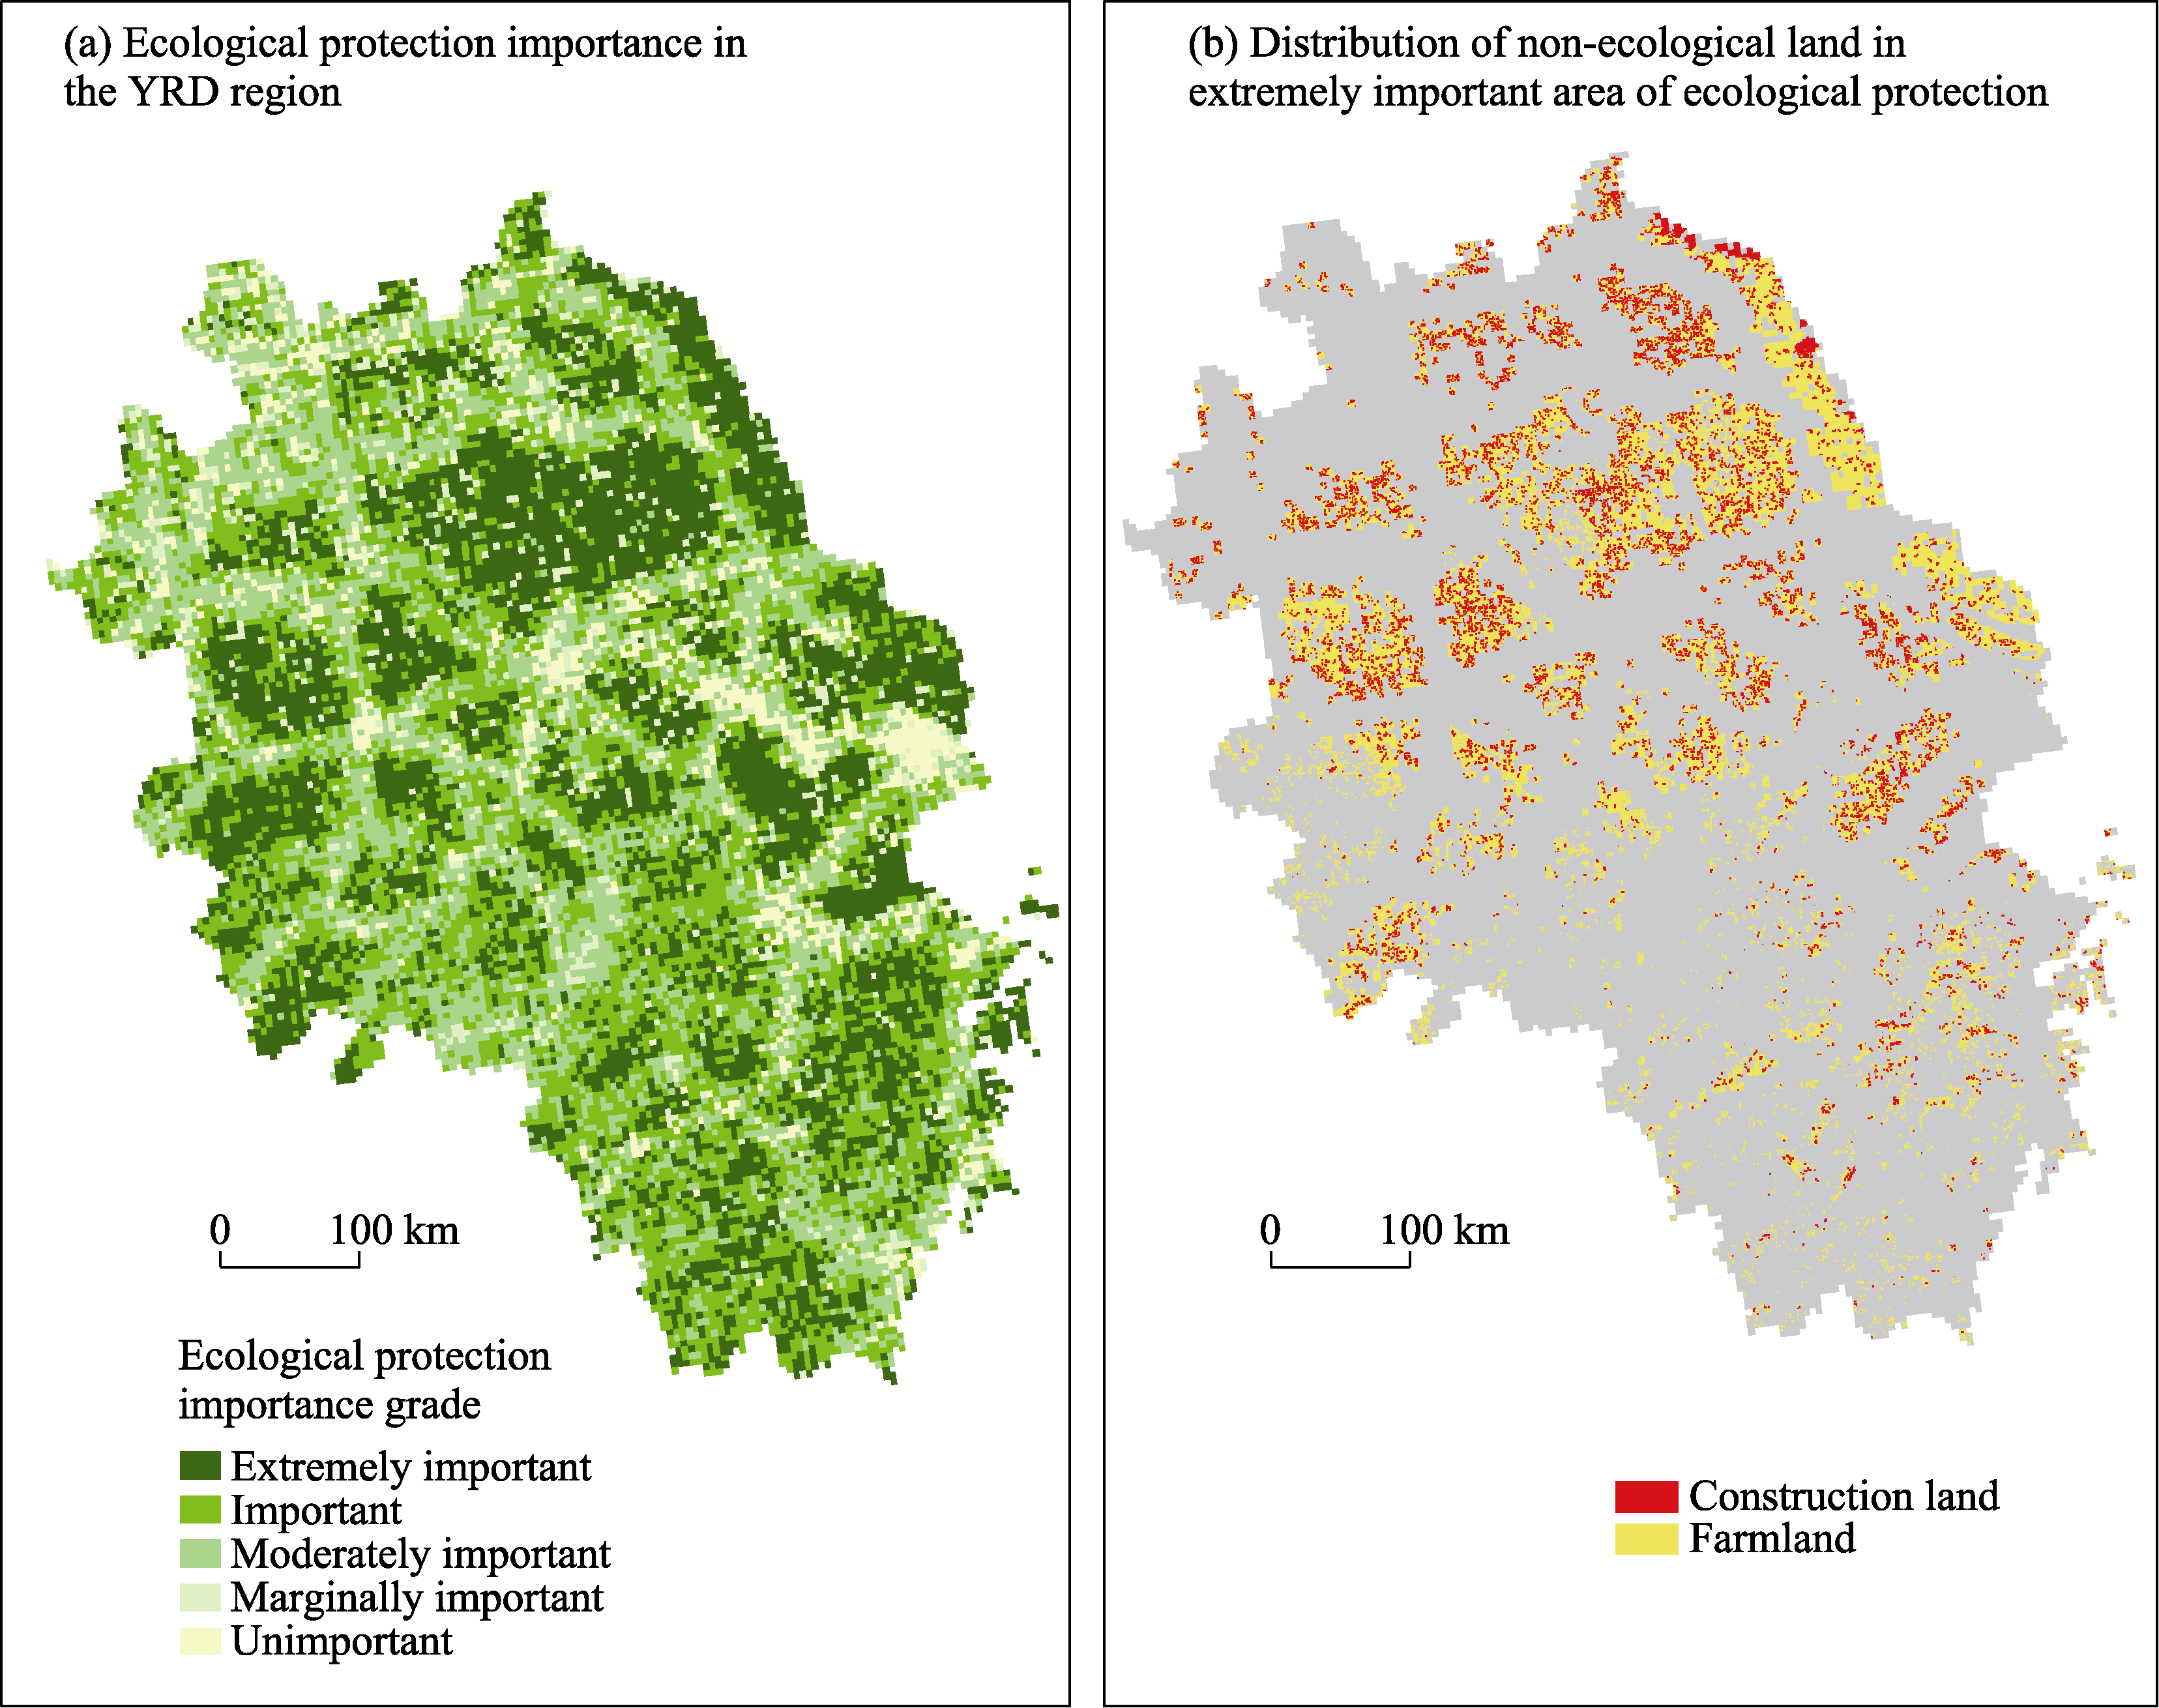
Figure S1
Ecological protecting importance in the YRD region and distribution of non-ecological land in 2035 in extremely important area of ecological protection
Figure S2
Evaluation of agricultural production suitability
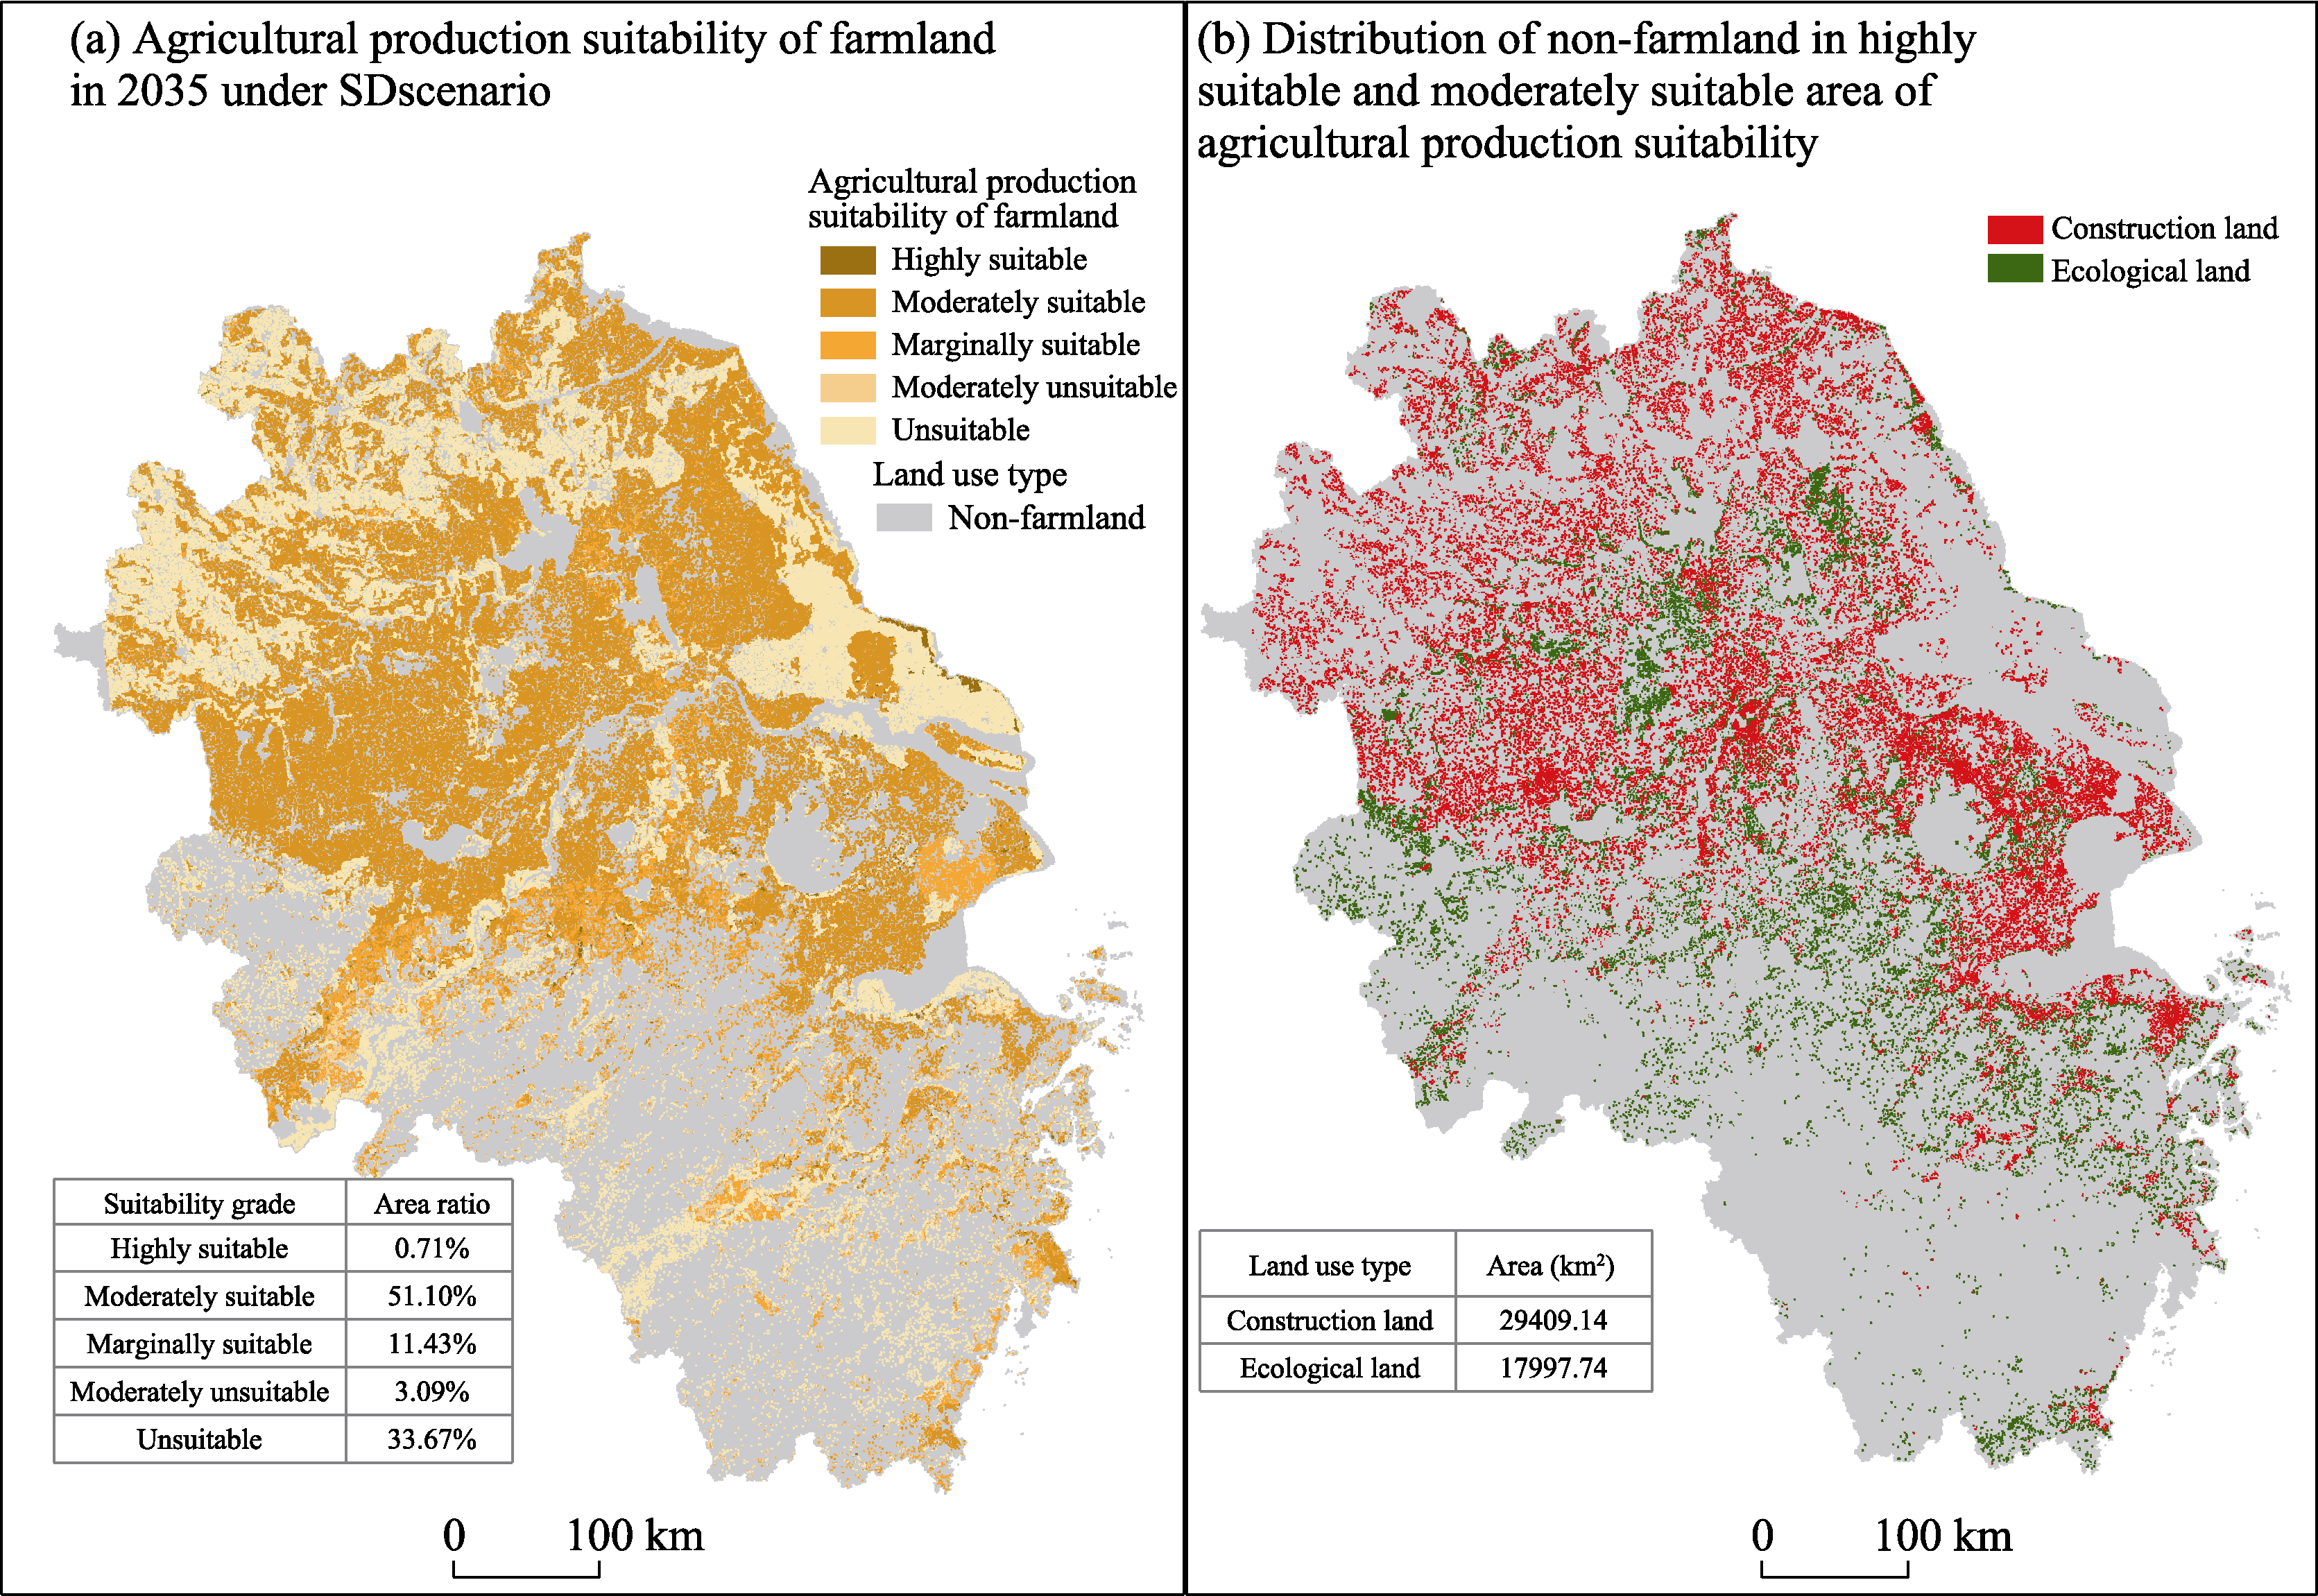
Figure S3
Agricultural production suitability of farmland in 2035 simulated under SD scenario and distribution of non-farmland simulated under SD scenario in highly suitable and moderately suitable area of agricultural production suitability
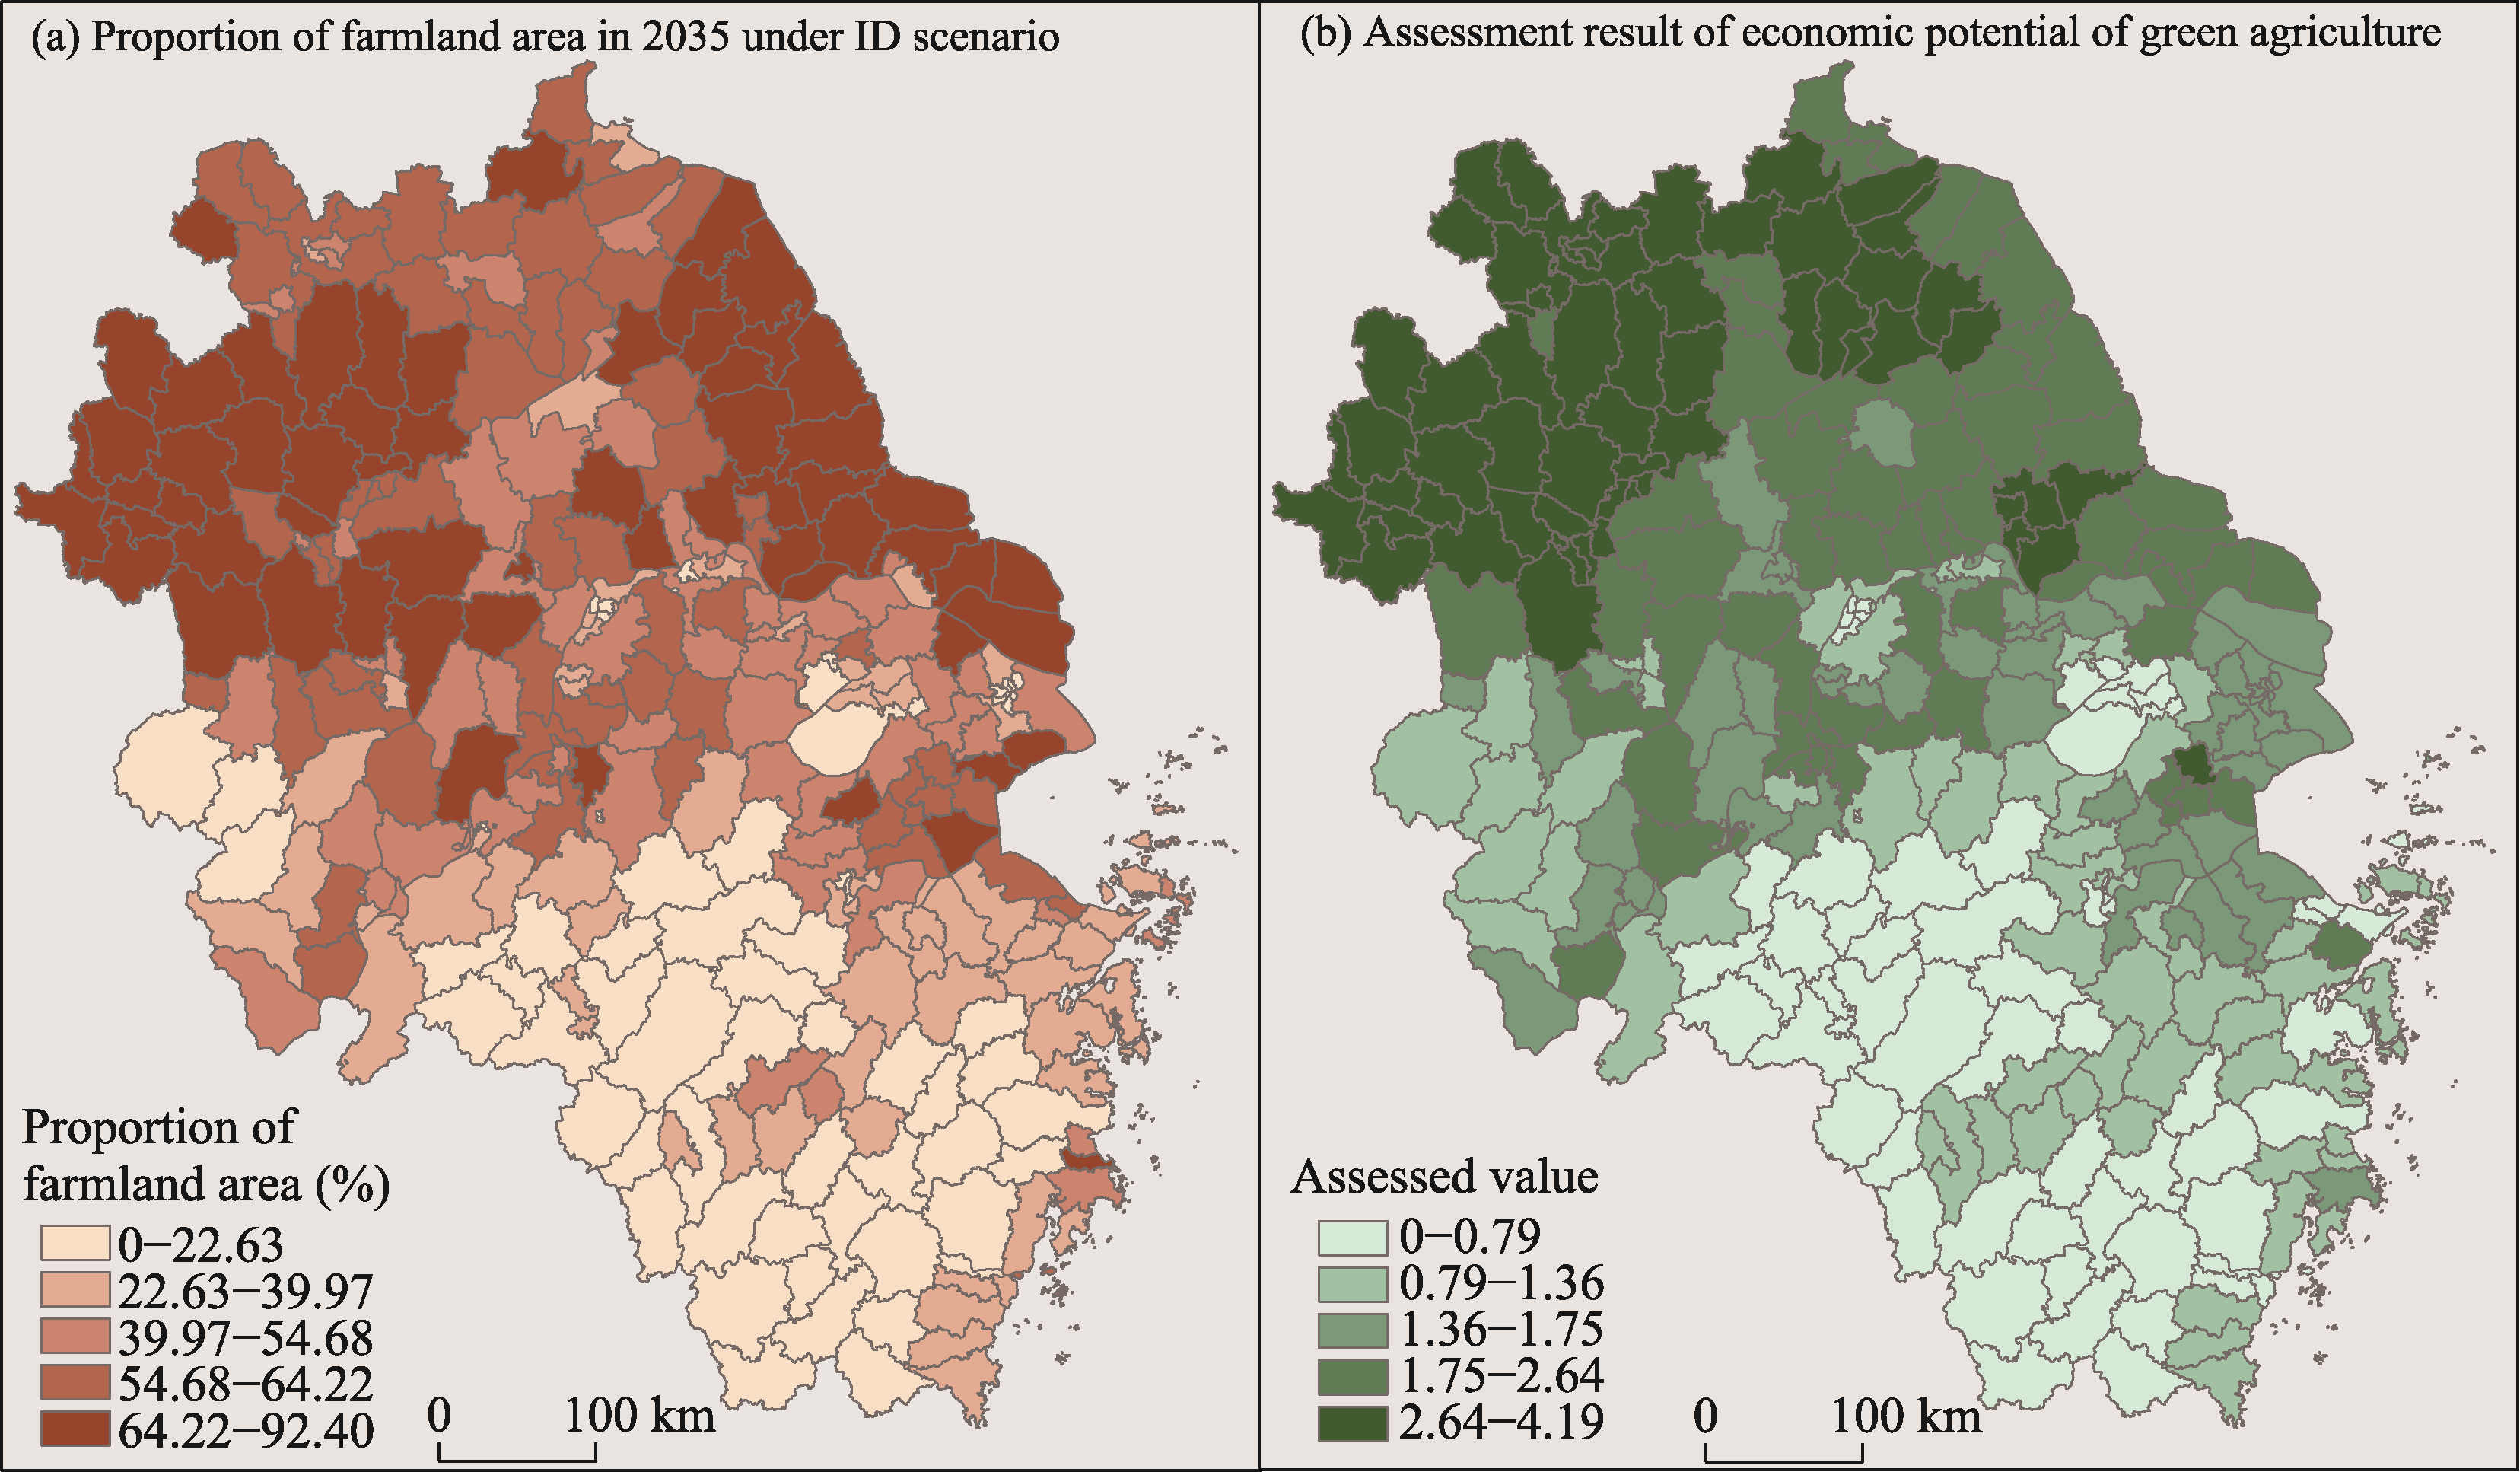
Figure S4
Spatial comparison between proportion of farmland area under ID scenario and assessment result of economic potential of green agriculture in the YRD region
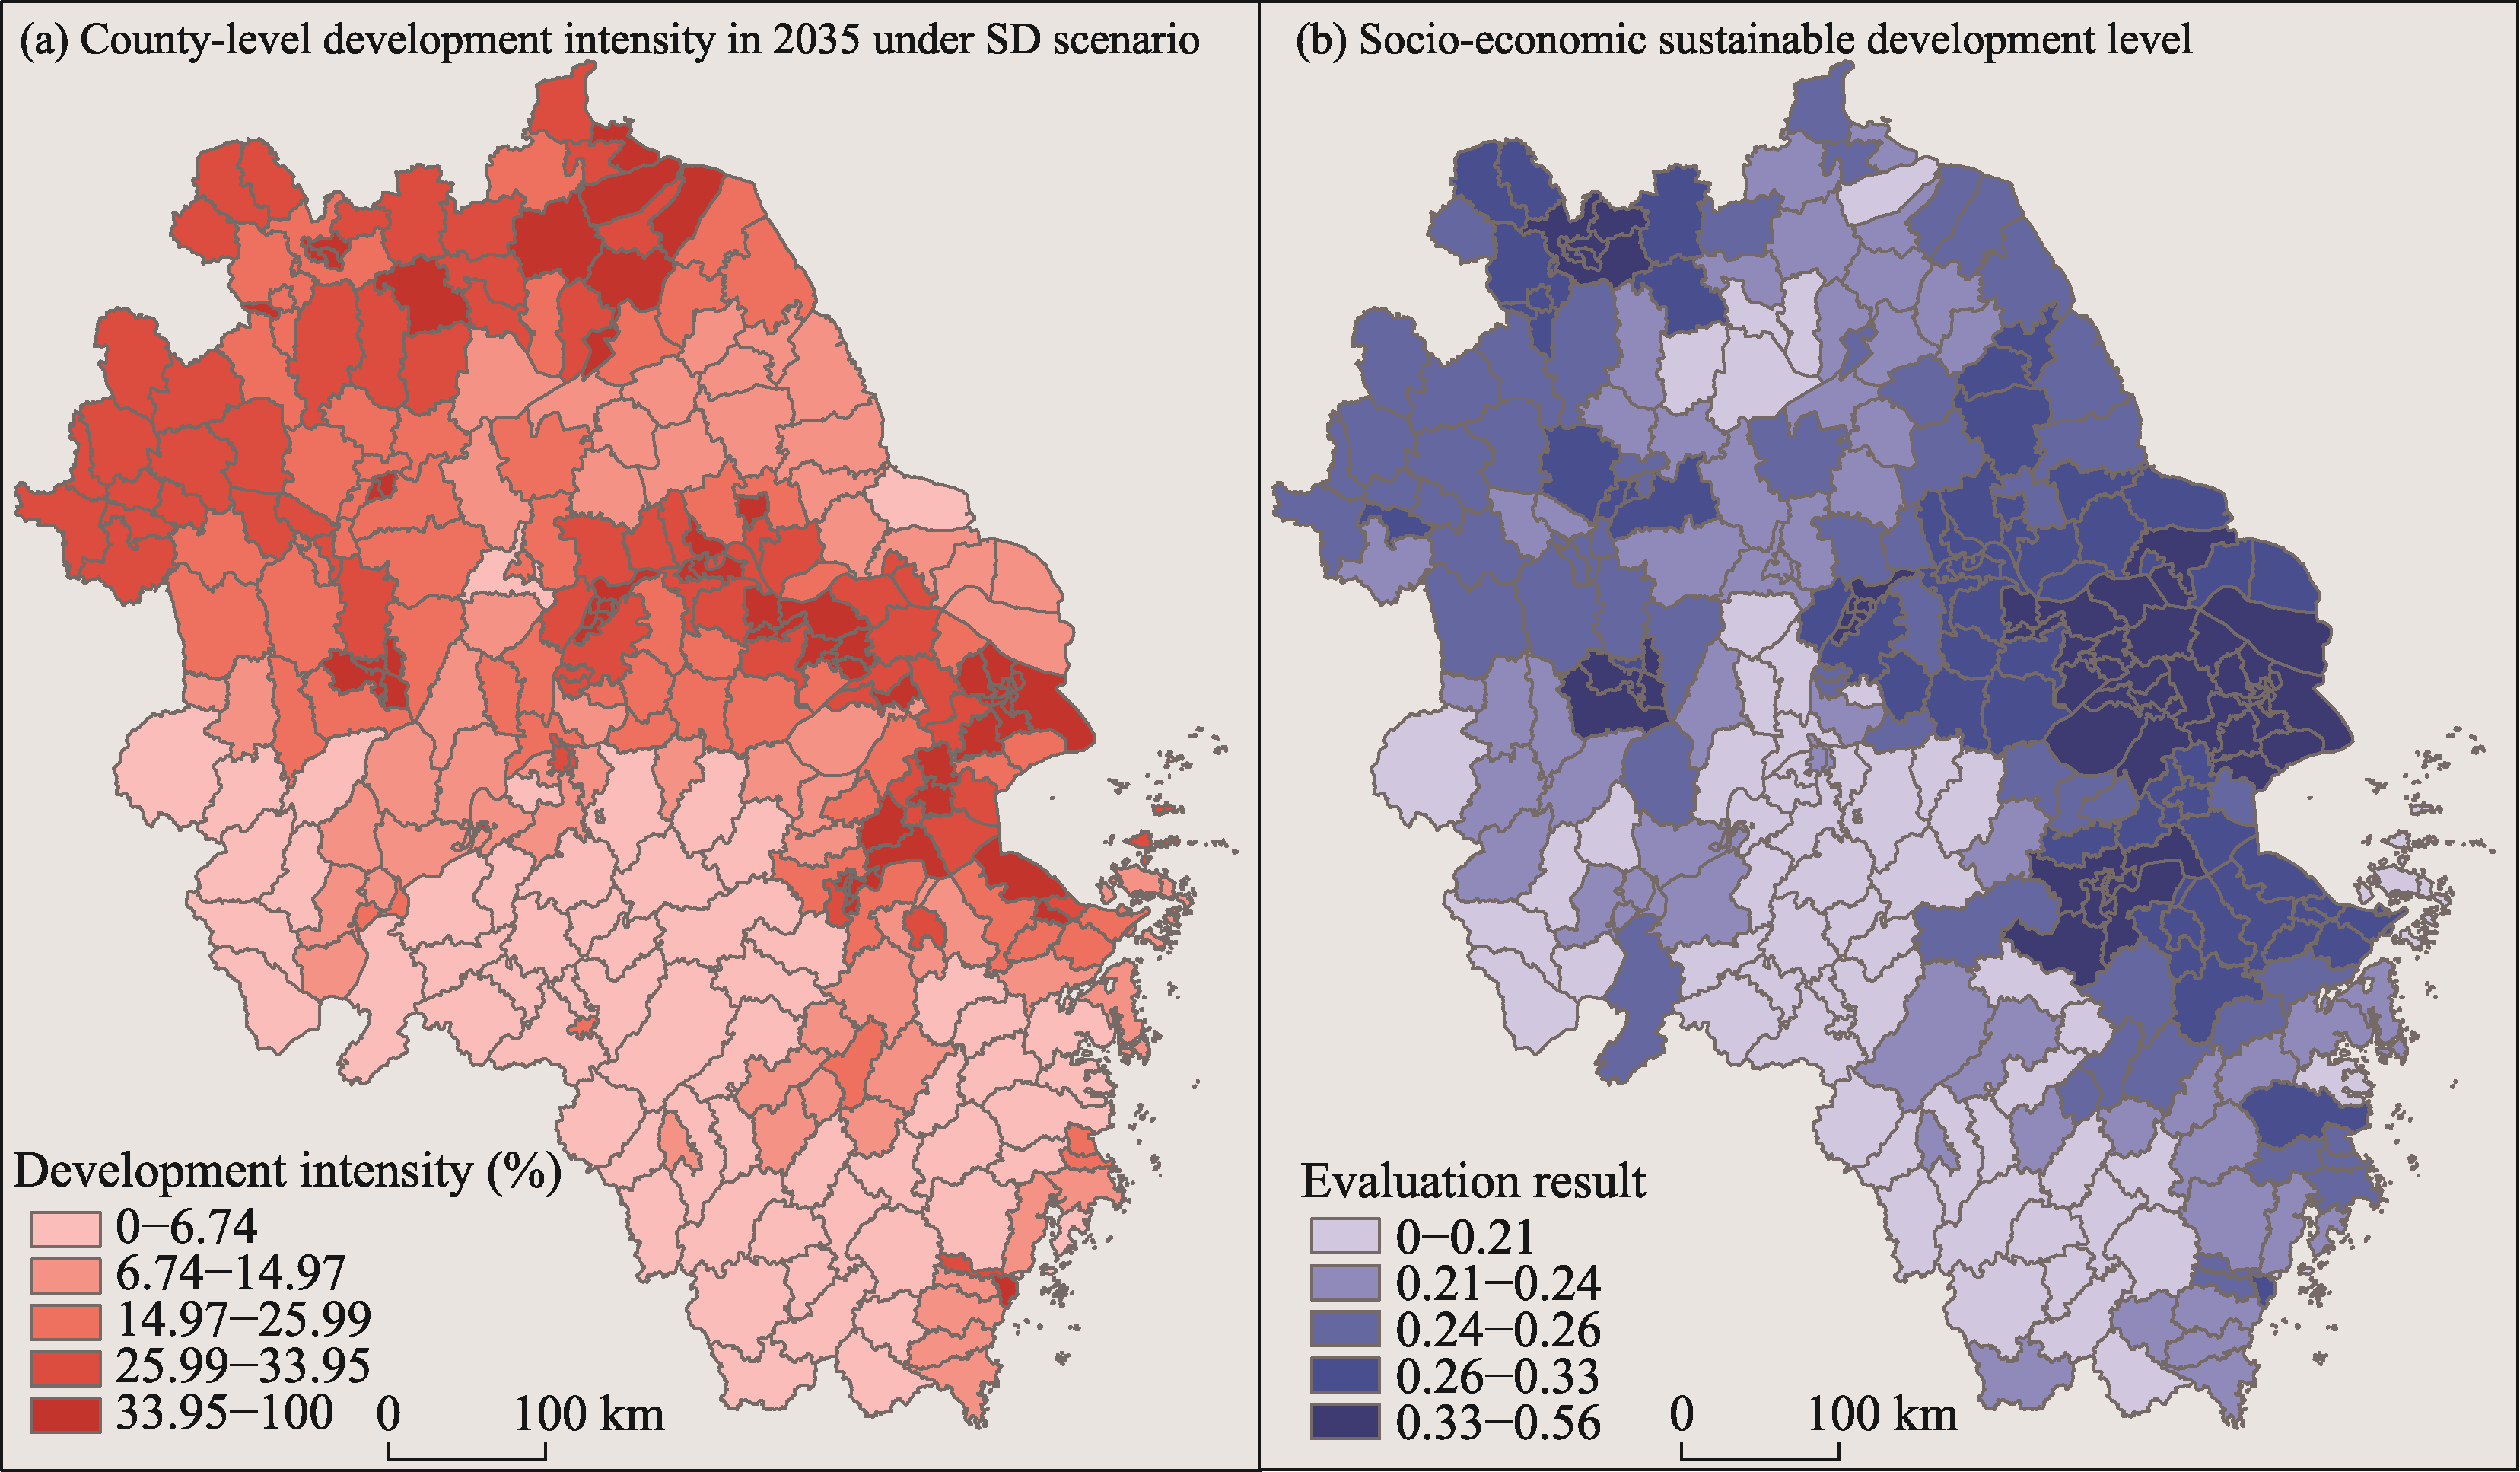
Figure S5
Spatial comparison between development intensity under SD scenario and socioeconomic sustainable development level in the YRD region
Table S7
Soil and water resources base discrimination matrix
Table S8
Discriminant matrix of agricultural production conditions
Table S9
Evaluation matrix of suitability grade of agricultural production modified by disaster risk evaluation
Table S10
Climatic comfort grading standard
Table S11
Grading standard of quiet wind days
Table S12
Grading standard of average wind speed over many years
Table S13
Soil and water resources base discrimination matrix
Table S14
Evaluation matrix of suitability grade of urban construction modified by atmospheric environmental capacity evaluation
Table S15
Evaluation matrix of suitability grade of urban construction modified by climatic comfort evaluation
Table S16
Evaluation matrix of suitability grade of urban construction modified by location superiority evaluation