| Indicator name | Description | Equation |
|---|---|---|
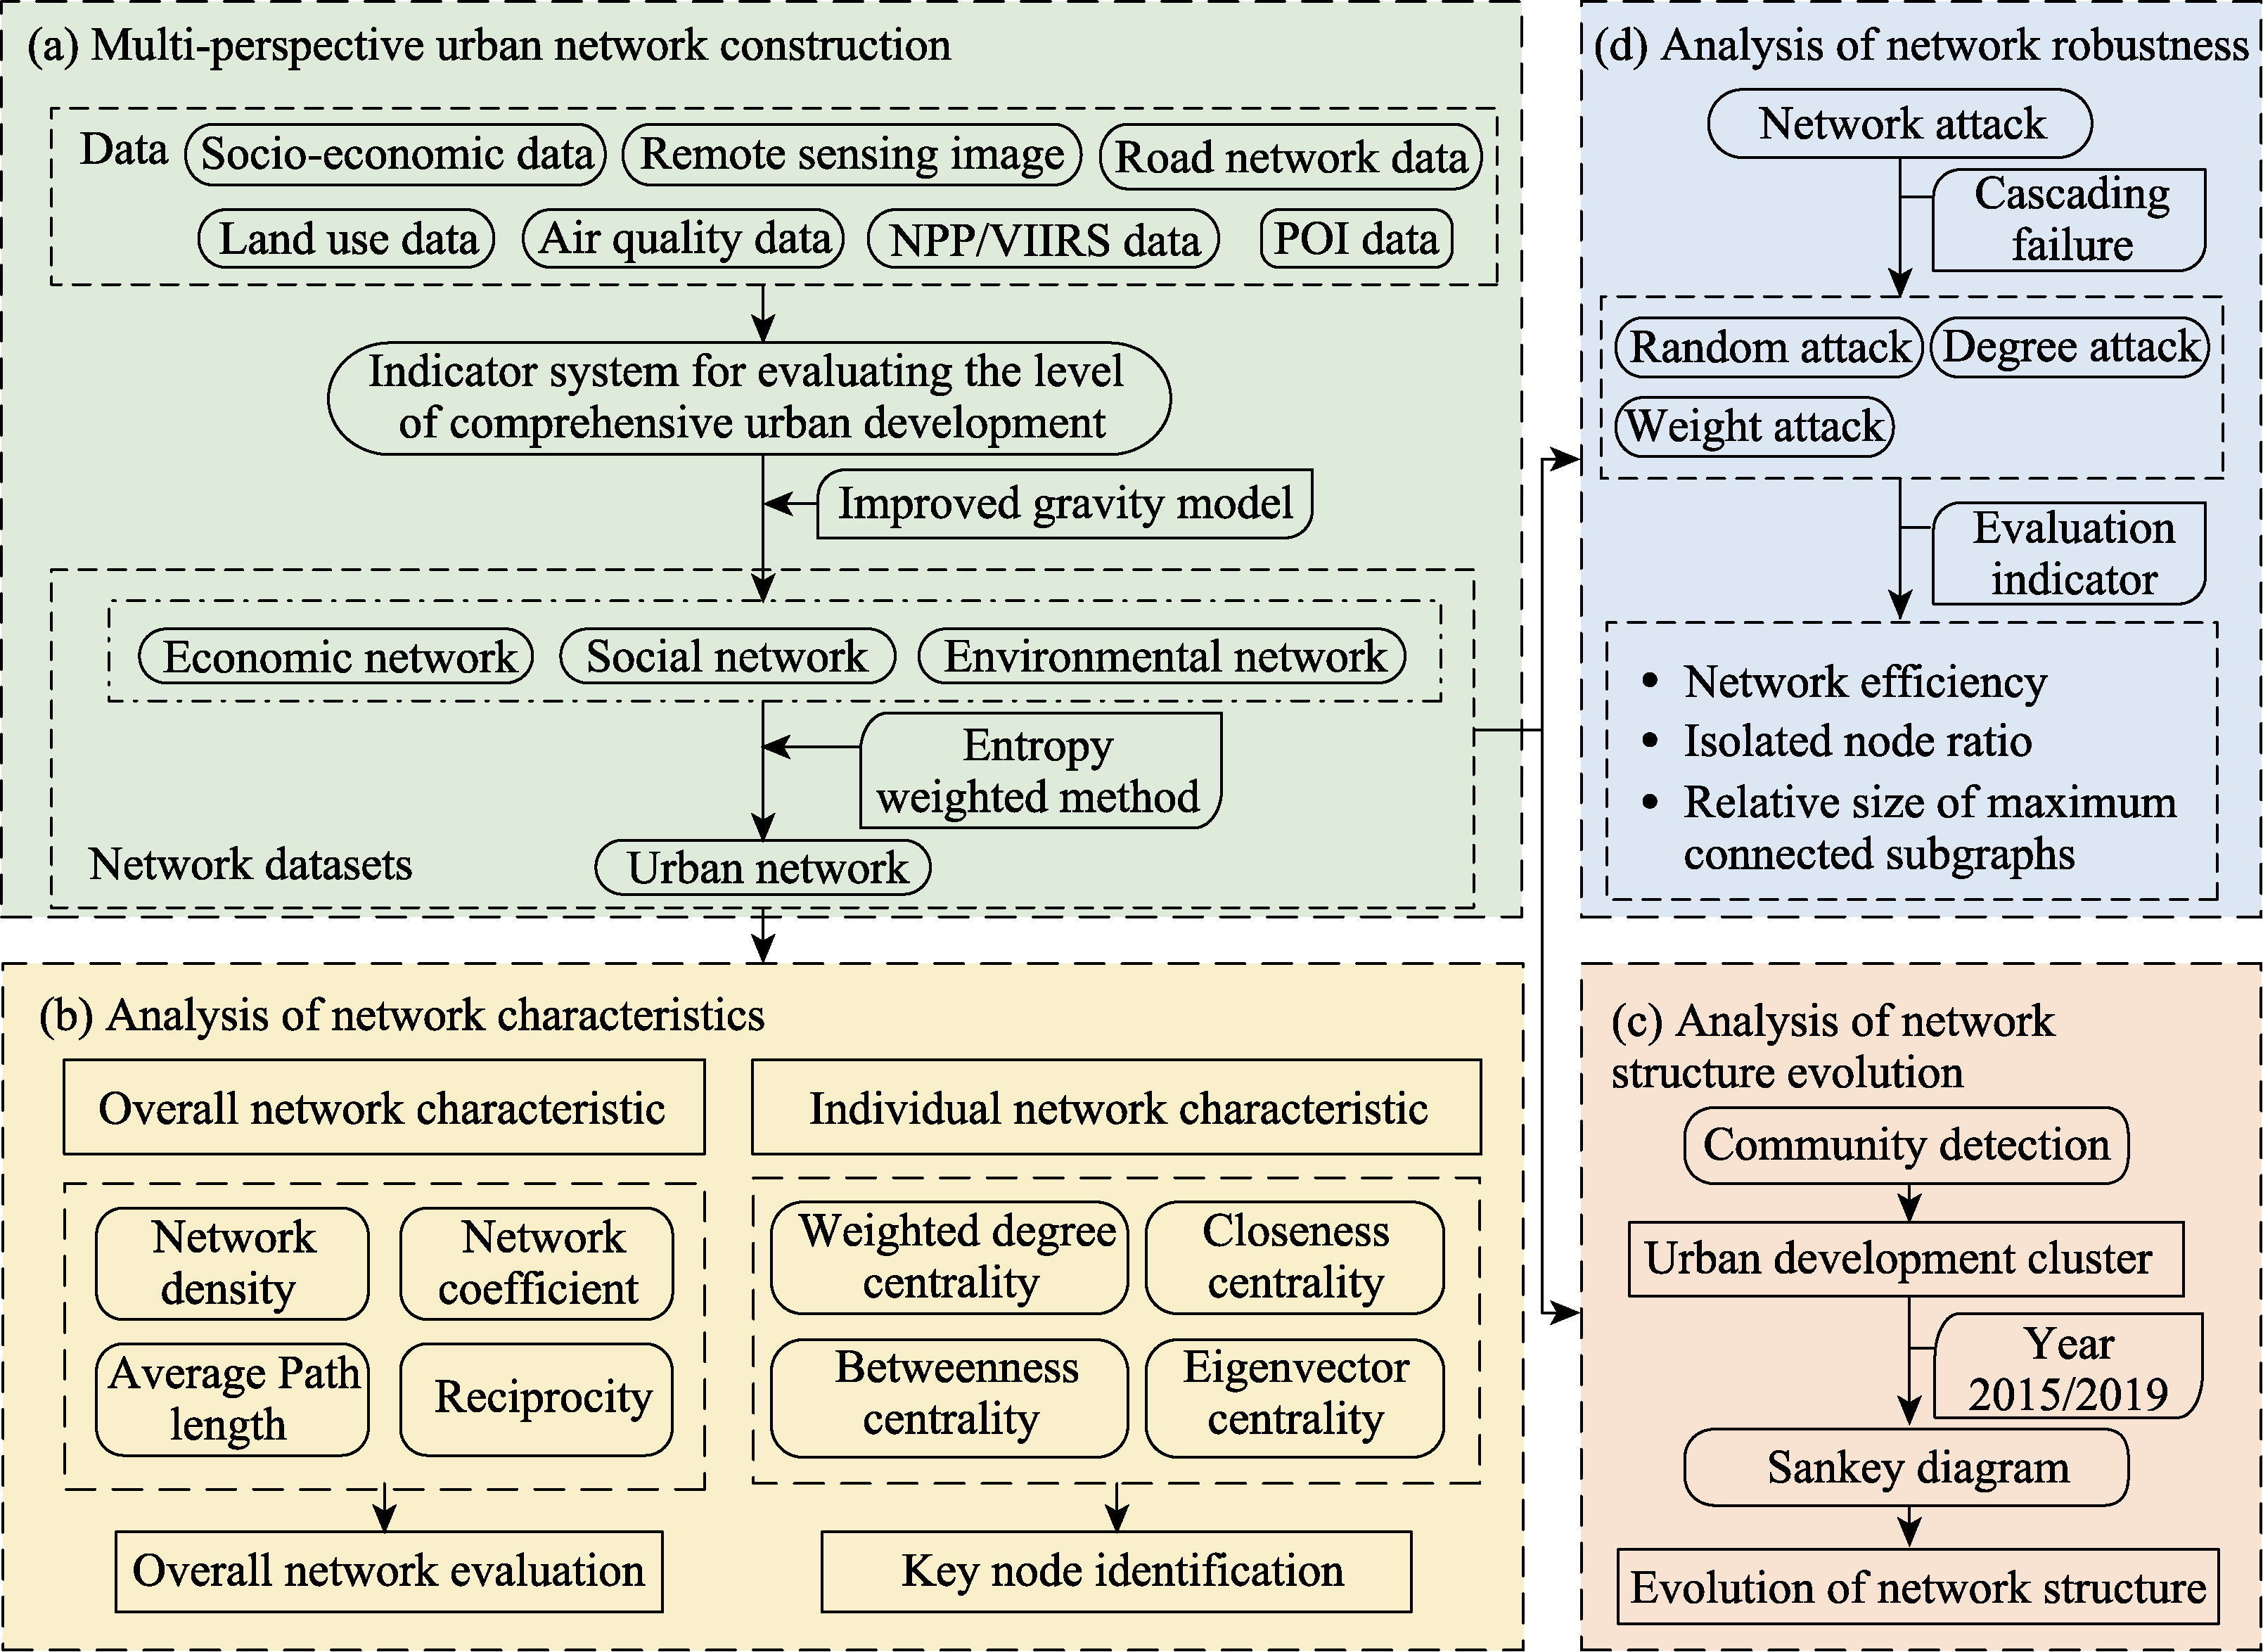
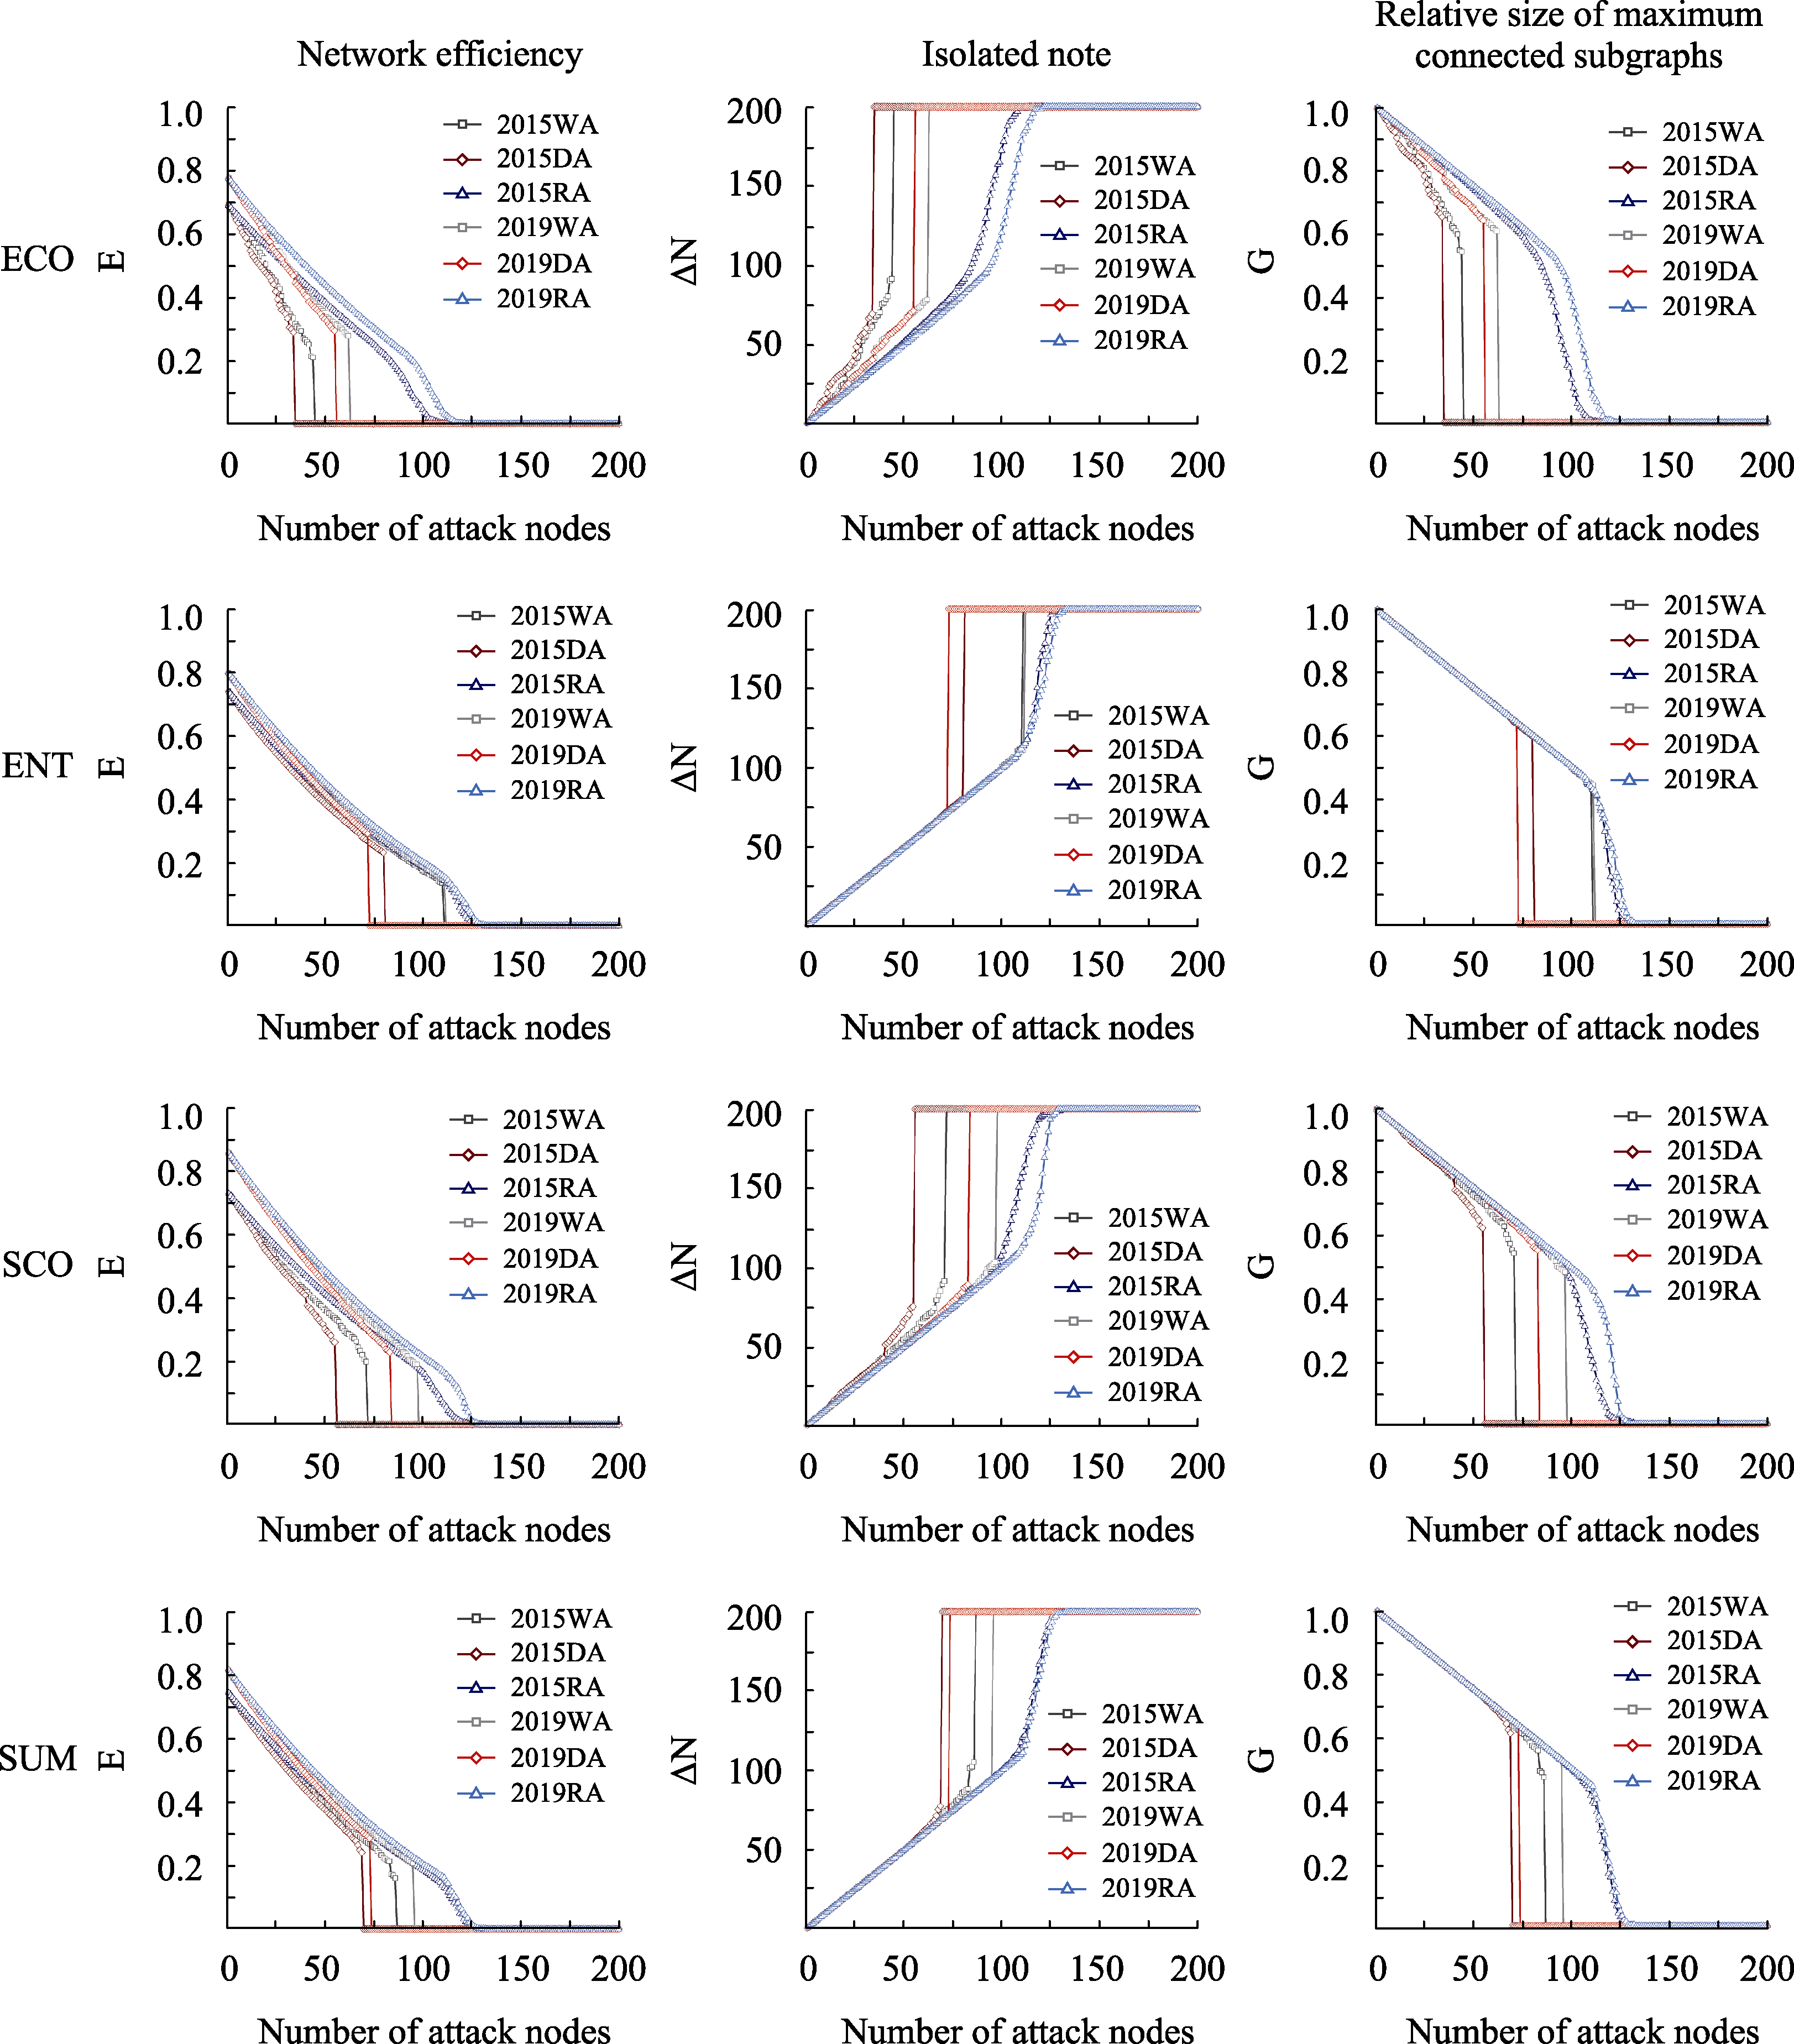
| Network efficiency | Reflects the ease of network operation, the more efficient the network, the better the network connectivity | $E=\frac{1}{n\left( n-1 \right)}\sum\limits_{i=1}^{n}{\sum\limits_{j=1\left( i\ne j \right)}^{n}{{{H}_{ij}}}}$ (12) |
| Isolated node ratio | Reflects the proportion of nodes that have no edges connected to them when the network is under attack | $\Delta N=\left( 1-\frac{{{n}^{*}}}{n} \right)*100%$ (13) |
| Relative size of maximum connected subgraphs | Reflects the size of the largest subgraph during network fragmentation in the event of an attack, providing a visual representation of the extent of network disruption | $G=\frac{{{P}^{*}}}{P}$ (14) |