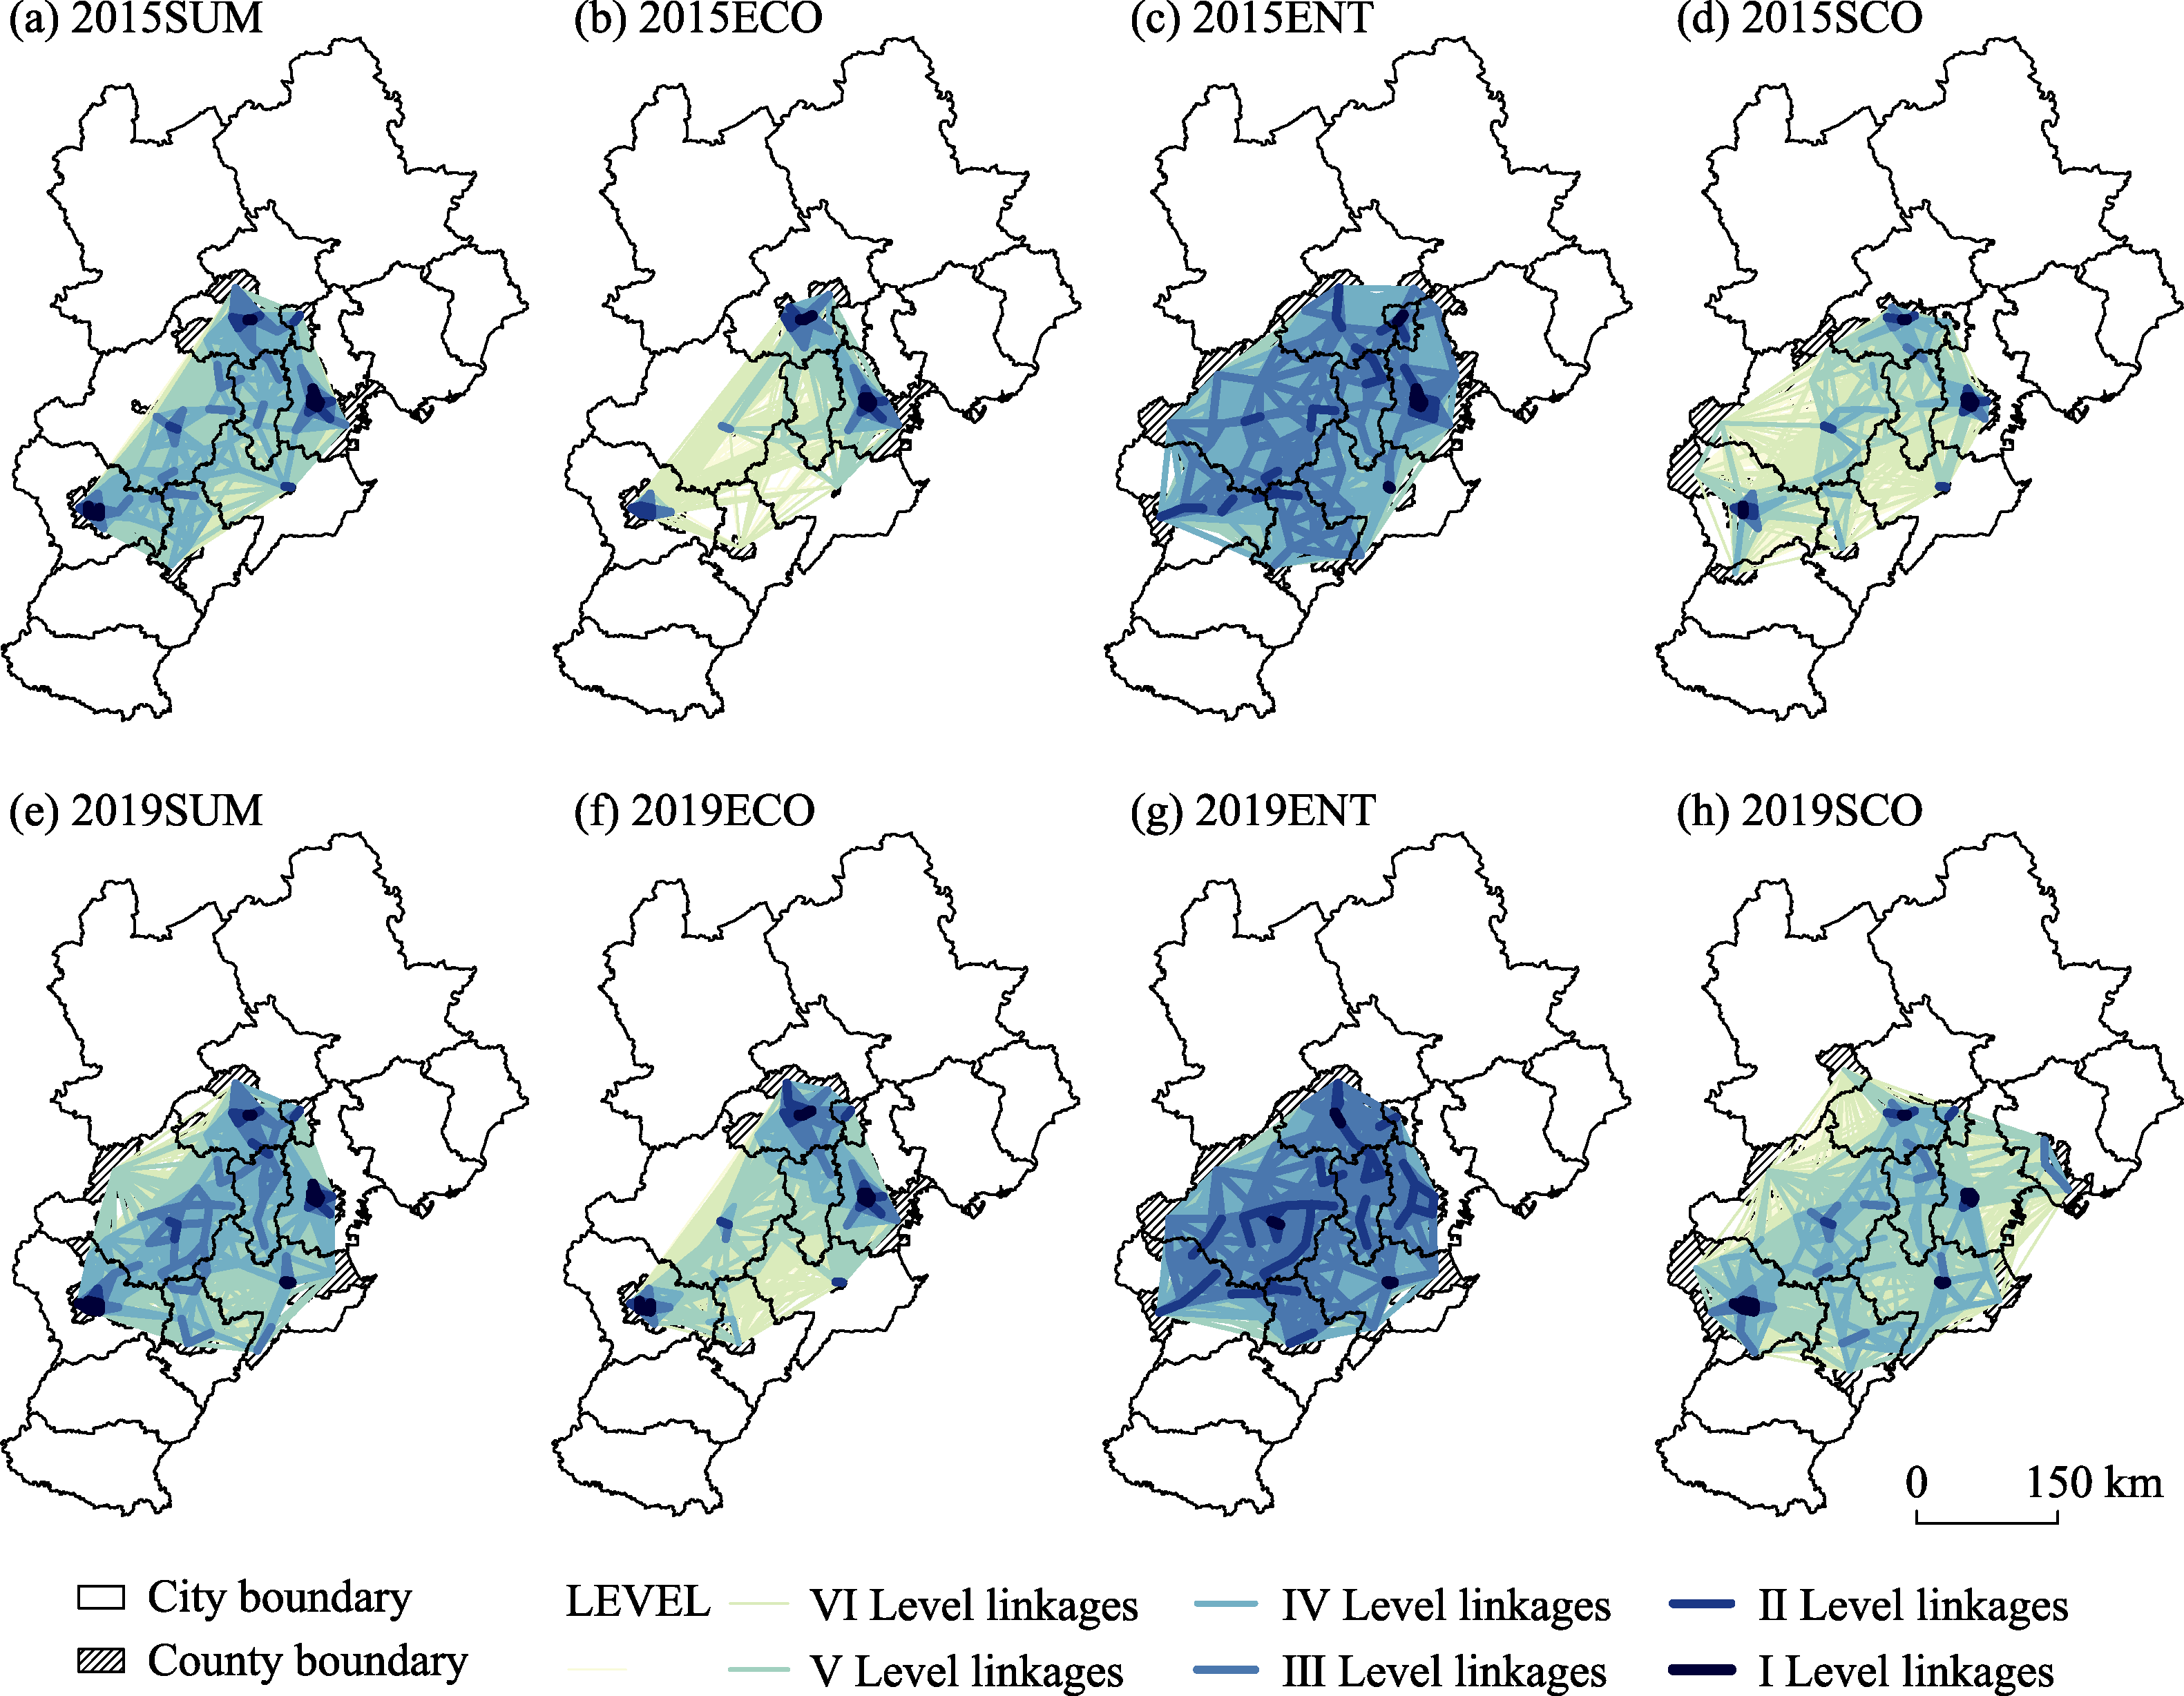
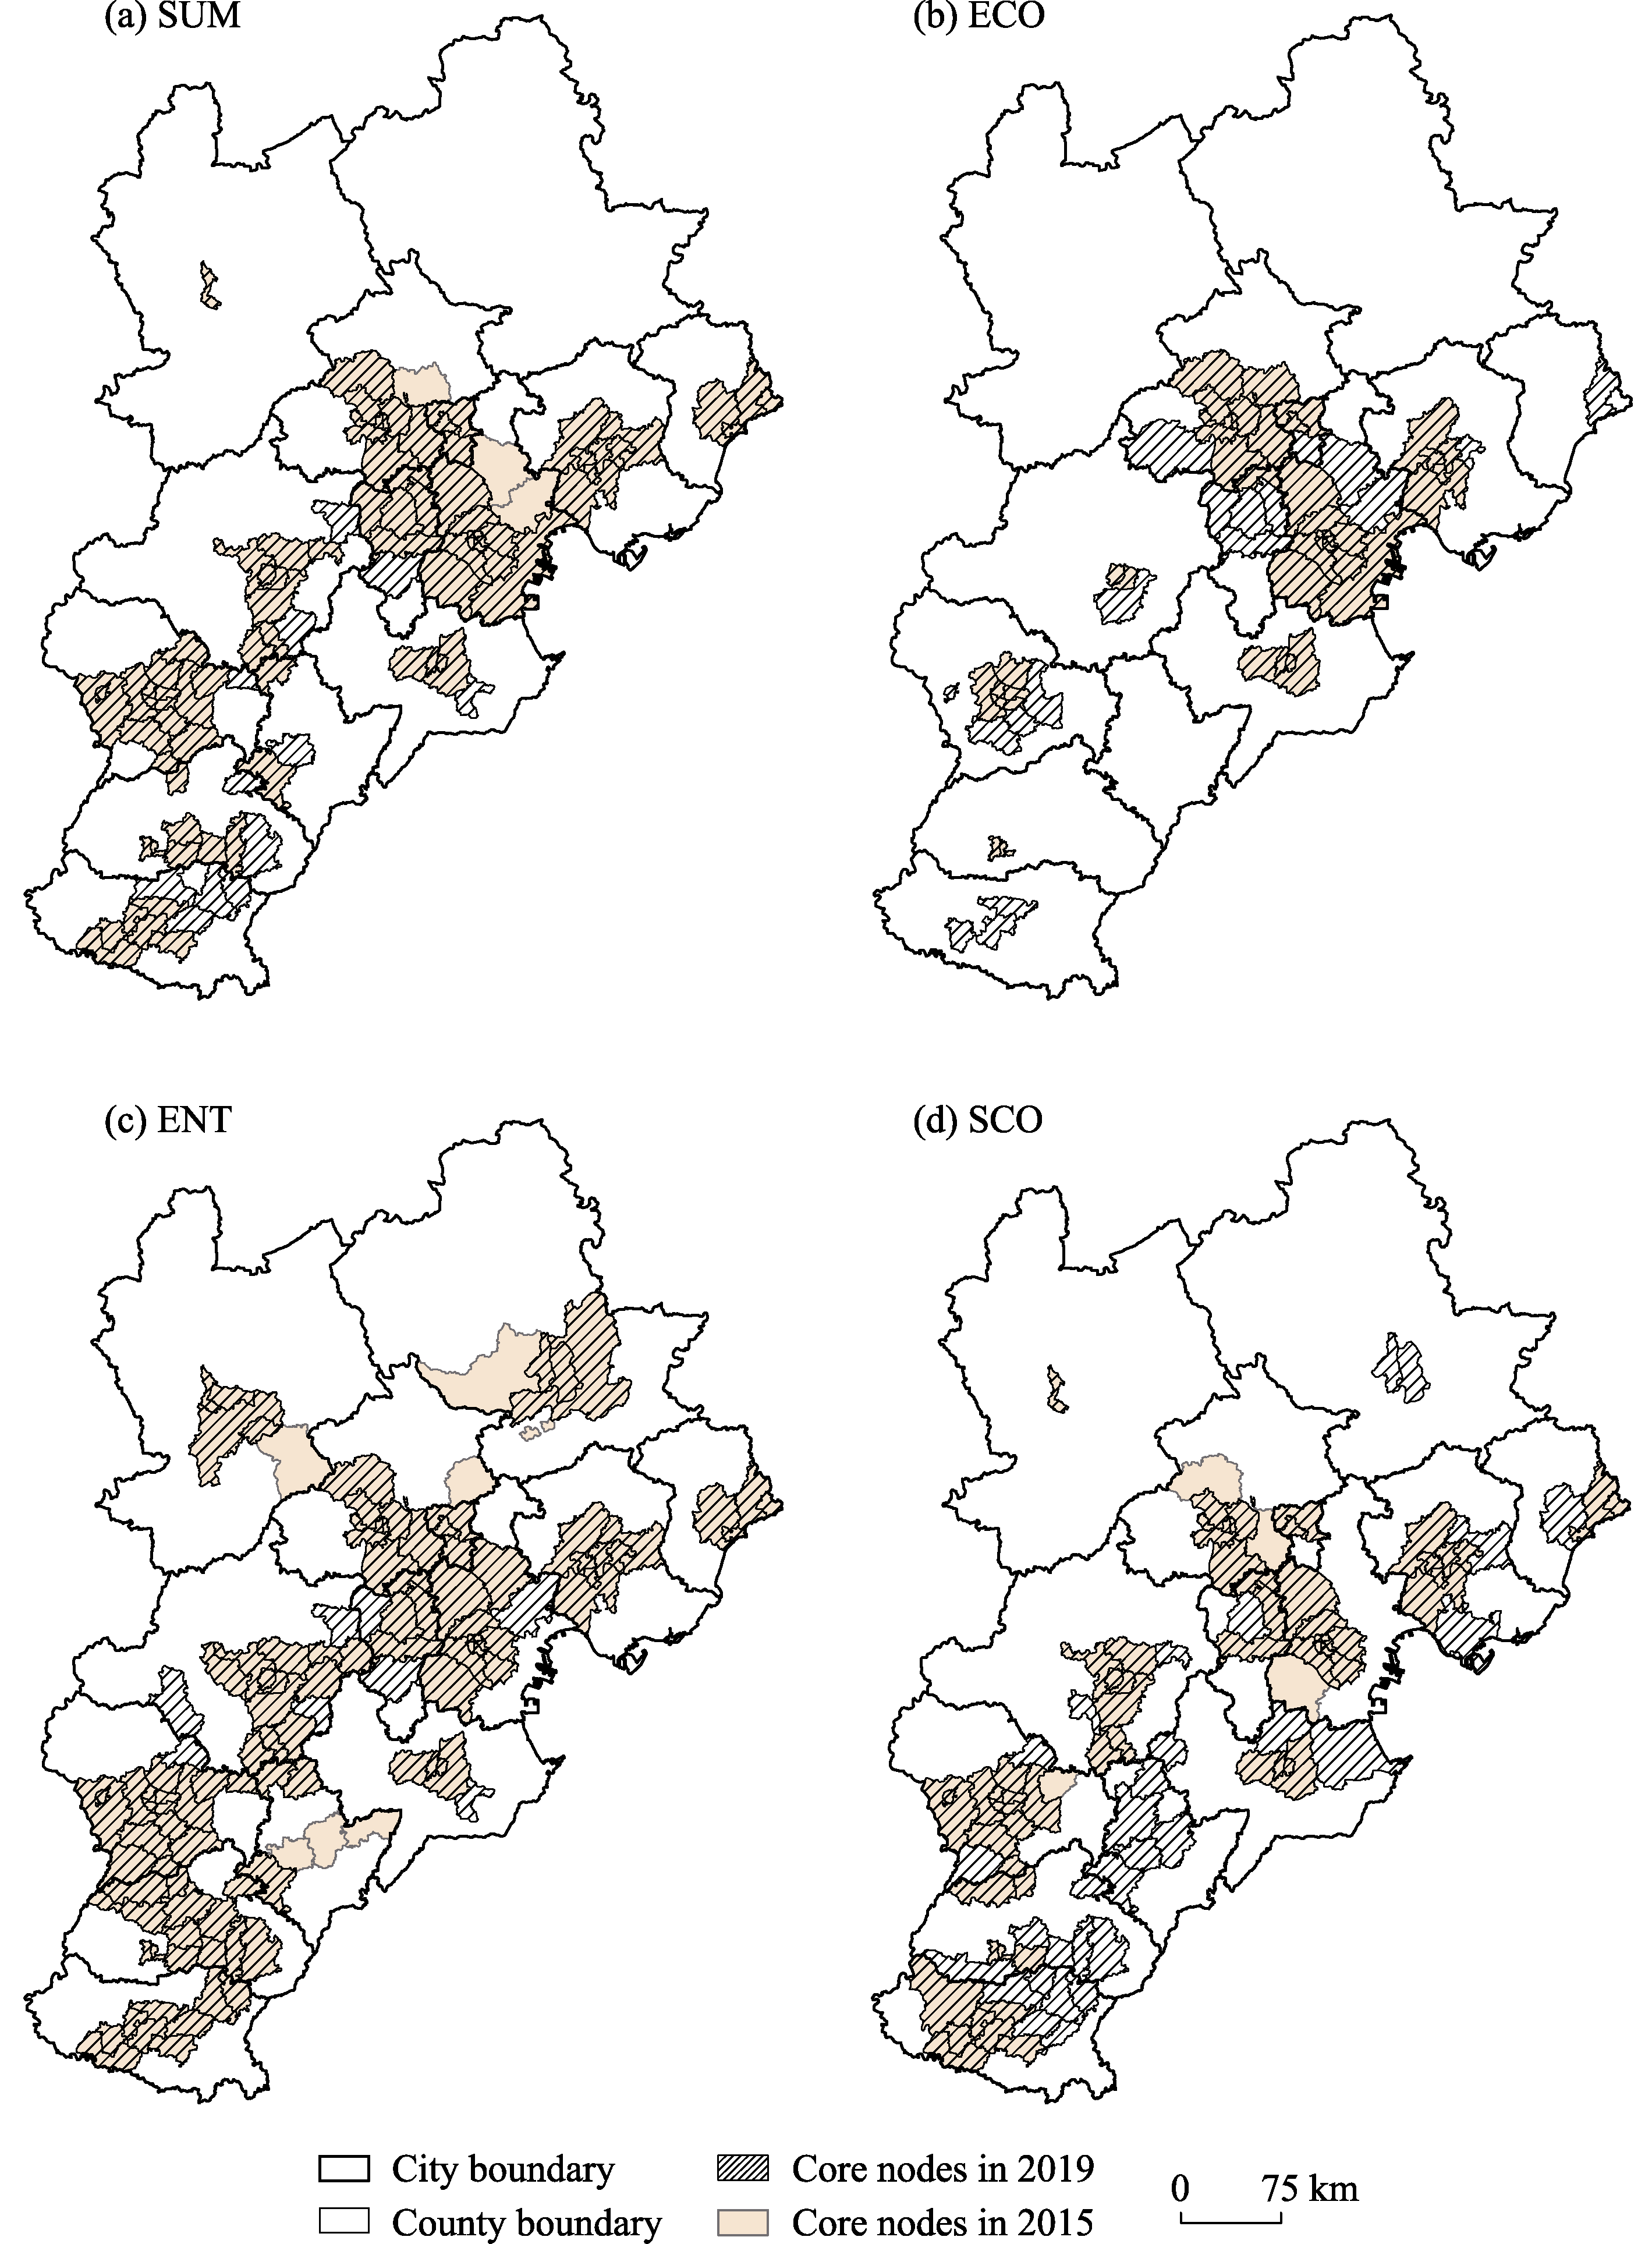
| Name | Data source | Resolution | Brief description |
|---|---|---|---|
| Land use data | Geographic Condition Monitoring Data | 2 m/yearly | Reflection of the actual development and construction of the urban area |
| Road network data | Geographic Condition Monitoring Data, OpenStreetMap dataset ( | 2 m/yearly | Quantification of the urban transportation development level |
| POI data | Geographic Condition Monitoring Data, POI data ( | 2 m/yearly | Indication of people’s living standards |
| Social and economic data | Beijing Regional Statistics Yearbook, Tianjin Statistical Yearbook, and Hebei Statistical Yearbook | Quantitative measurement of quality in all aspects of the city | |
| PM2.5 data | ChinaHighPM2.5 ( | 1 km/yearly | Characterization of the regional environmental conditions |
| Nighttime light data | EOG Group, Colorado School of Mines, USA ( | 500 m/yearly | Characterization of the regional economic development level |
| Remote sensing image | Landsat8 OLI ( | 30 m/yearly | Quantification of urban environmental quality |
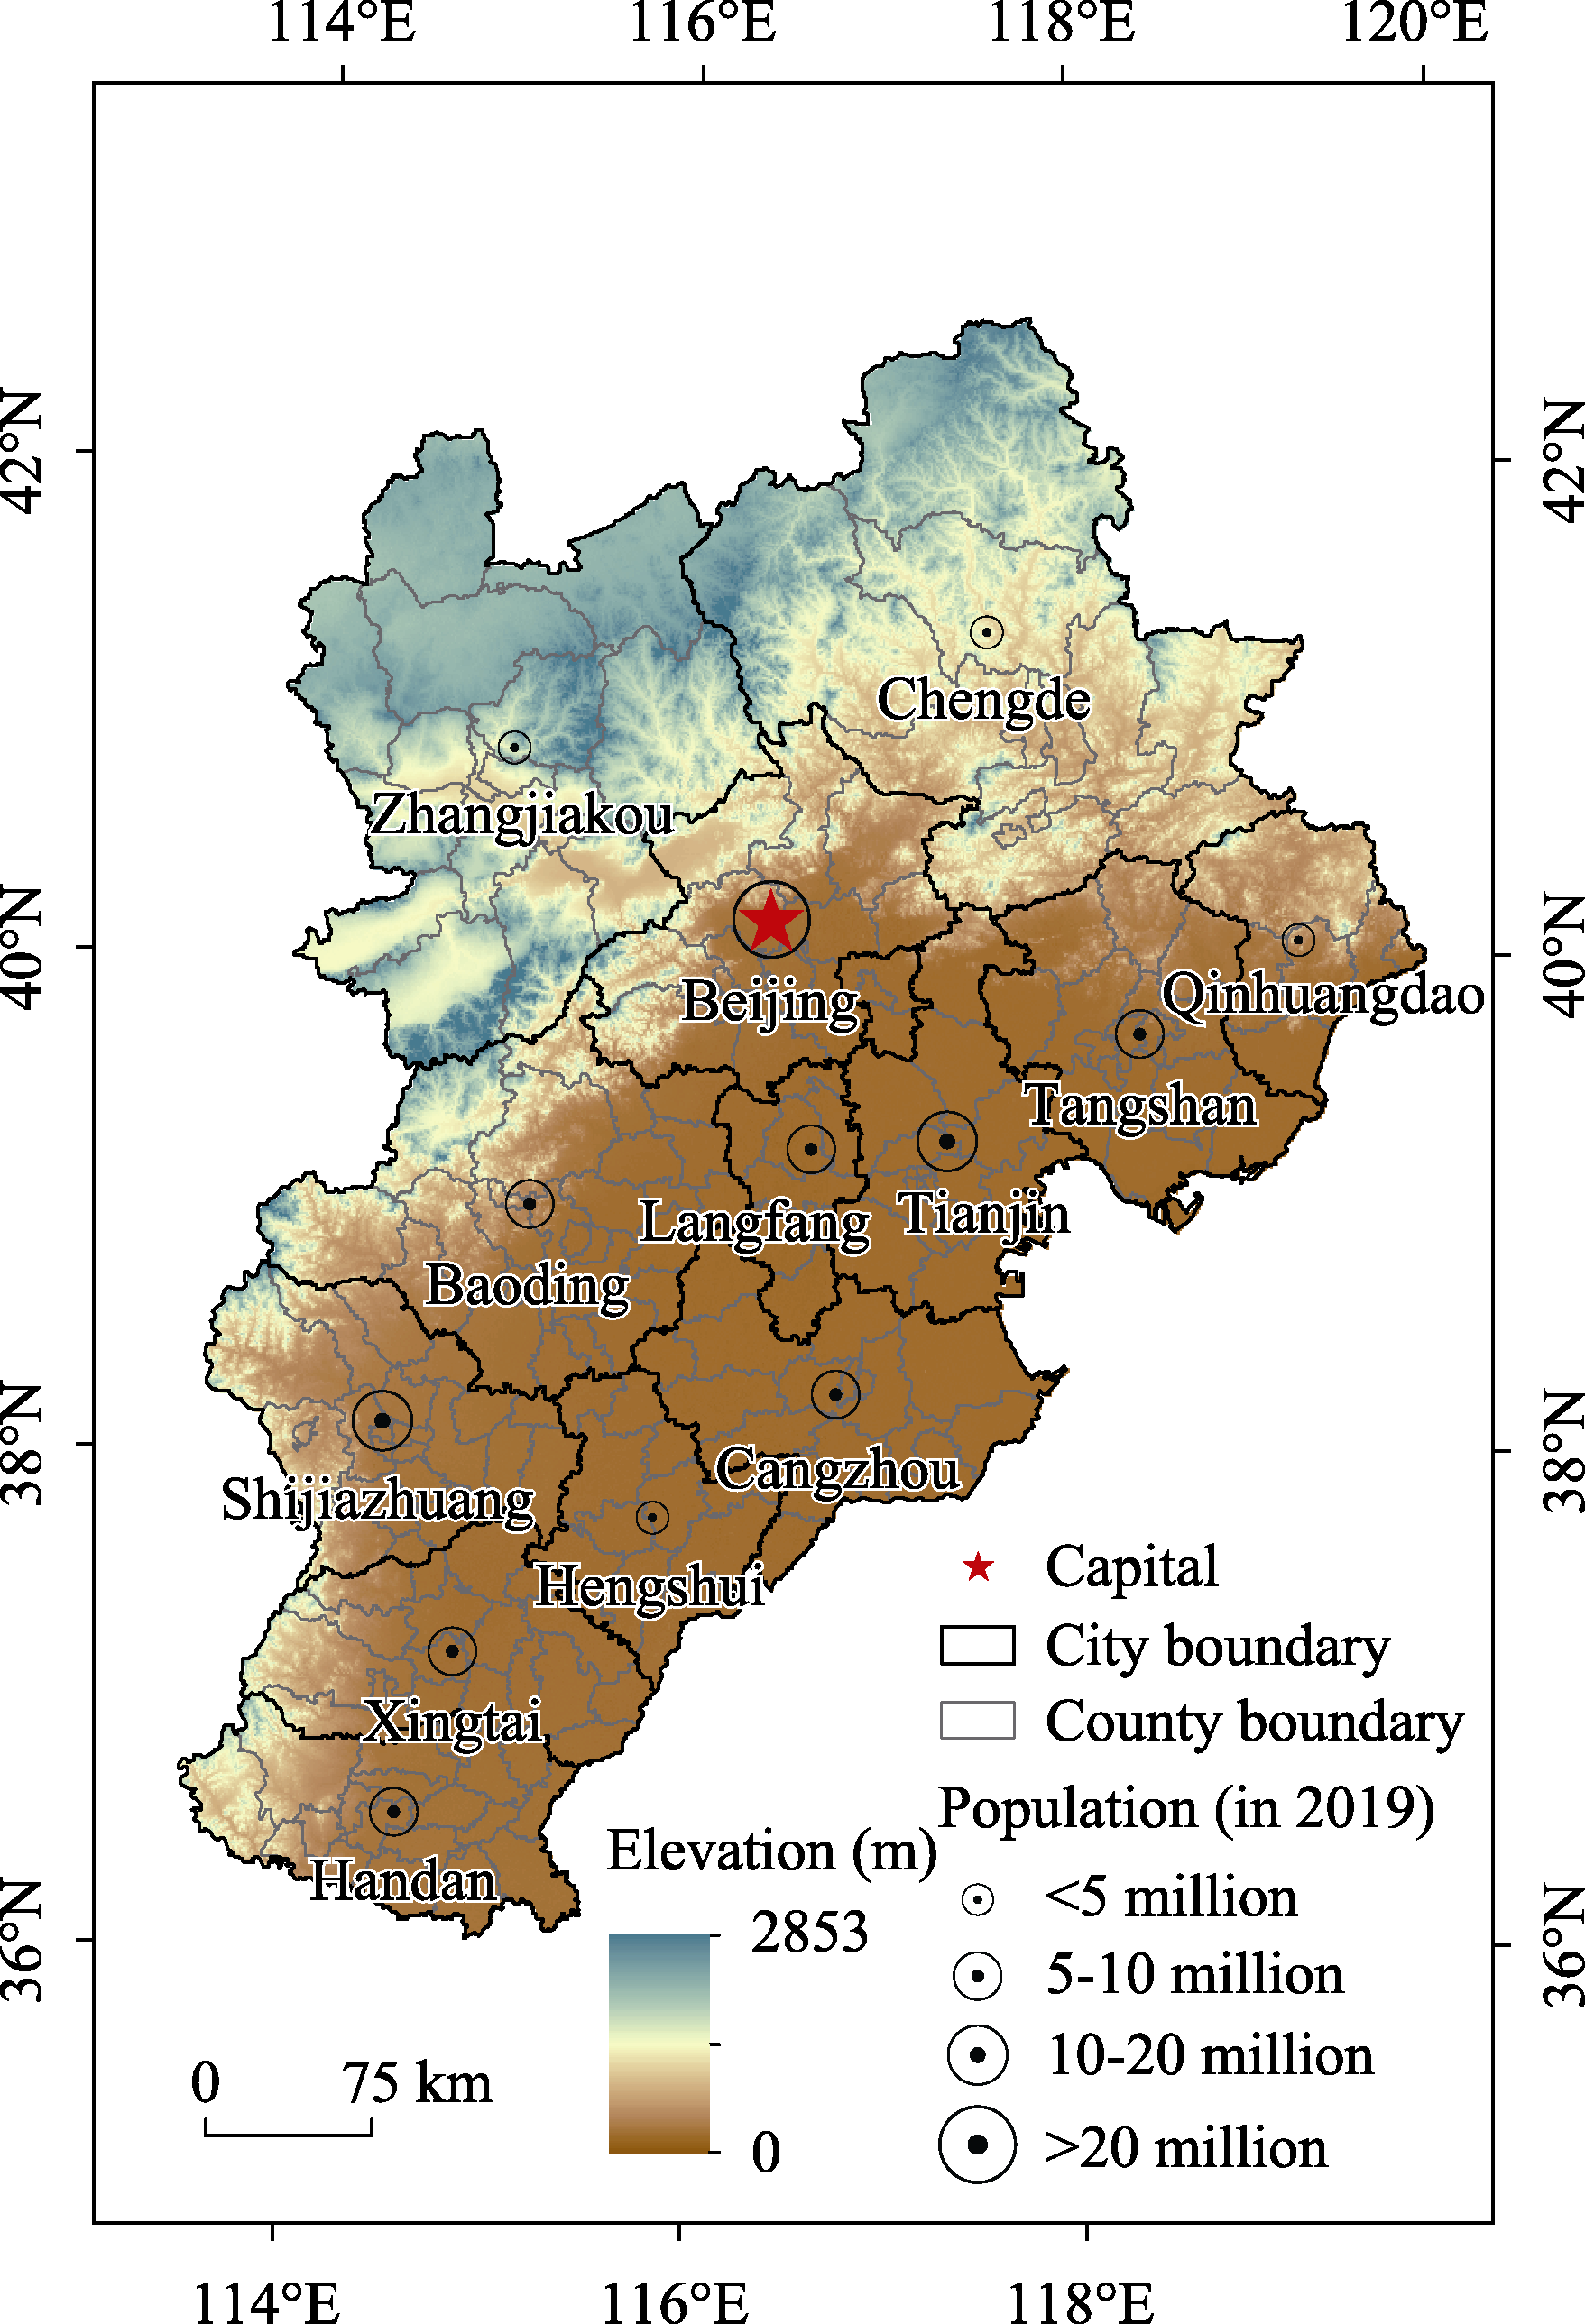
| Administrative boundary | National Basic Geographic Information Database ( | / | Definition of the scope of the study area |