| Guideline layer | Indicator layer & indicator type | Unit | Indicator meaning | Weight |
|---|---|---|---|---|
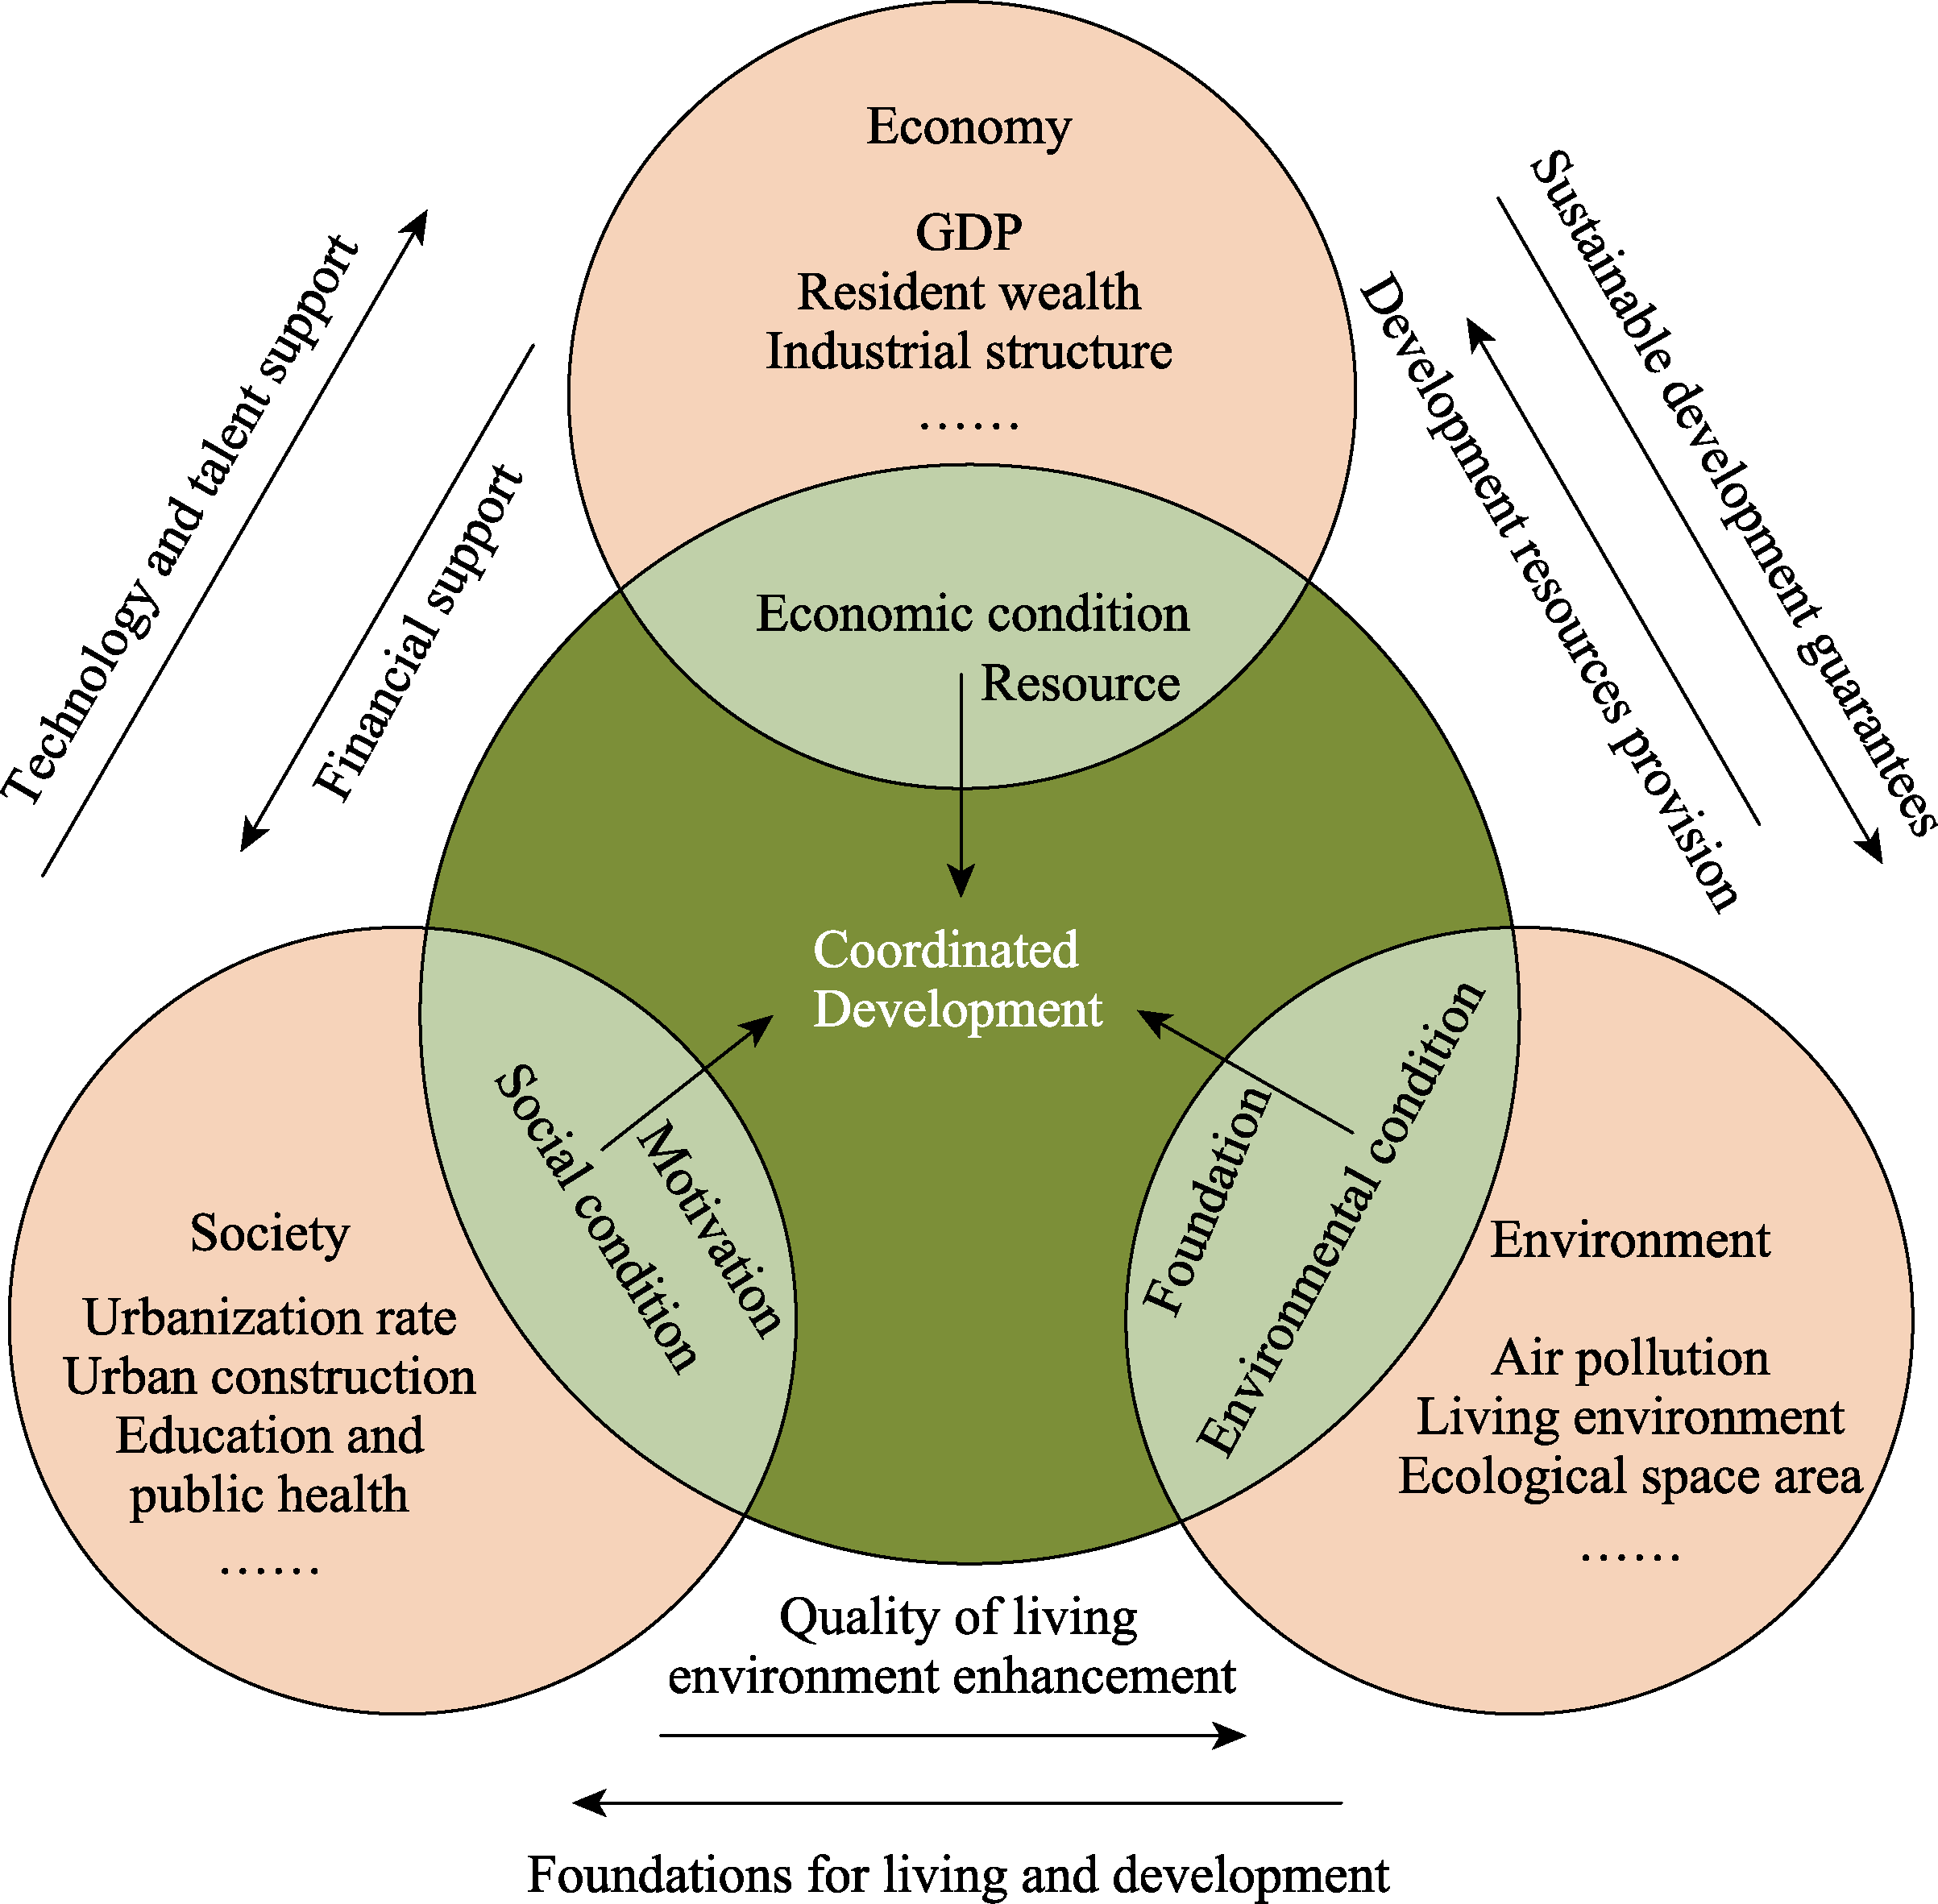
| Economy (ECO) | GDP (+) | 109 Yuan | Regional economic power | 0.2186 |
| The percentage of added value of the tertiary industry of GDP (+) | % | Industrial and economic structure | 0.0341 | |
| per capita GDP (+) | 104 yuan | Residents’ living standards | 0.0873 | |
| The averages NTL data (+) | / | Economic development level | 0.2282 | |
| General public budget revenues (+) | 104 yuan | Regional financial strength | 0.2354 | |
| General public budget expenditure (+) | 104 yuan | Regional financial strength | 0.1679 | |
| Disposable income per urban resident (+) | yuan | Residents’ living standards | 0.0285 | |
| Society (SCO) | Road network density (+) | km/km² | Infrastructure level | 0.1325 |
| Urbanization rate (+) | % | Urban development potential | 0.0202 | |
| Population density (+) | people/km2 | Population growth potential | 0.2097 | |
| Length of road per capita (+) | m/people | Convenience of transportation | 0.1583 | |
| Percentage of built-up area (+) | % | Land development intensity | 0.0548 | |
| Number of health facilities per 10,000 people (+) | Institute/104 people | Health services level | 0.0344 | |
| Number of schools per 10,000 people (+) | Institute/104 people | Education level | 0.0455 | |
| Open space area per capita (+) | people/km² | Population’s standard of living | 0.3446 | |
| Environment (ENT) | PM2.5 concentration in the air (-) | μg/m3 | Air quality levels | 0.1837 |
| Percentage of Ecological space area (+) | % | Environmental quality levels | 0.5204 | |
| NDVI (+) | / | Urban greenness | 0.1050 | |
| LST (-) | / | Urban heat | 0.0312 | |
| WET (+) | / | Urban humidity | 0.1597 |