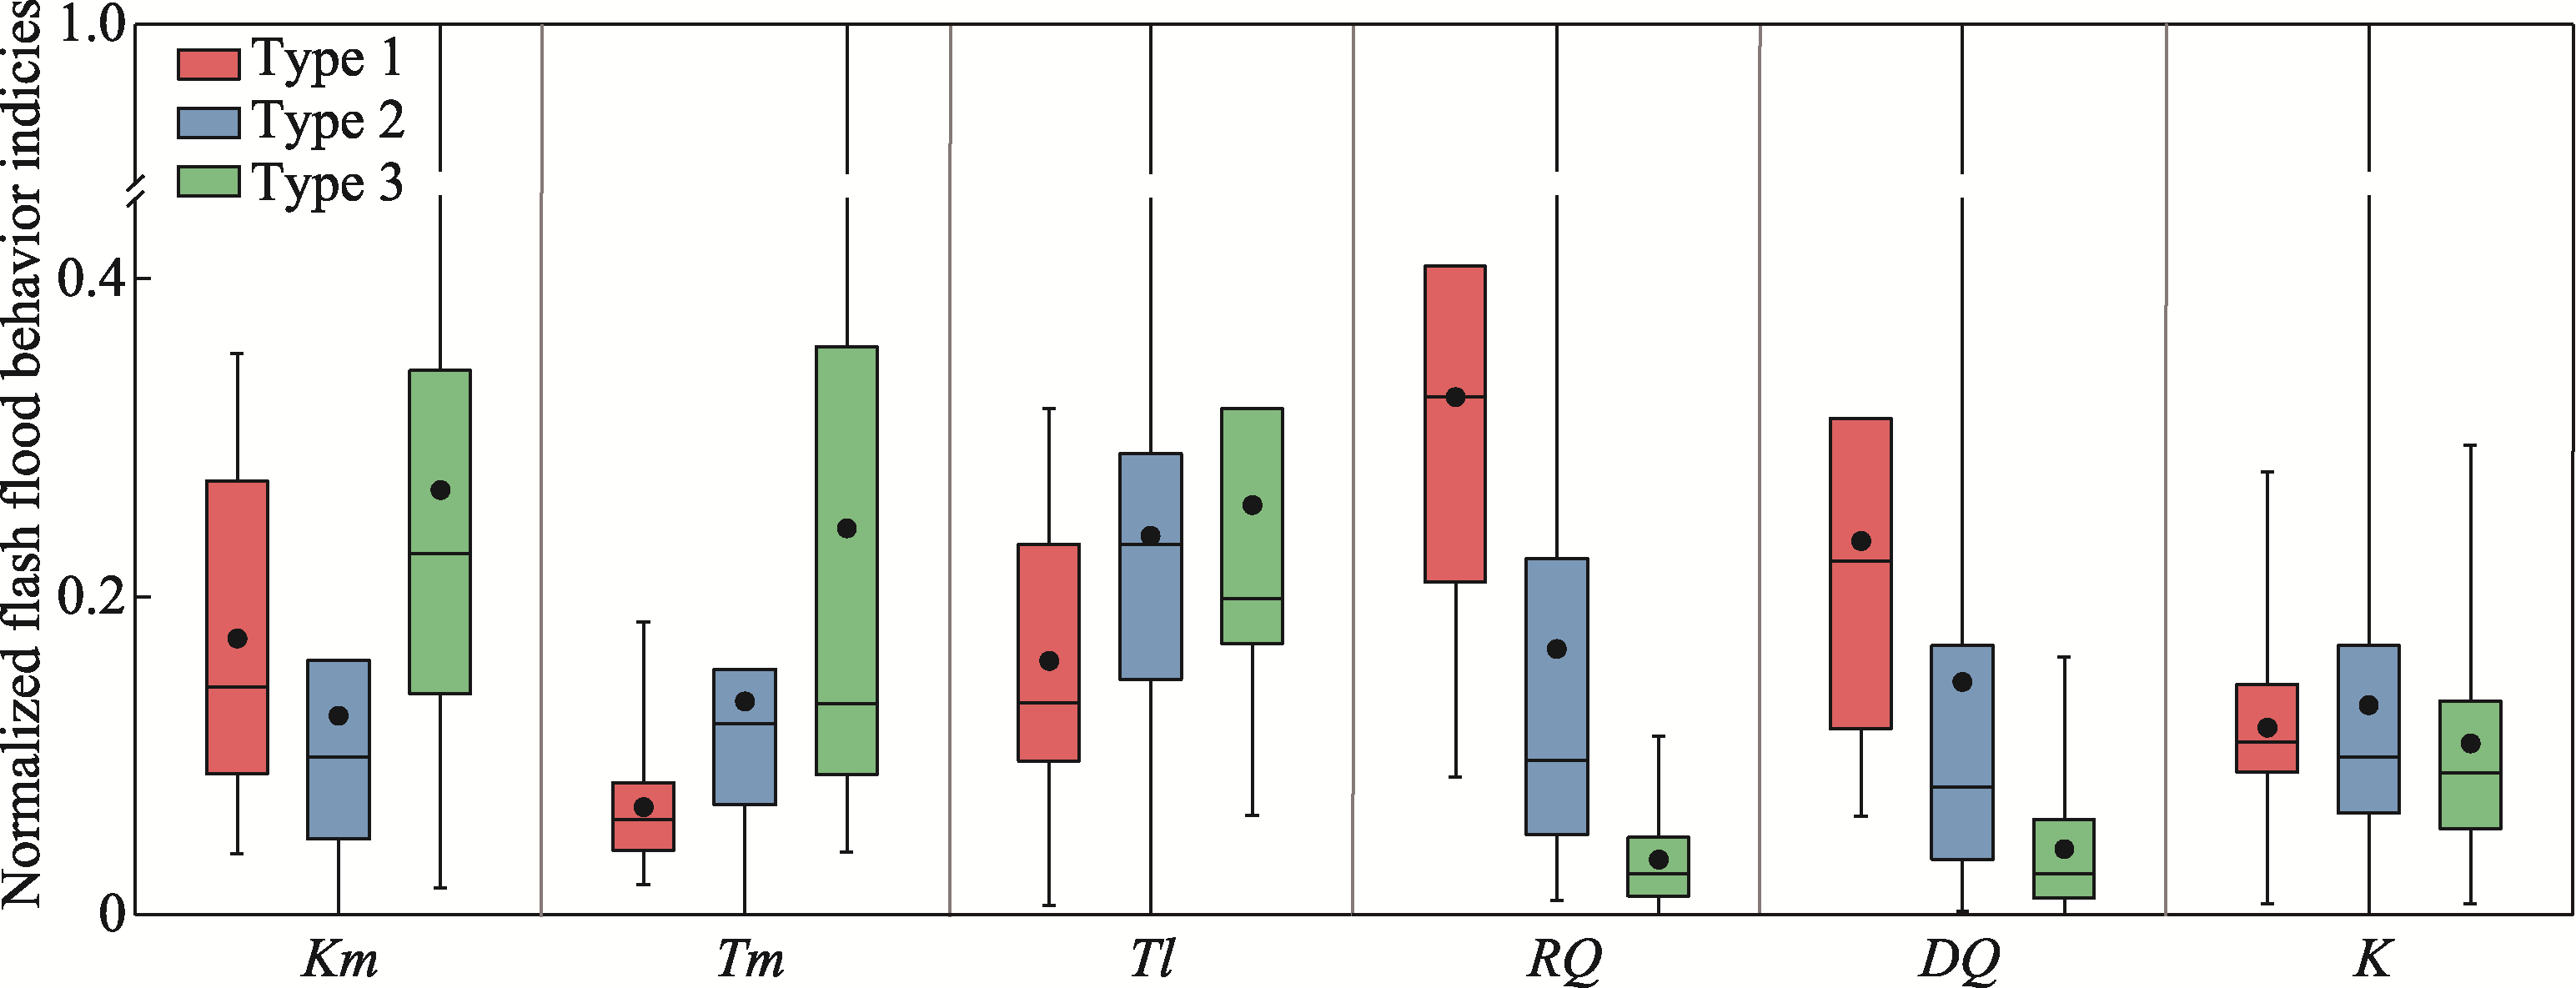
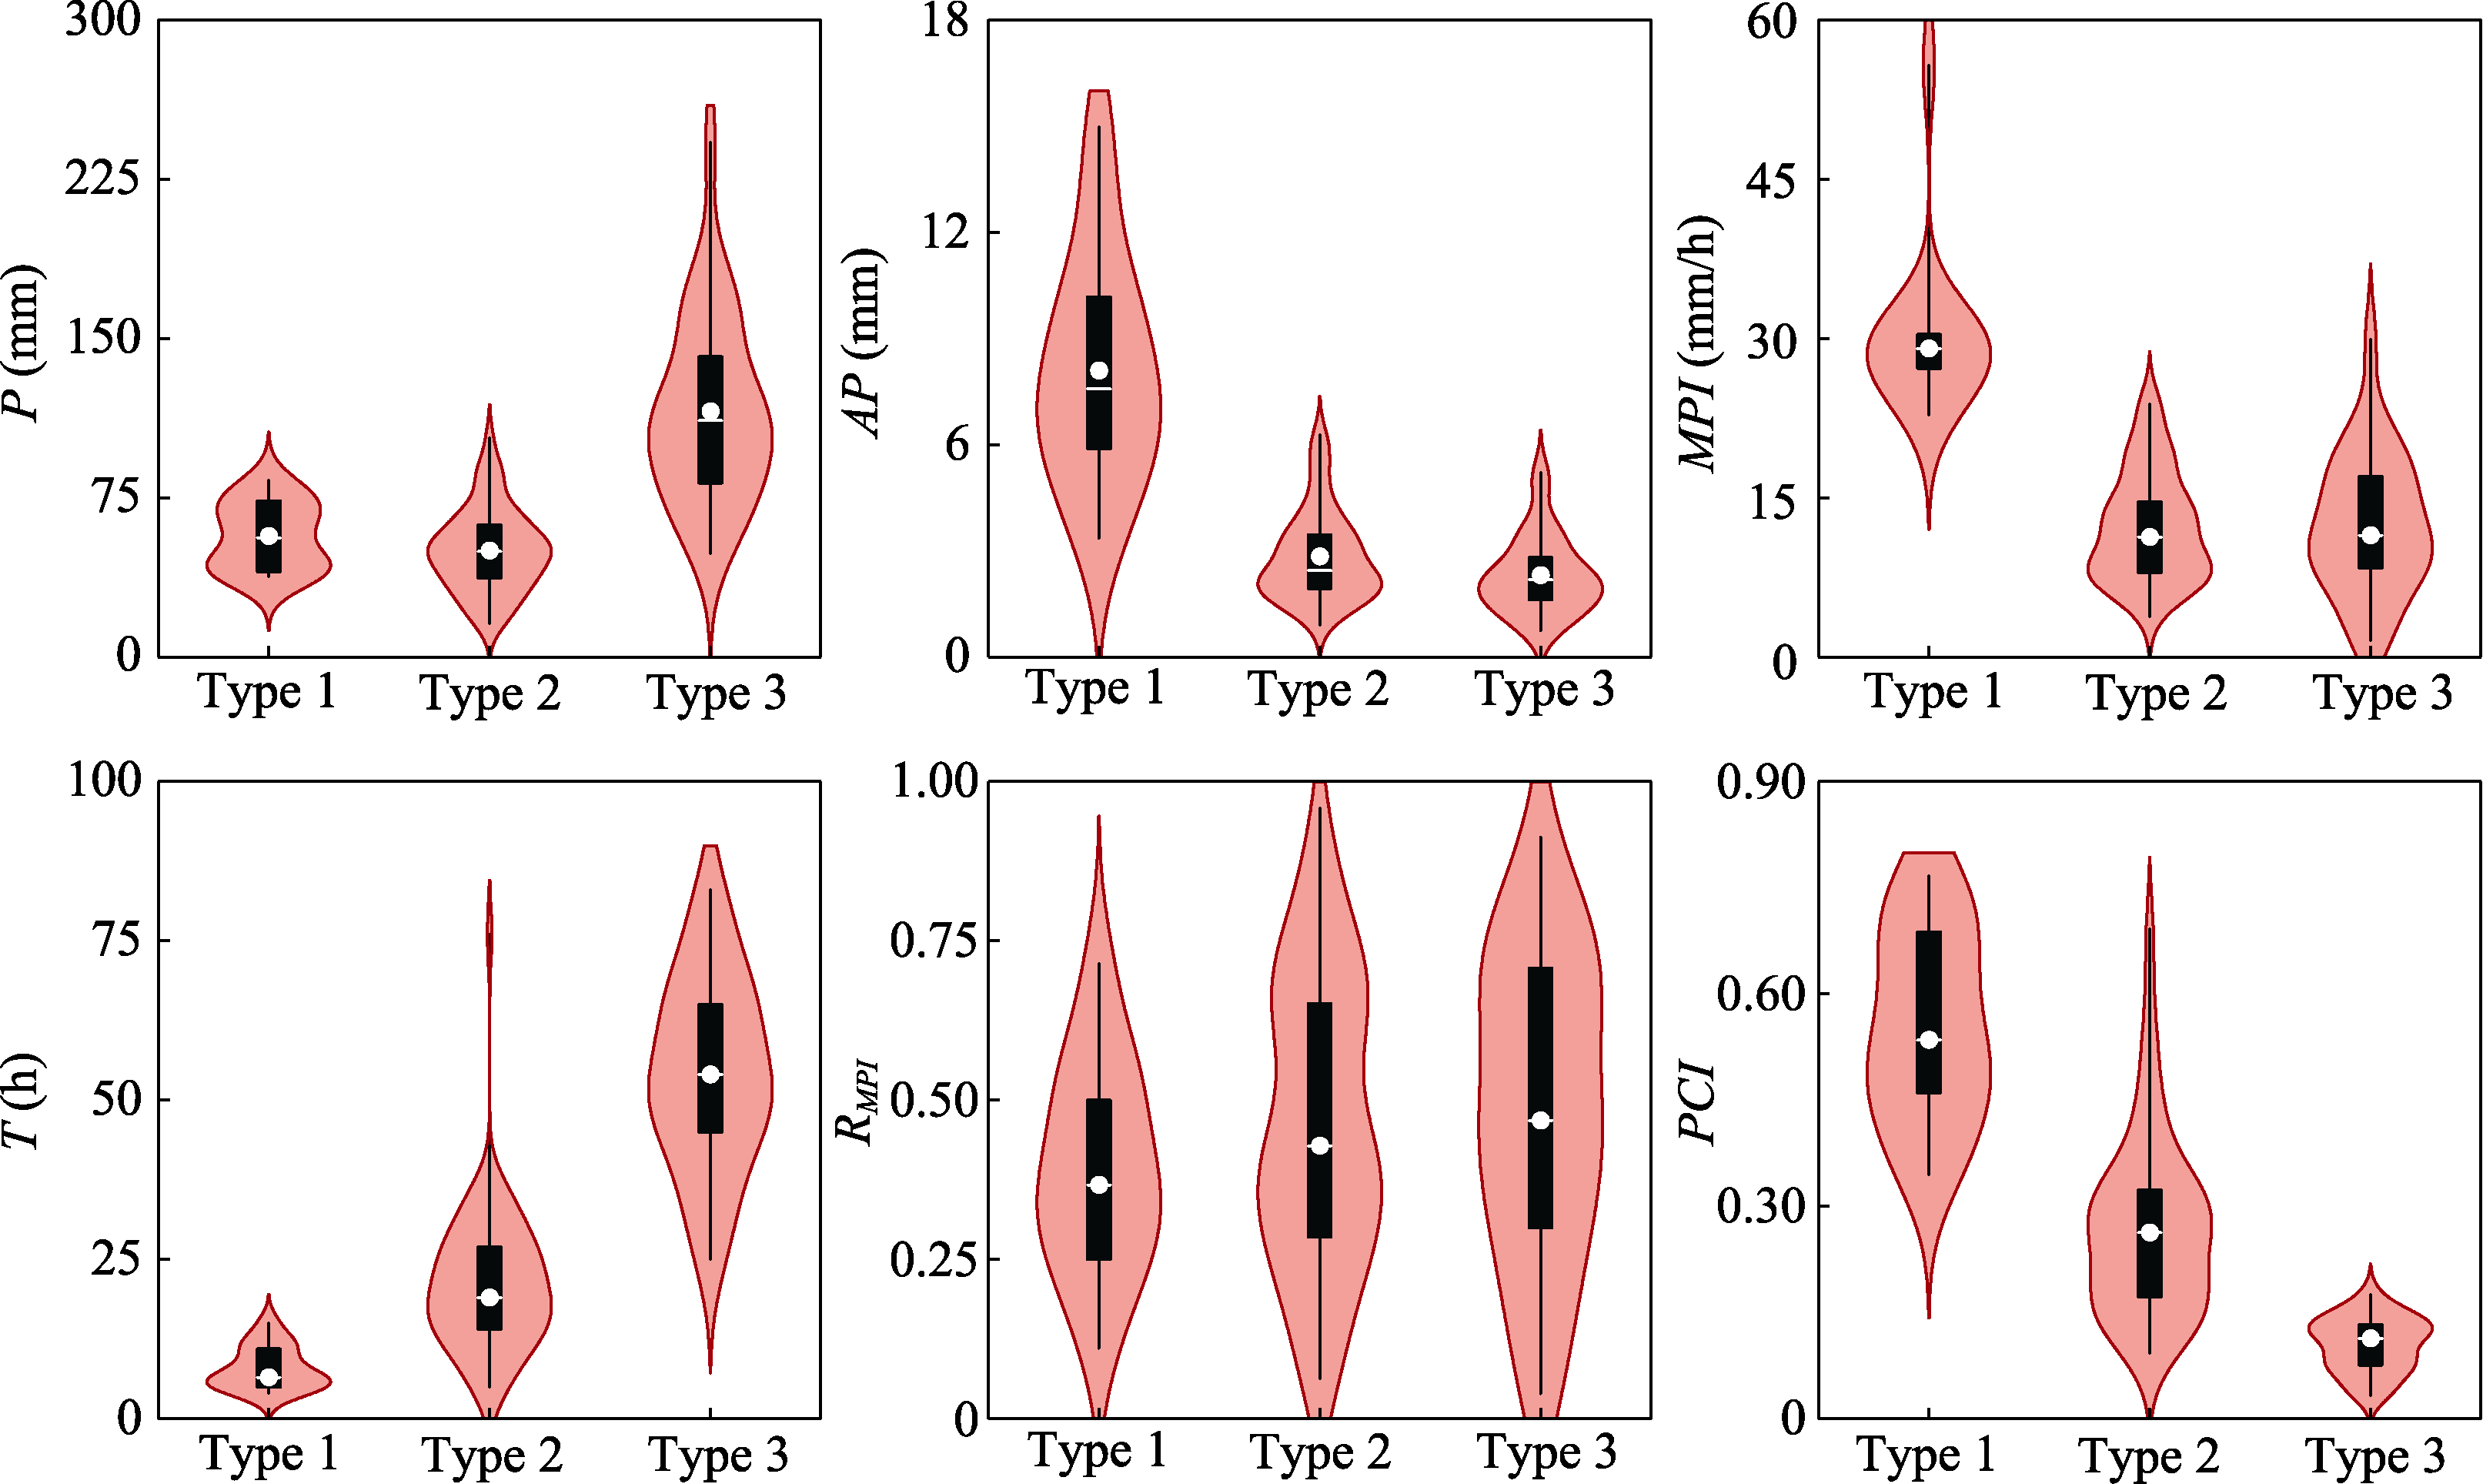
Figure 5 Distribution of normalized flash flood behavior indices induced by three rainfall types
Notes: The flash flood behavior indices are normalized using $Y*=\frac{Y-{{Y}_{\min }}}{{{Y}_{\max }}-{{Y}_{\min }}},$ where Y* and Y are values before and after normalization, respectively; Ymax and Ymin are the maximum and the minimum, respectively. Boxes represent the ranges from the 25th to the 75th quartiles, whiskers represent the ranges from the minimum to the maximum, and dots and lines in boxes represent the averages and the medians, respectively.
本文的其它图/表