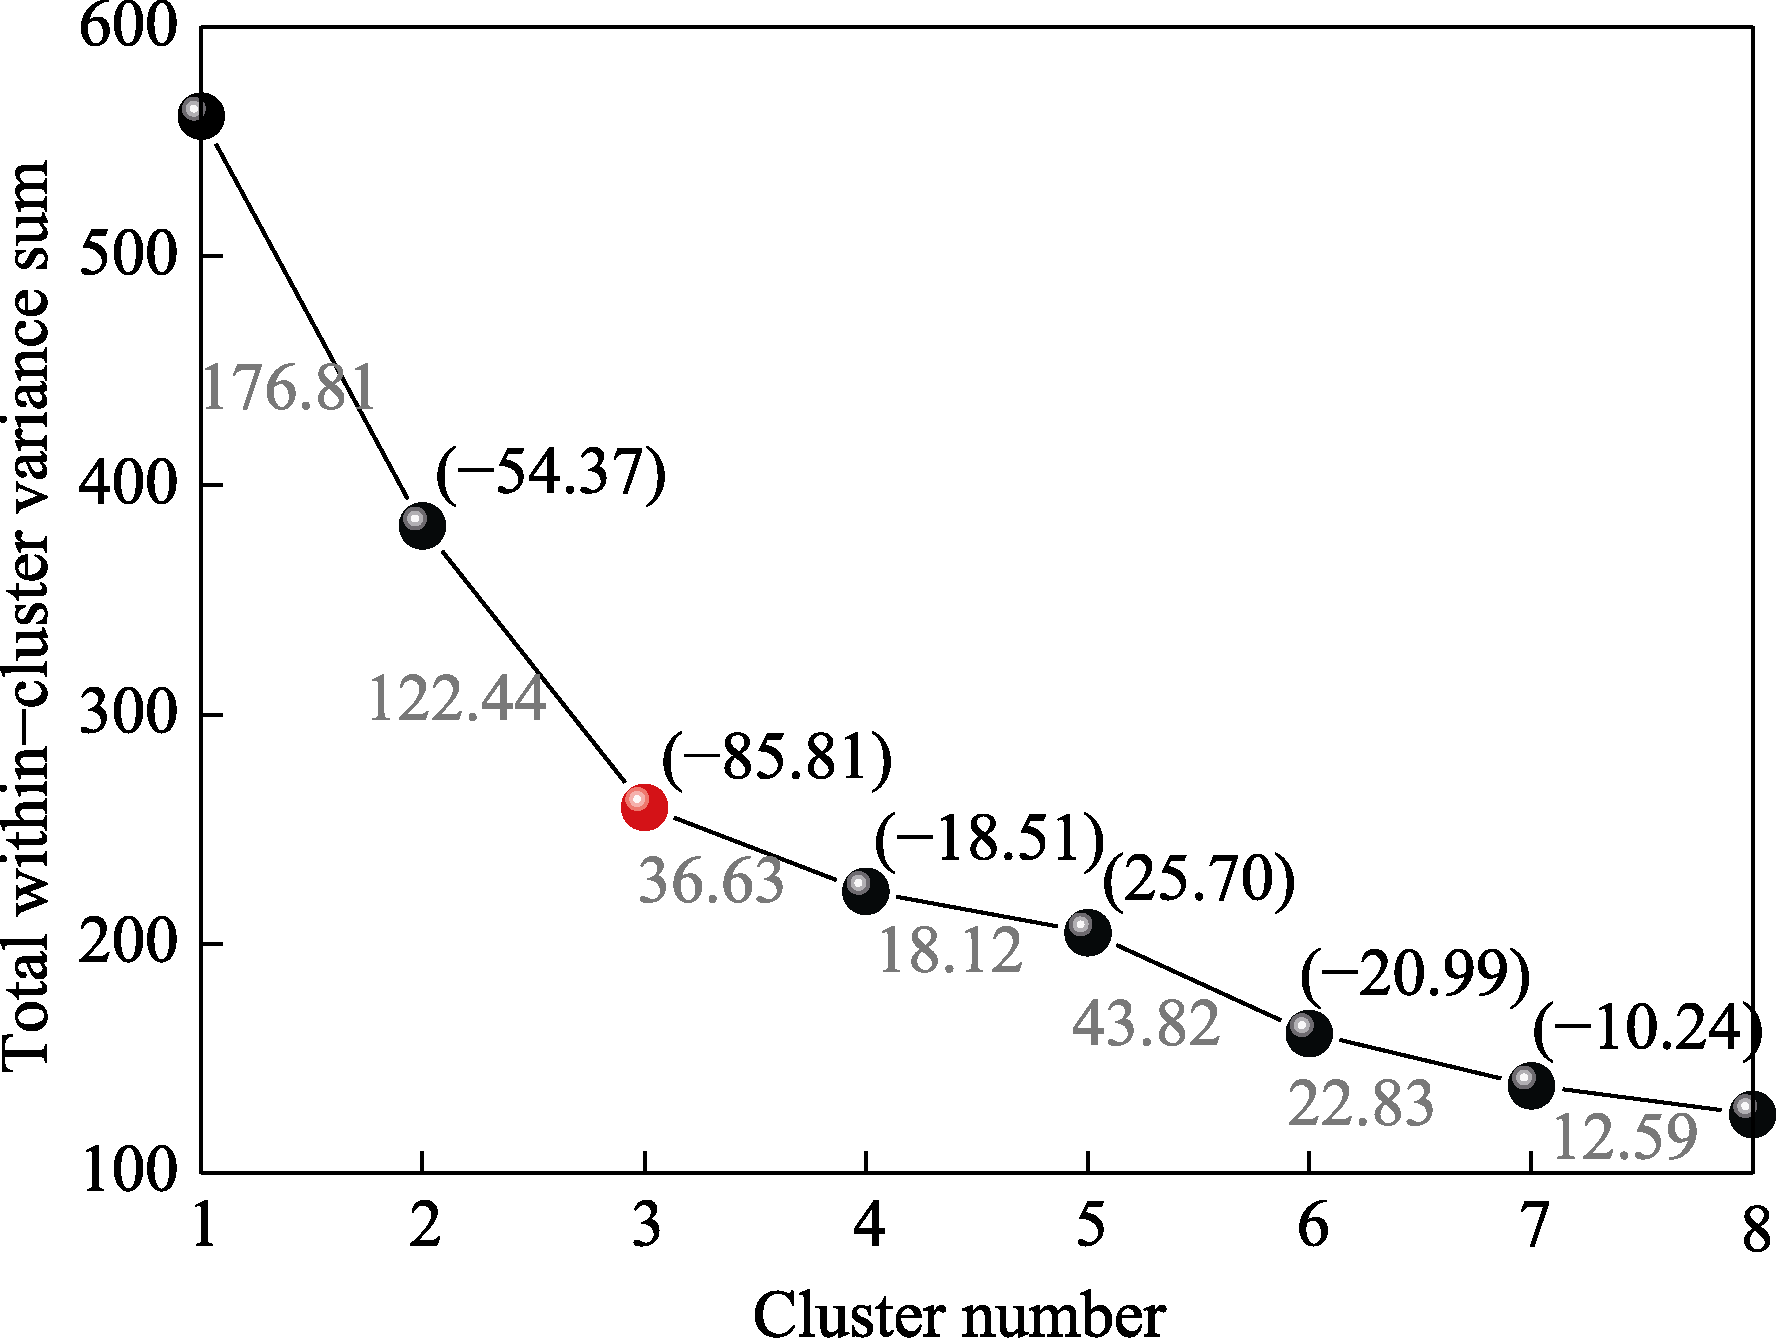
Figure 3 The diagram of total within-cluster variance sum (Vartotal) versus cluster number (K)
Notes: The number on the broken line between K=i and K=i+1 (1≤i≤7) represents the decreasing rate of Vartotal with K increasing from i to i+1, which is noted as Vartotal(i)*. The number within the bracket represents the difference between Vartotal(i+1)* and Vartotal(i)*, which is noted as Vartotal(i+1)#. The red point represents the optimal cluster number K, which is the elbow inflection point of the curve with the minimum Vartotal(K=3)#.
本文的其它图/表