×
模态框(Modal)标题
在这里添加一些文本
关闭
关闭
提交更改
取消
确定并提交
×
模态框(Modal)标题
×
期刊
文章
图表
检索
EN
中文
首页
关于期刊
期刊介绍
数据库收录
期刊荣誉
编委会
投稿指南
在线期刊
当期目录
优先出版
过刊浏览
推荐文章
专题
按栏目浏览
阅读排行
下载排行
引用排行
E-mail Alert
RSS
期刊订阅
广告合作
联系我们
EN
中文
图/表 详细信息
Evaluating flash flood simulation capability with respect to rainfall temporal variability in a small mountainous catchment
WANG Xuemei, ZHAI Xiaoyan, ZHANG Yongyong, GUO Liang
地理学报(英文版), 2023, 33(
12
): 2530-2548. DOI:
10.1007/s11442-023-2188-5
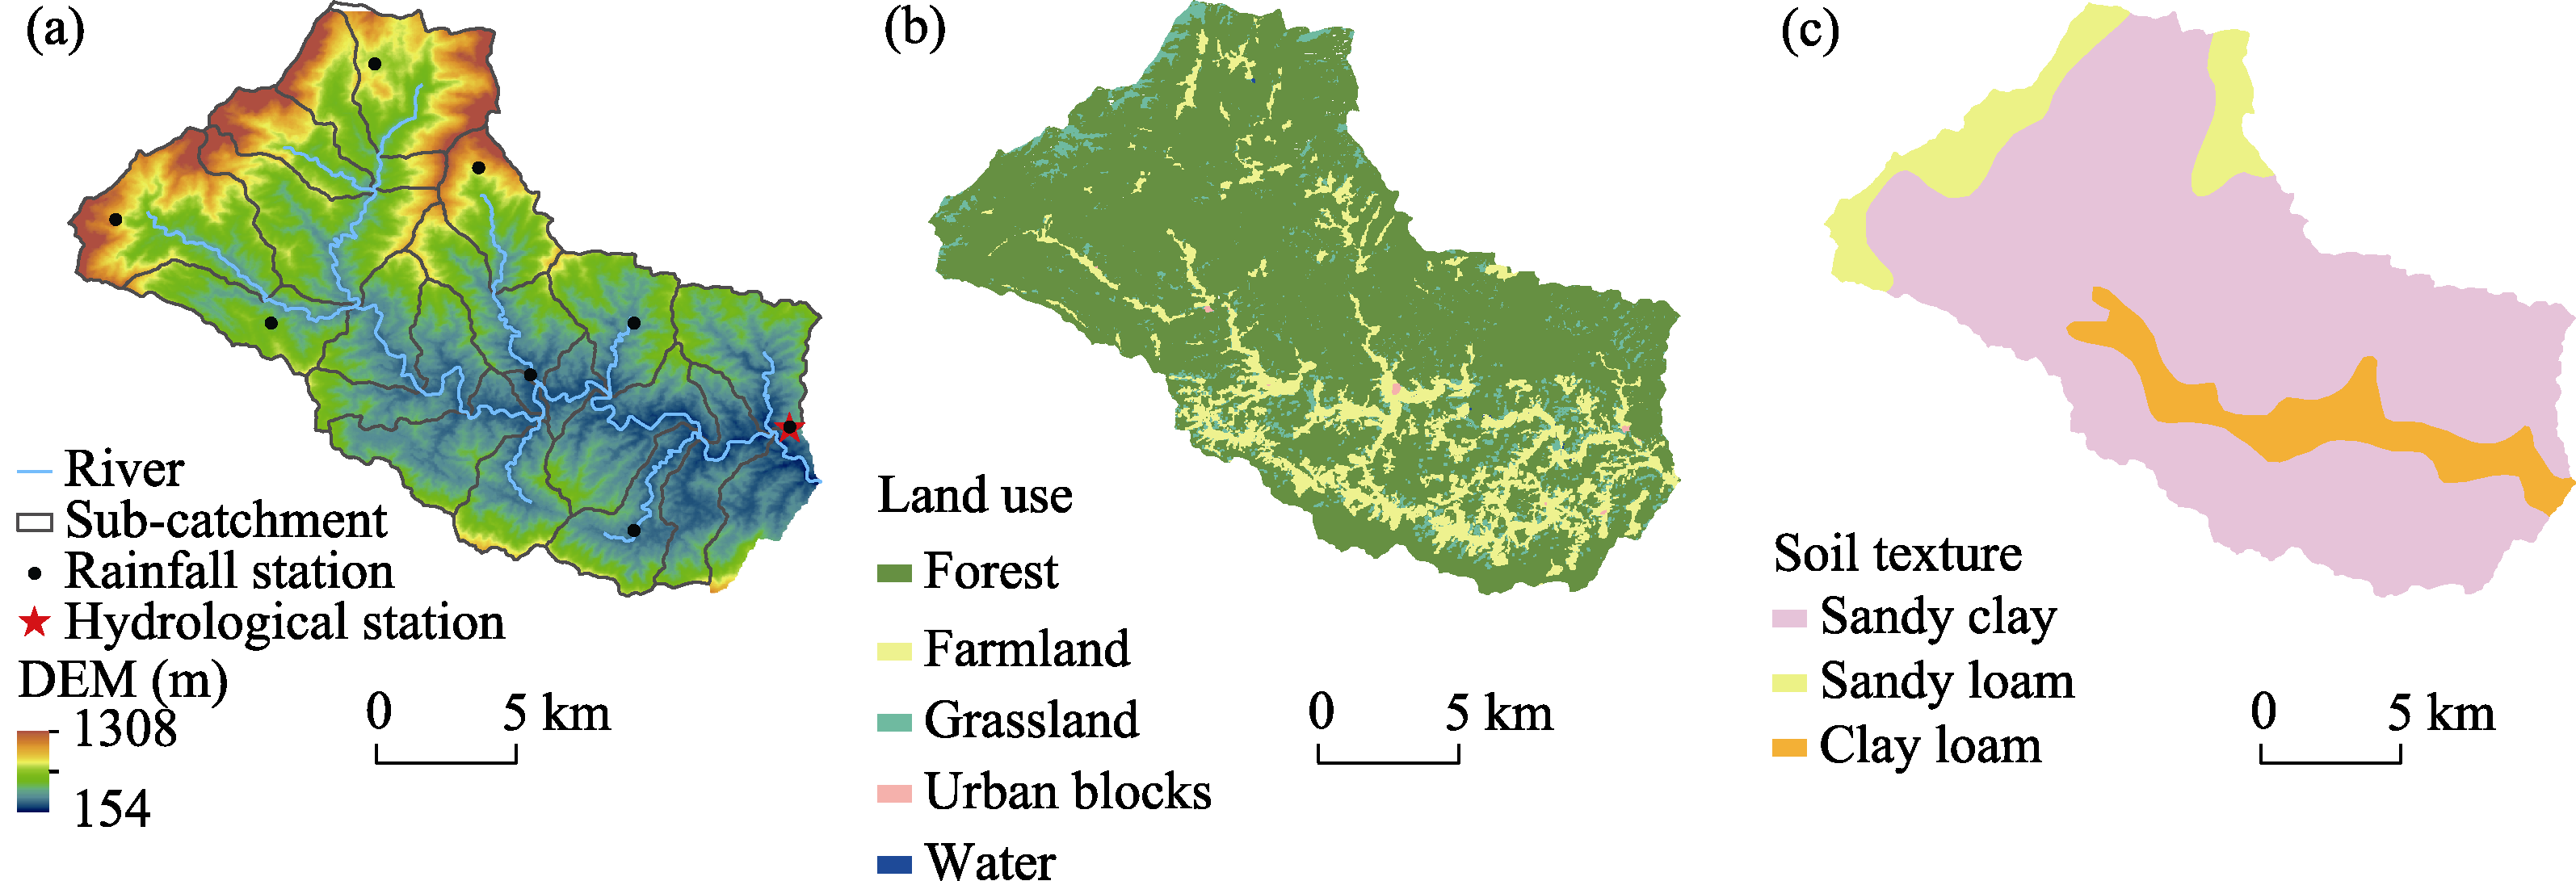
Figure 1
Spatial distribution of DEM and water system (a), land use (b) and soil texture types (c) in Anhe catchment
本文的其它图/表
Table 1
Selected rainfall characteristic indices at event scale
Table 2
Selected flash flood behavior indices at event scale
Figure 2
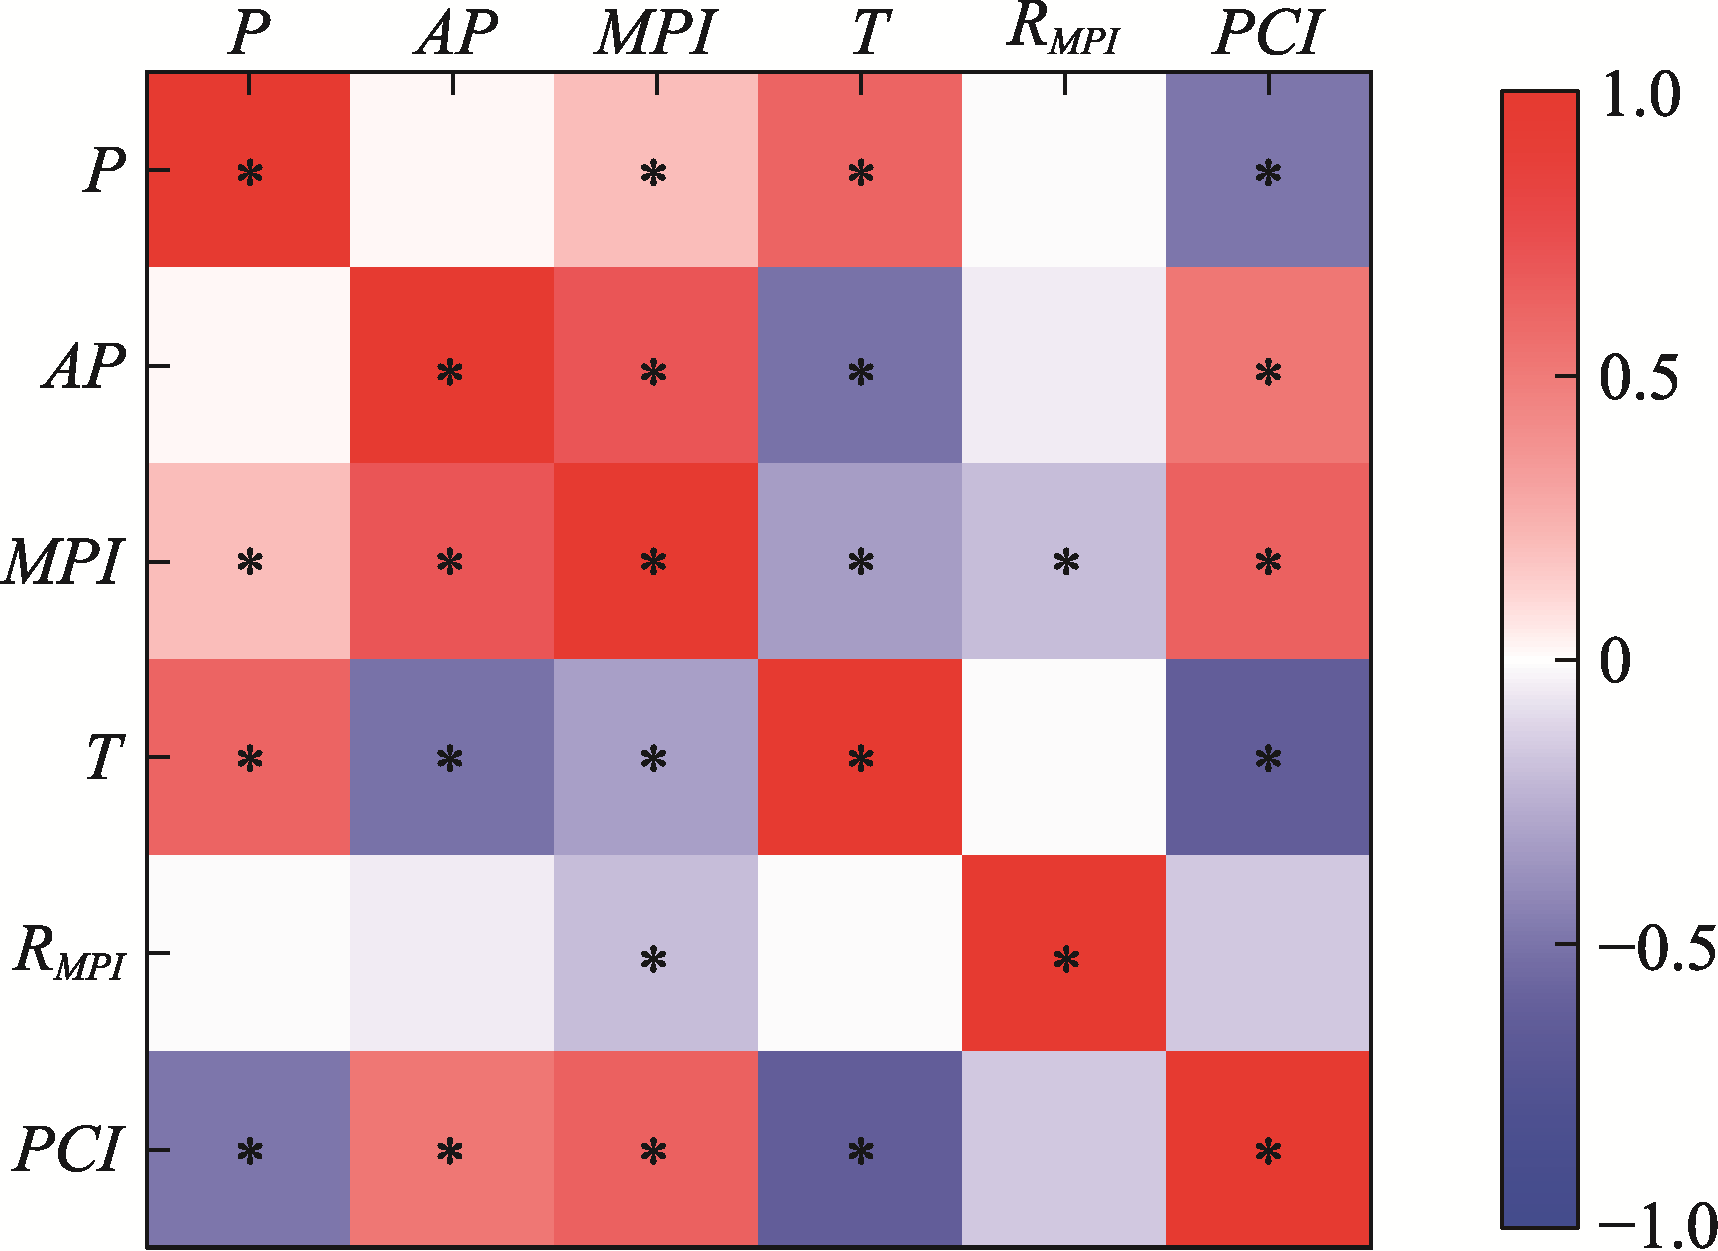
Correlation coefficients of rainfall characteristic indices
Note: * indicates the correlation coefficient has a significance level
p
<0.05.
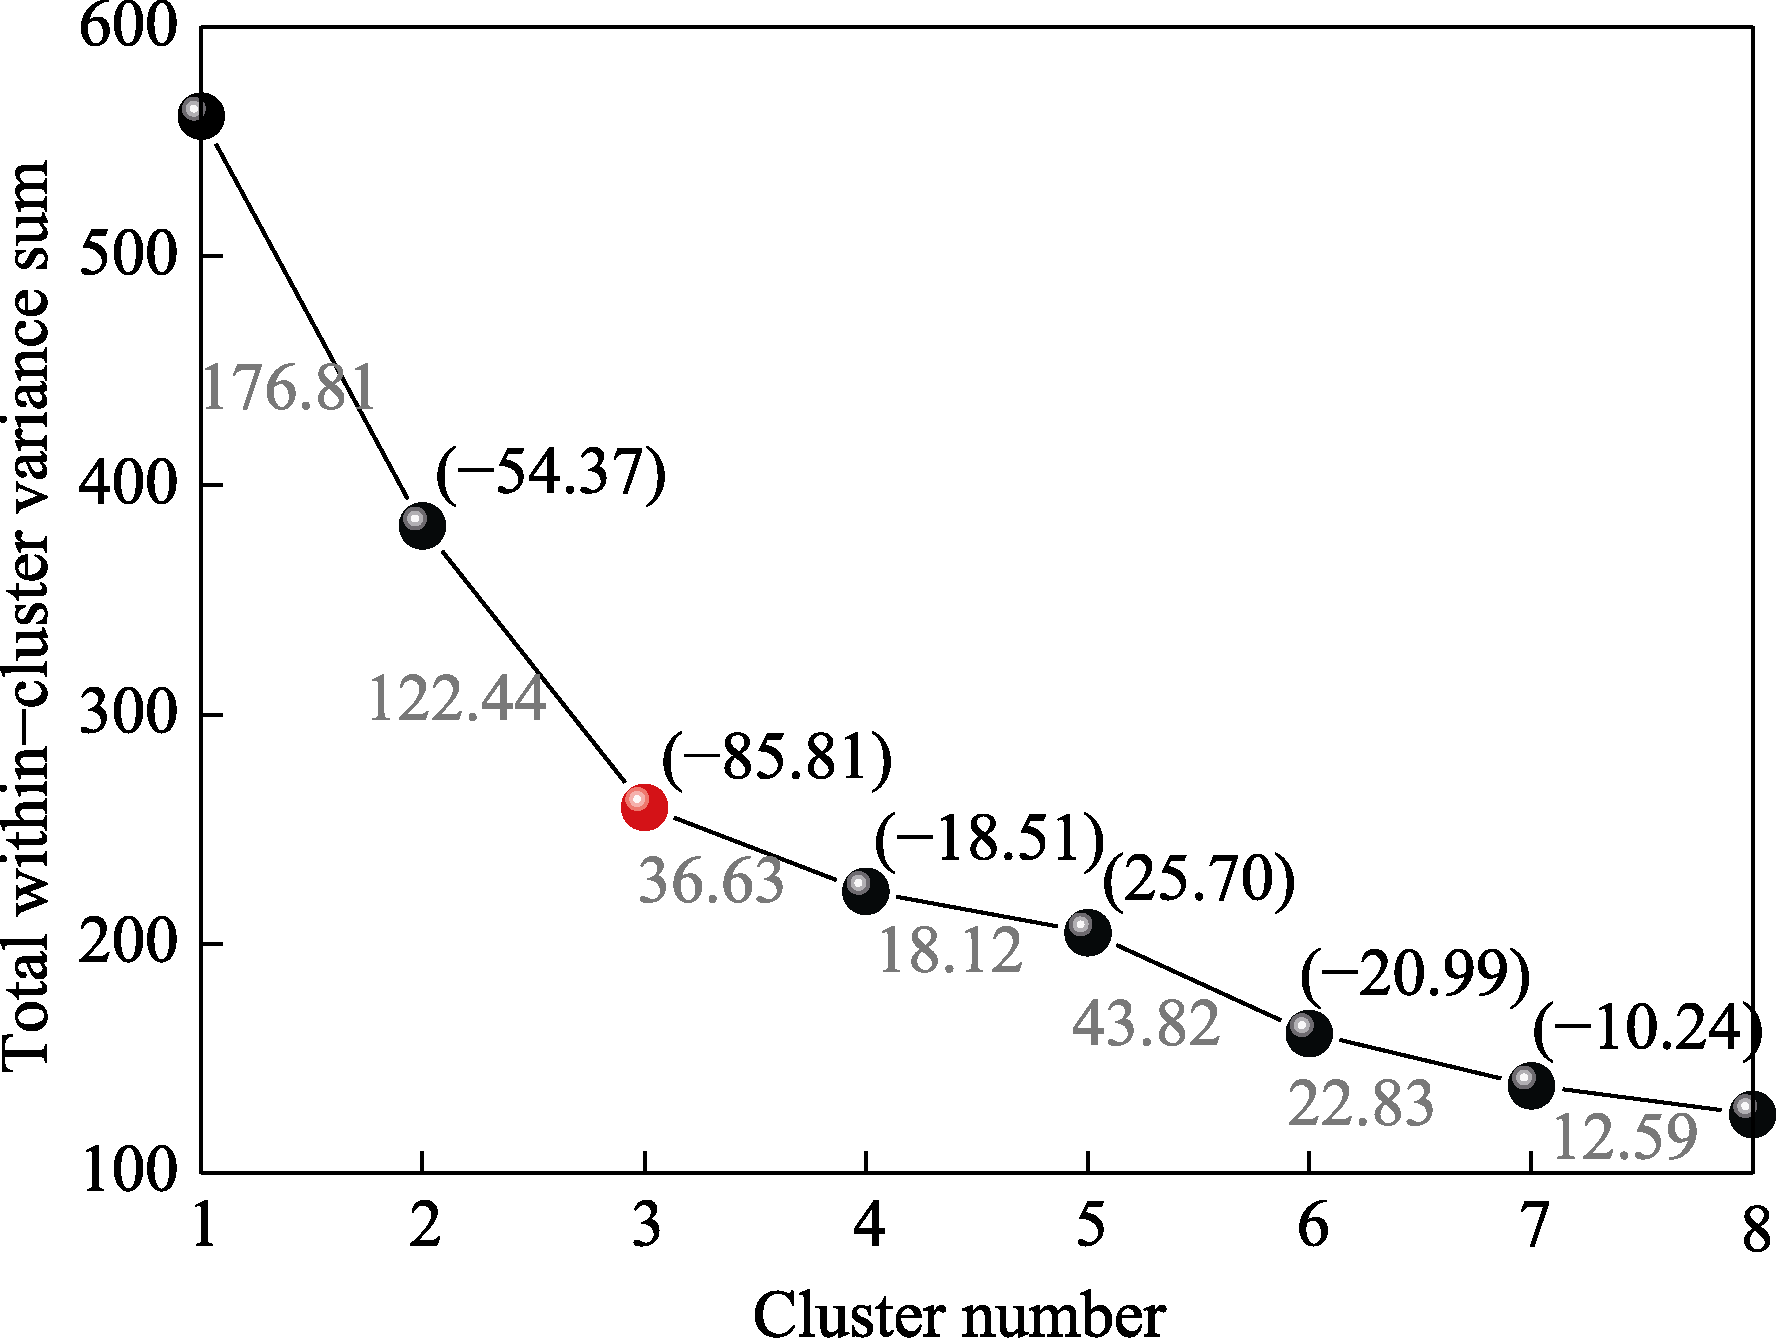
Figure 3
The diagram of total within-cluster variance sum (Var
total
) versus cluster number (K)
Notes: The number on the broken line between
K
=
i
and
K
=
i
+1 (1≤
i
≤7) represents the decreasing rate of
Var
total
with
K
increasing from
i
to
i
+1, which is noted as
Var
total
(
i
)
*
. The number within the bracket represents the difference between
Var
total
(
i
+1)
*
and
Var
total
(
i
)
*
, which is noted as
Var
total
(
i
+1)
#
. The red point represents the optimal cluster number
K
, which is the elbow inflection point of the curve with the minimum
Var
total
(
K
=3)
#
.
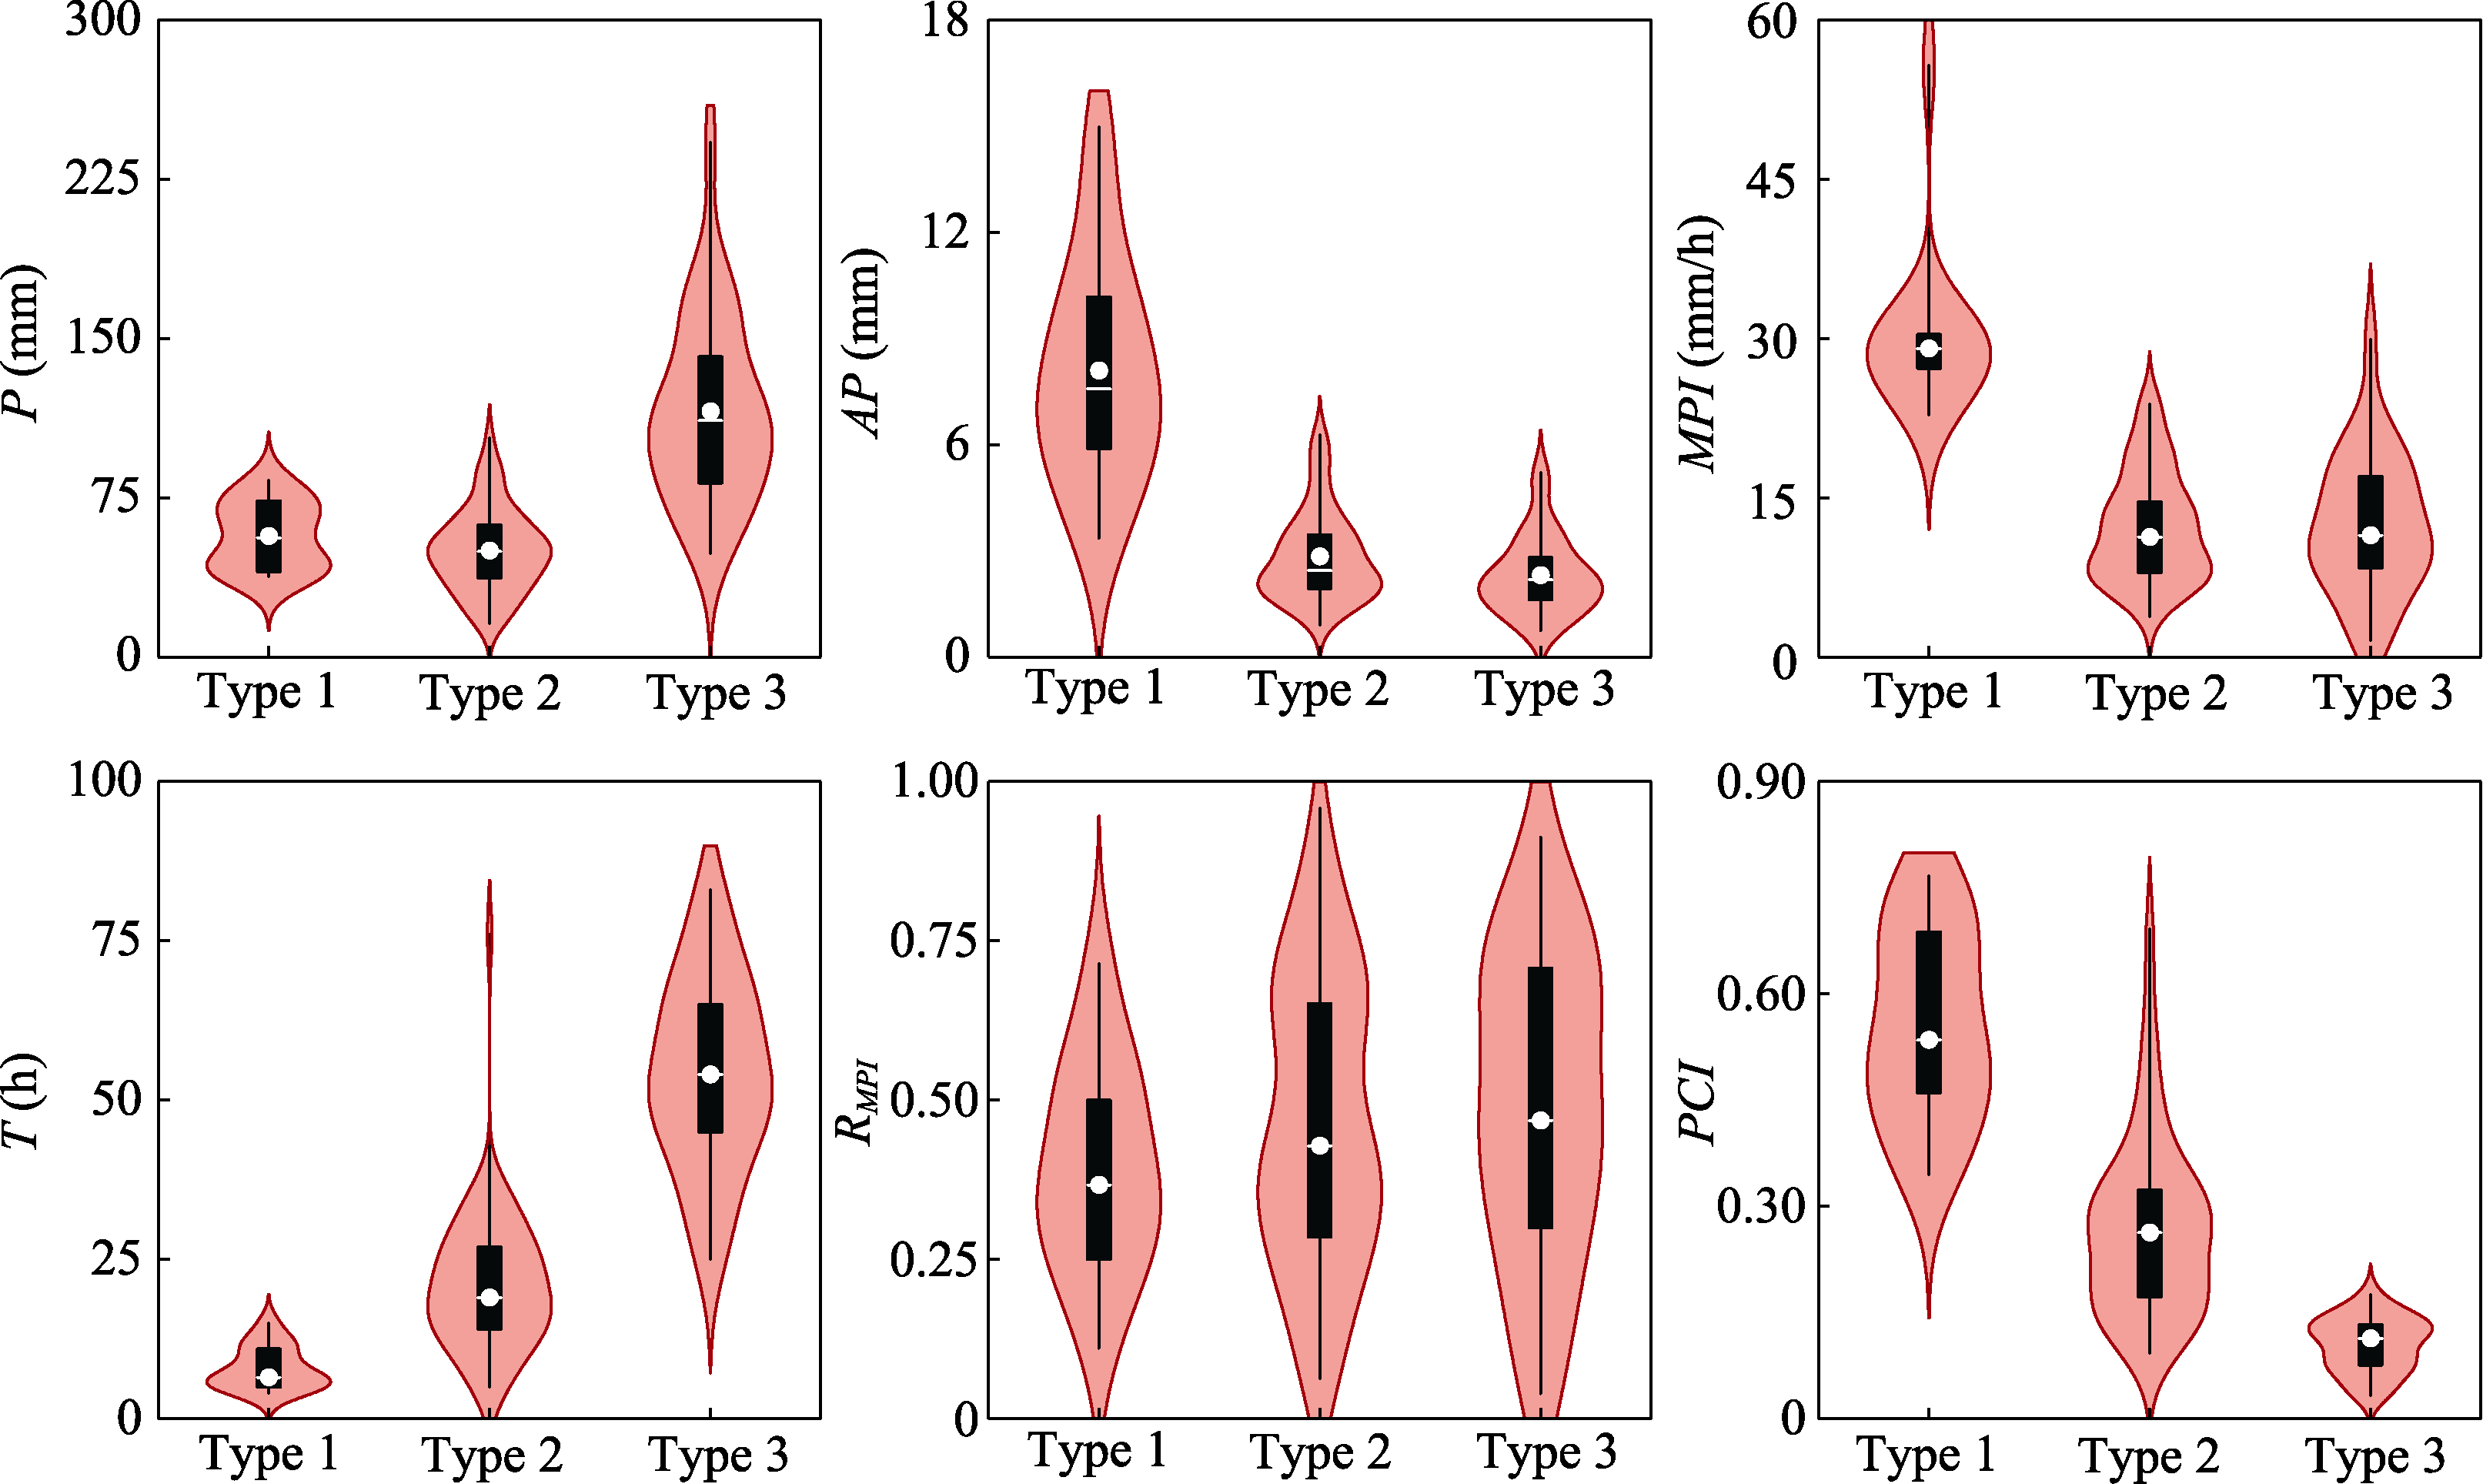
Figure 4
Distribution of rainfall characteristic indices for three rainfall types
Notes: Boxes represent the ranges from the 25th to the 75th quartiles, whiskers represent the ranges from the minimum to the maximum, and dots and lines in boxes represent the averages and the medians, respectively.
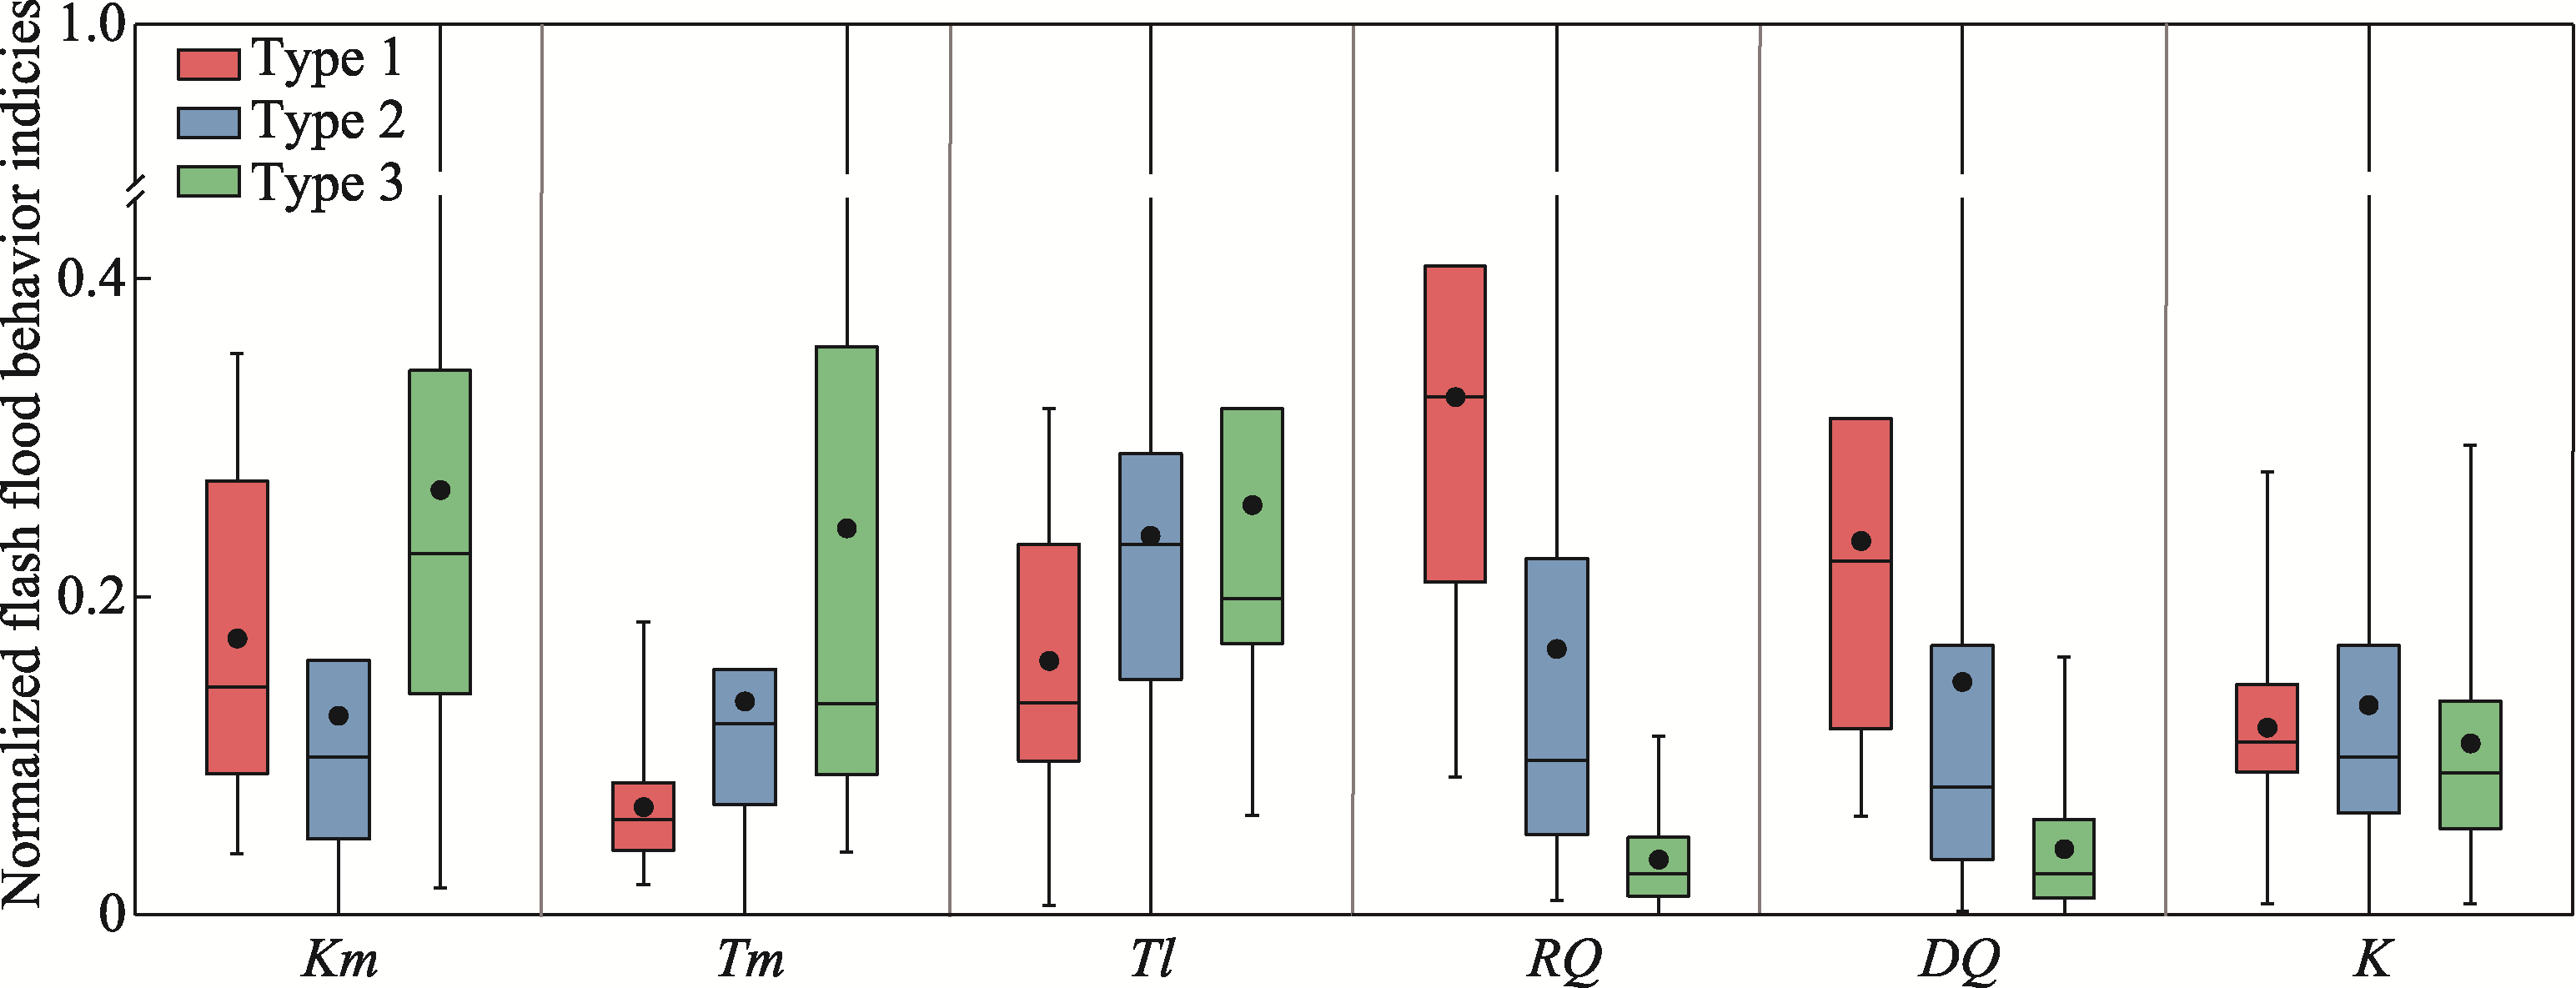
Figure 5
Distribution of normalized flash flood behavior indices induced by three rainfall types
Notes: The flash flood behavior indices are normalized using
$Y*=\frac{Y-{{Y}_{\min }}}{{{Y}_{\max }}-{{Y}_{\min }}},$
where
Y
* and
Y
are values before and after normalization, respectively;
Y
max
and
Y
min
are the maximum and the minimum, respectively. Boxes represent the ranges from the 25th to the 75th quartiles, whiskers represent the ranges from the minimum to the maximum, and dots and lines in boxes represent the averages and the medians, respectively.
Table 3
Evaluation indices for flash flood process simulation
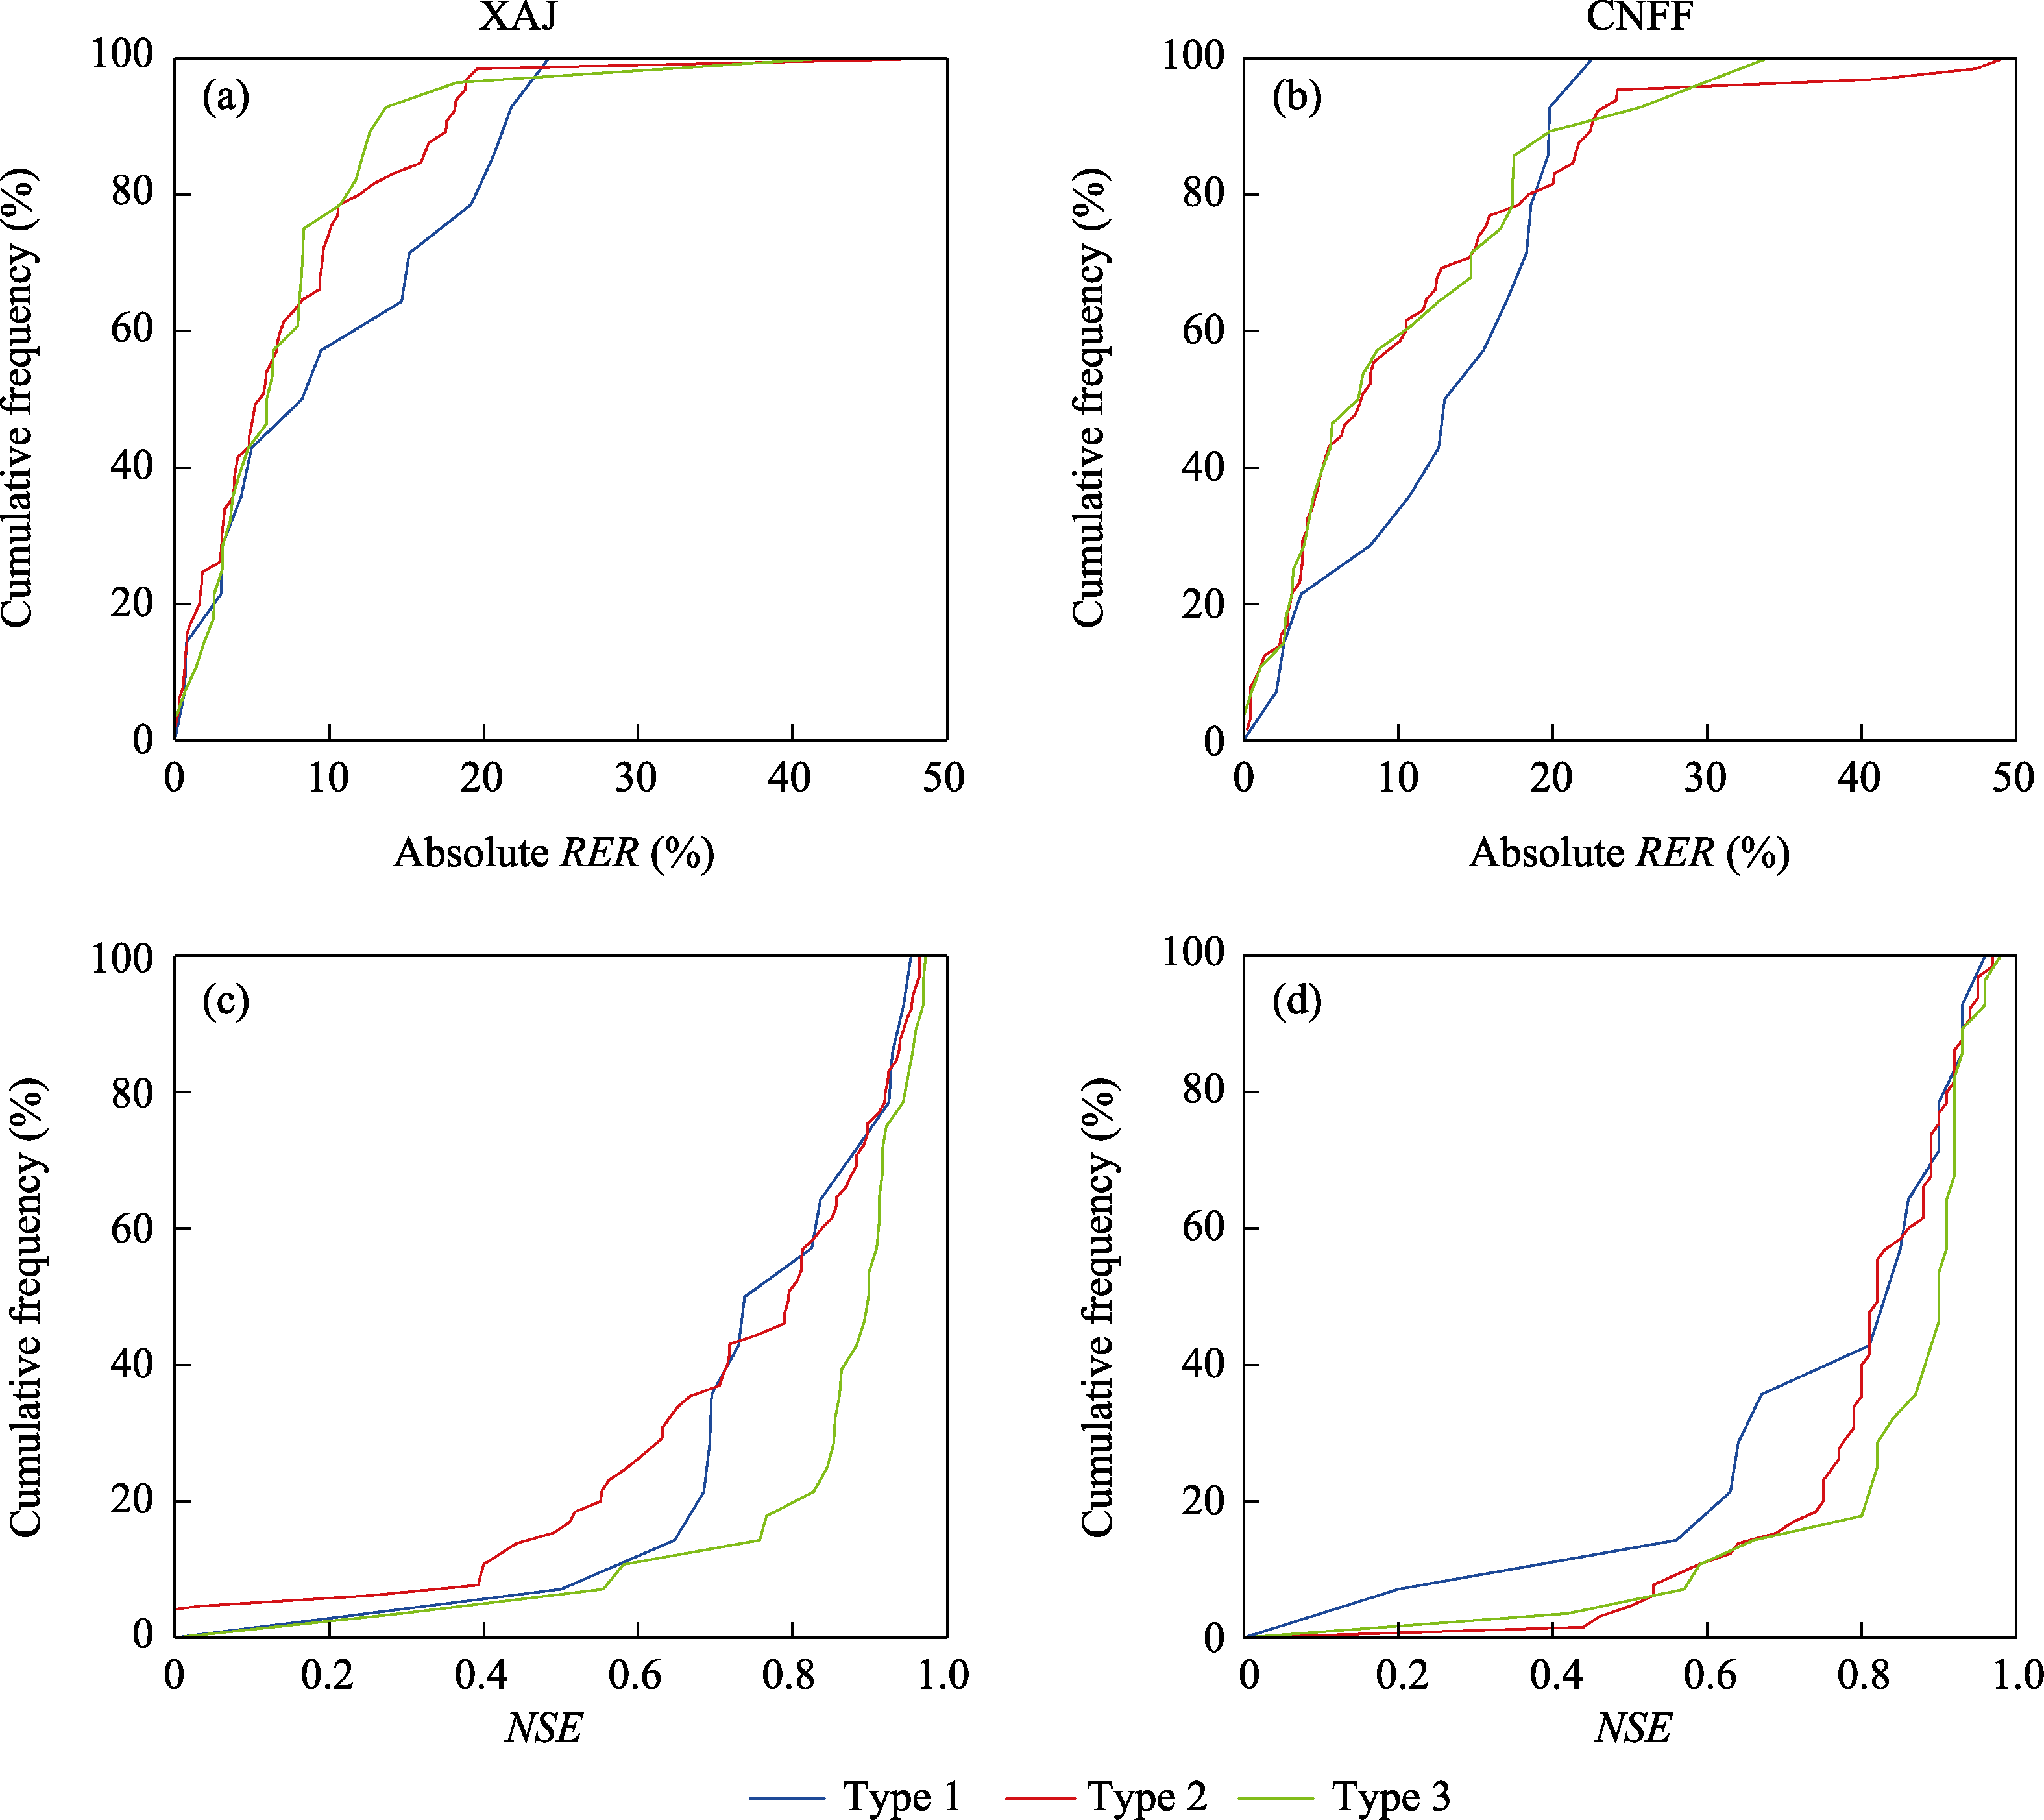
Figure 6
Cumulative frequency distribution of absolute RER and NSE for three rainfall types
Notes: (a) and (c) are the absolute
RER
and
NSE
by XAJ, (b) and (d) are the absolute
RER
and
NSE
by CNFF.
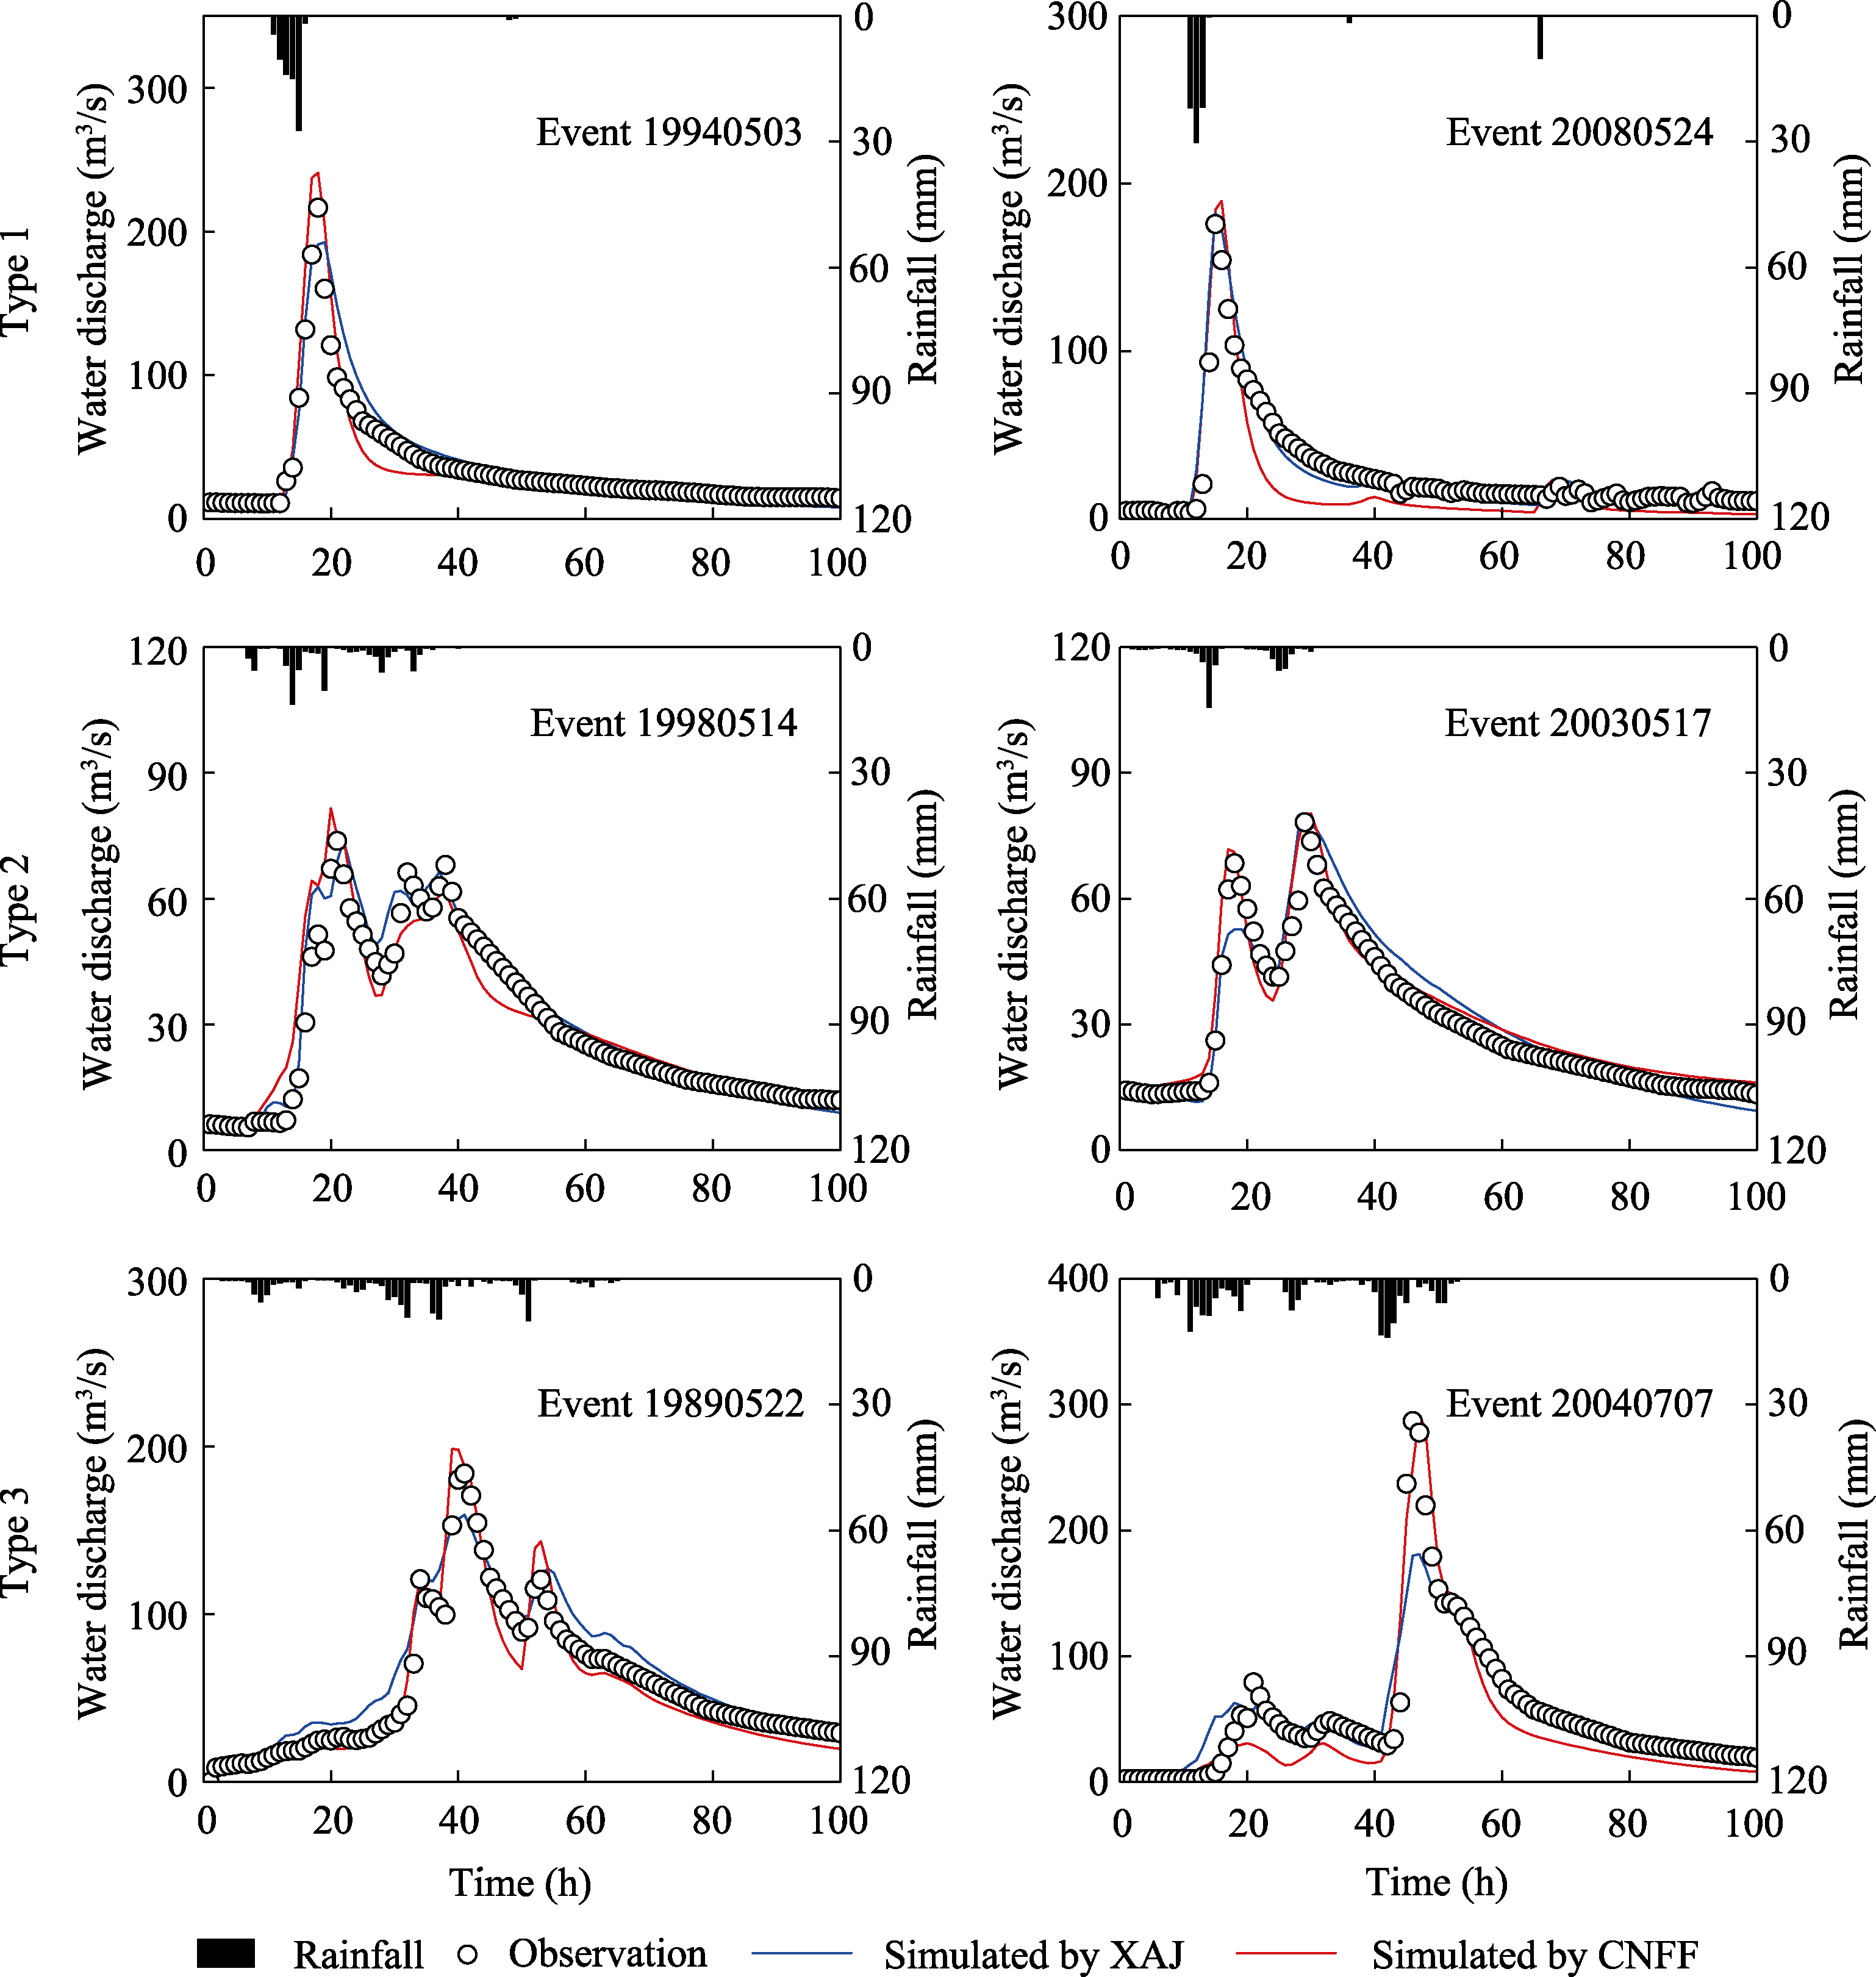
Figure 7
Observed and simulated flash flood processes of partial events
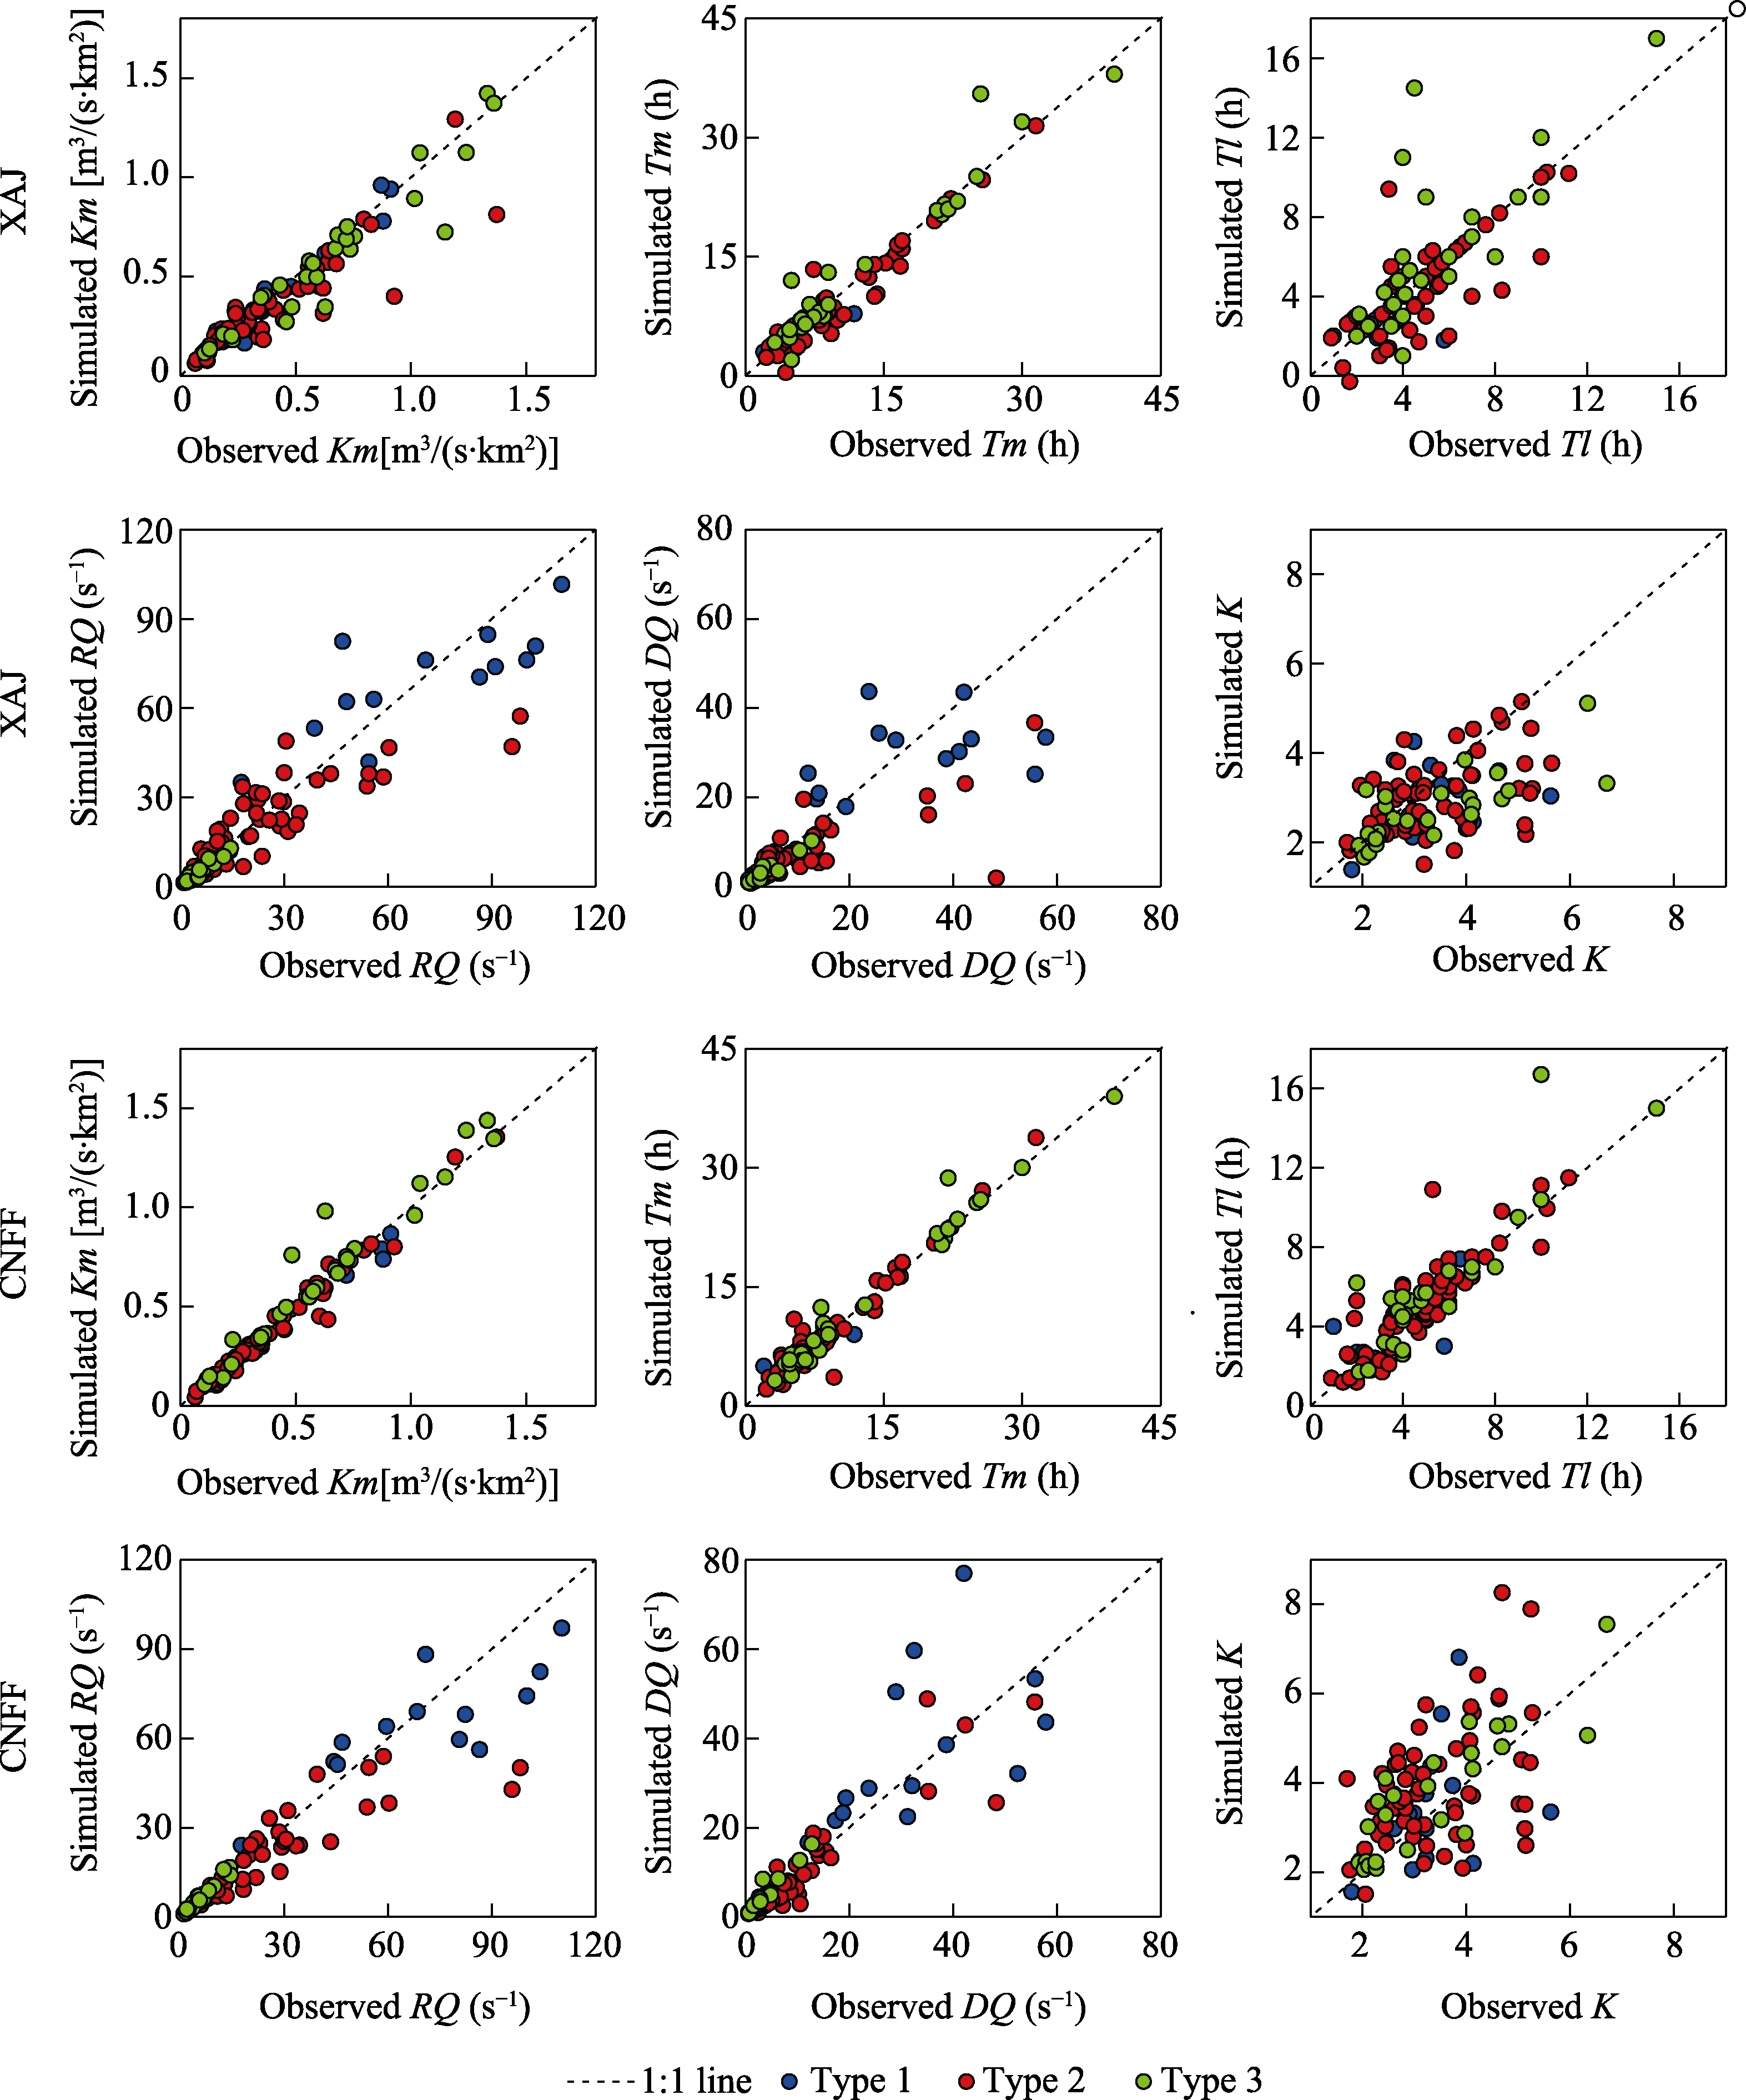
Figure 8
Observed and simulated flash flood behavior indices for XAJ and CNFF
Table 4
Evaluation indices for flash flood behavior simulations
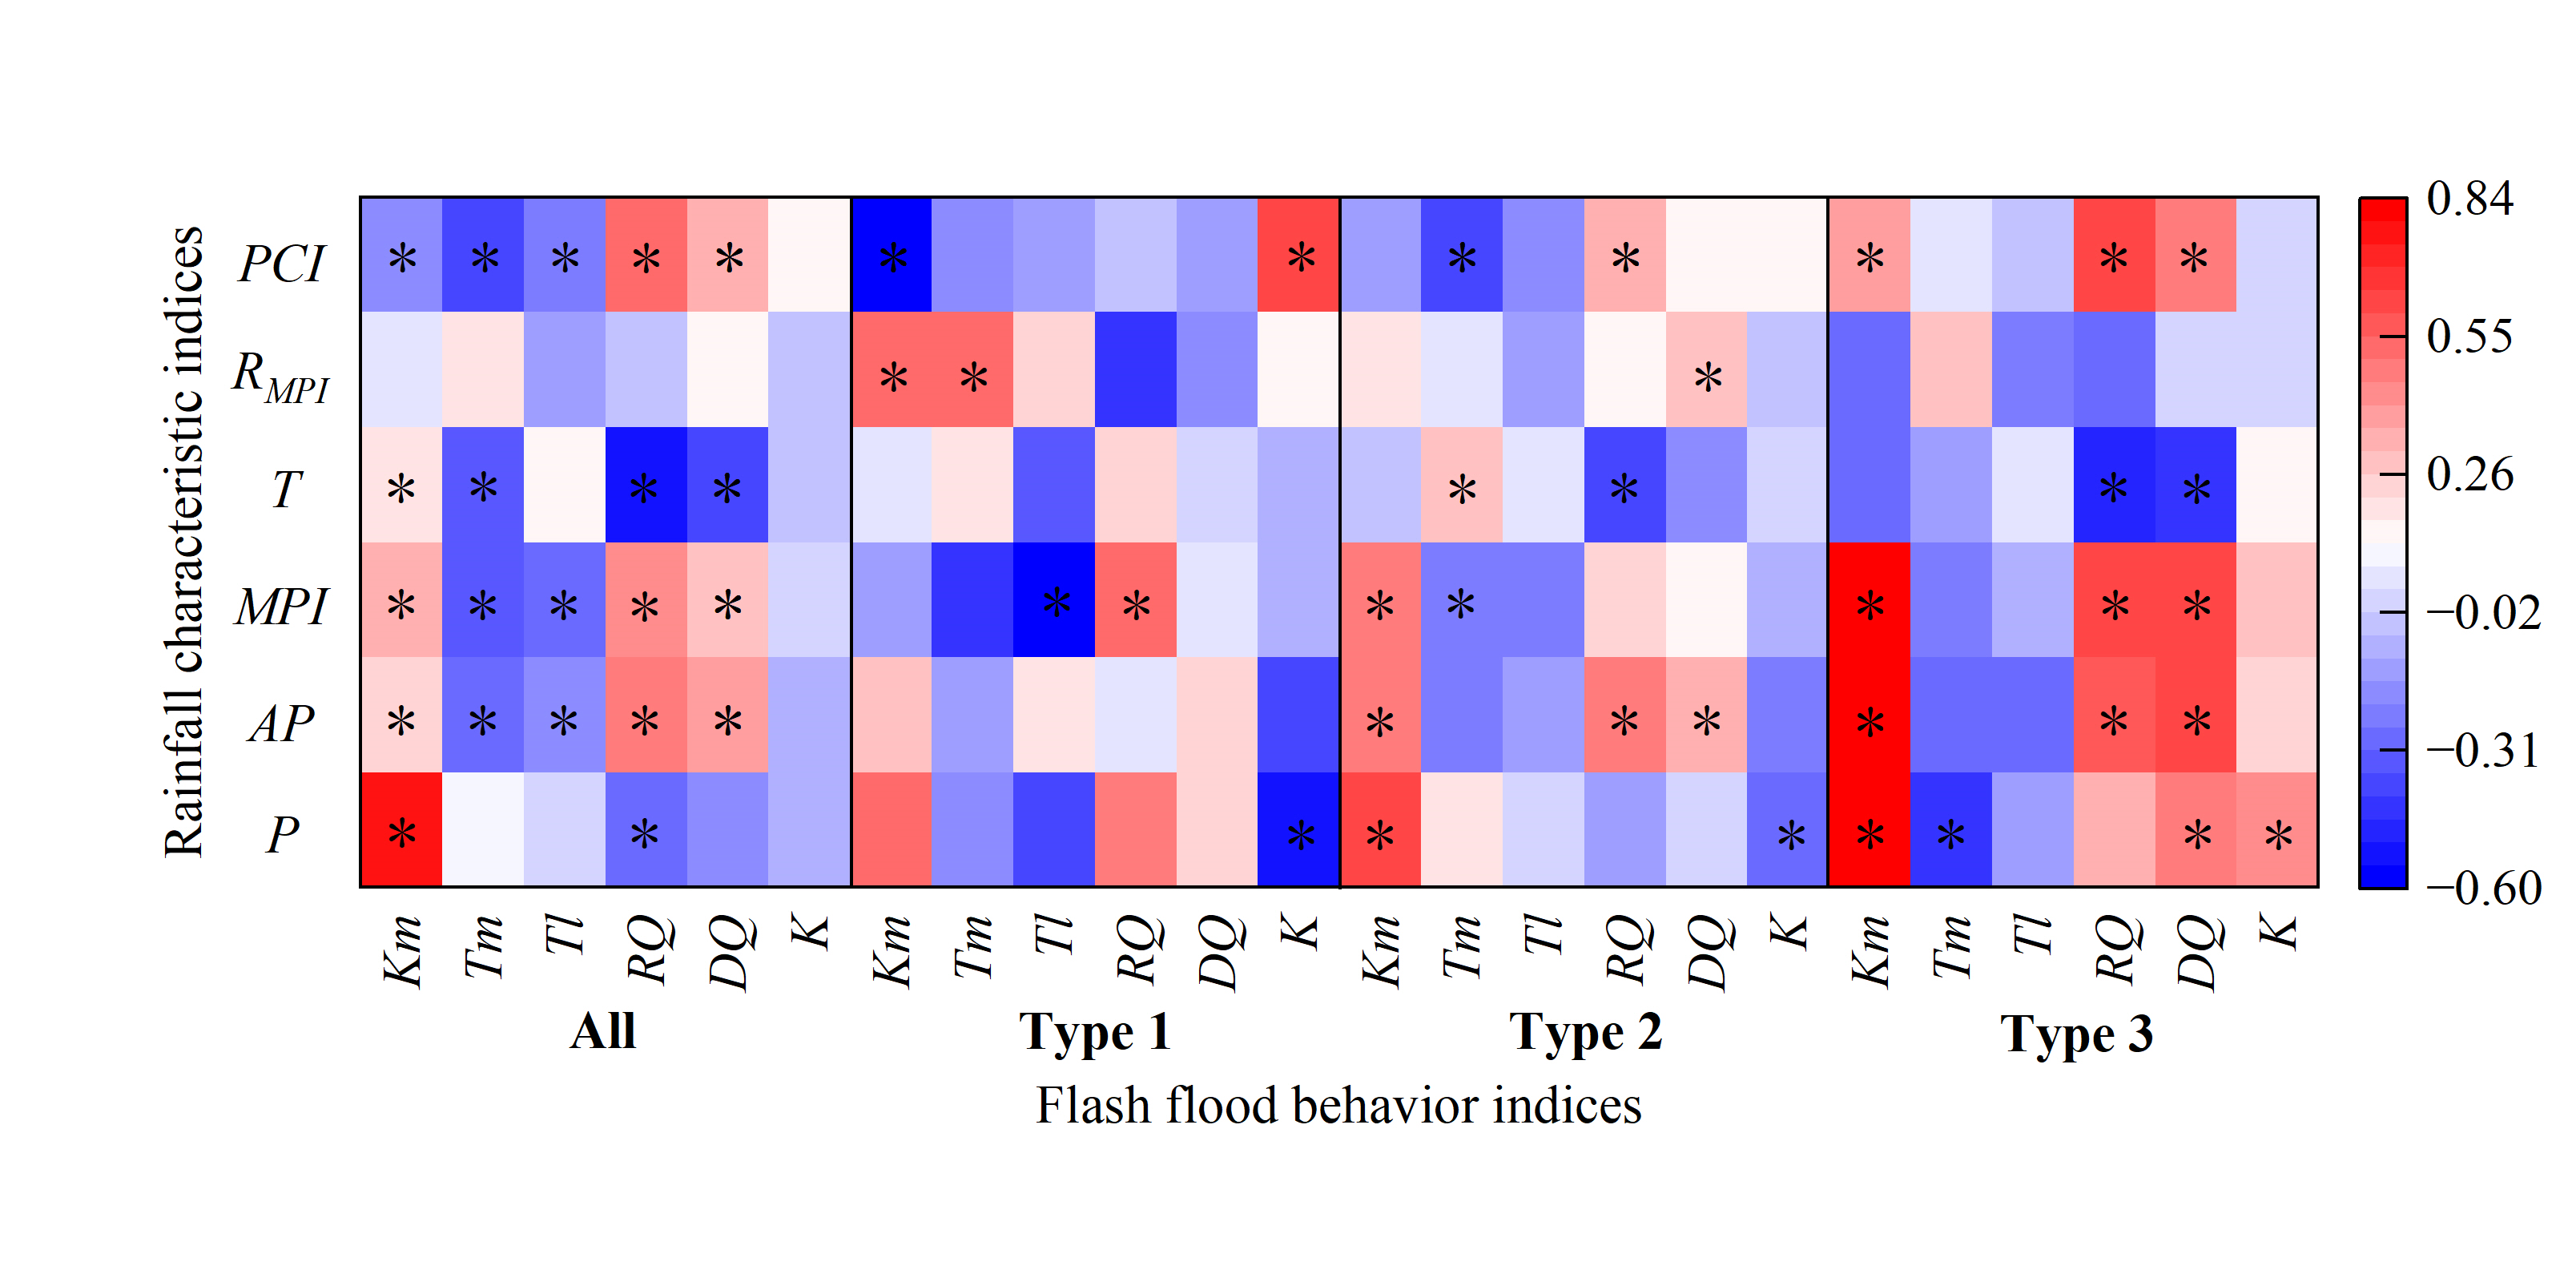
Figure S1
Correlation coefficients between flash flood behavior indices and rainfall characteristic indices for all events and three rainfall types. * indicates the correlation coefficient has a significance level of
p
<0.05.