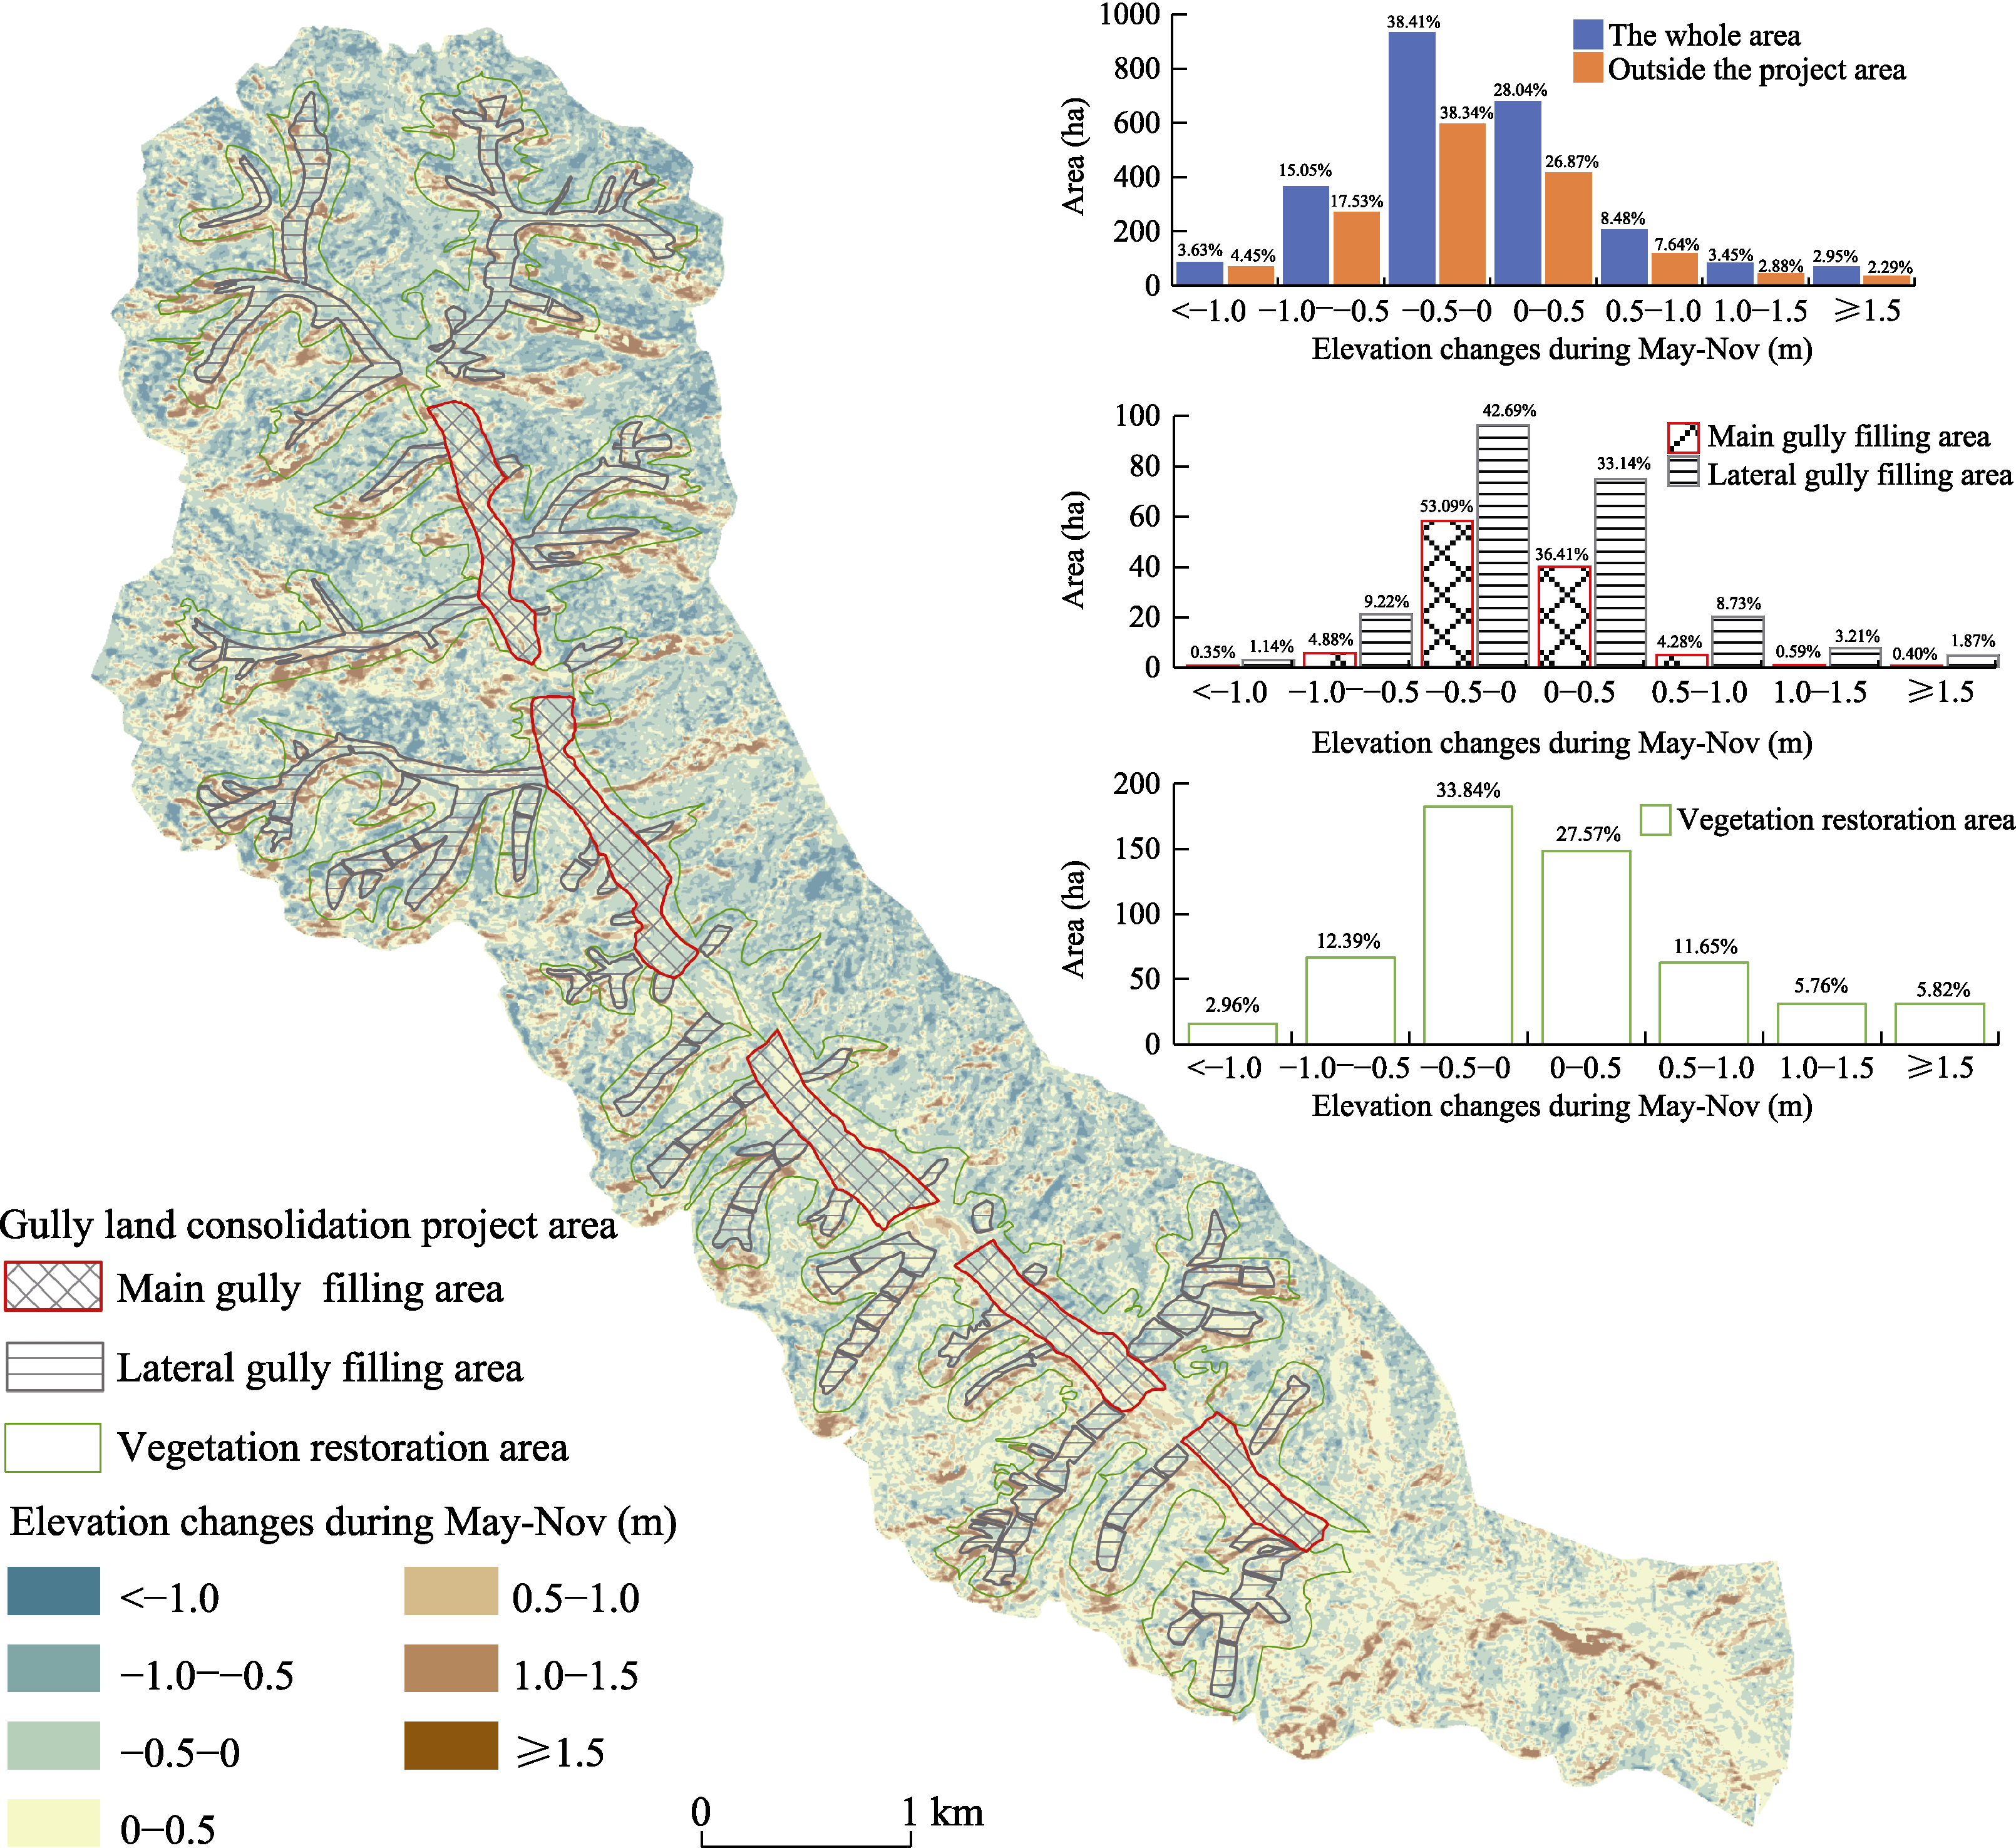
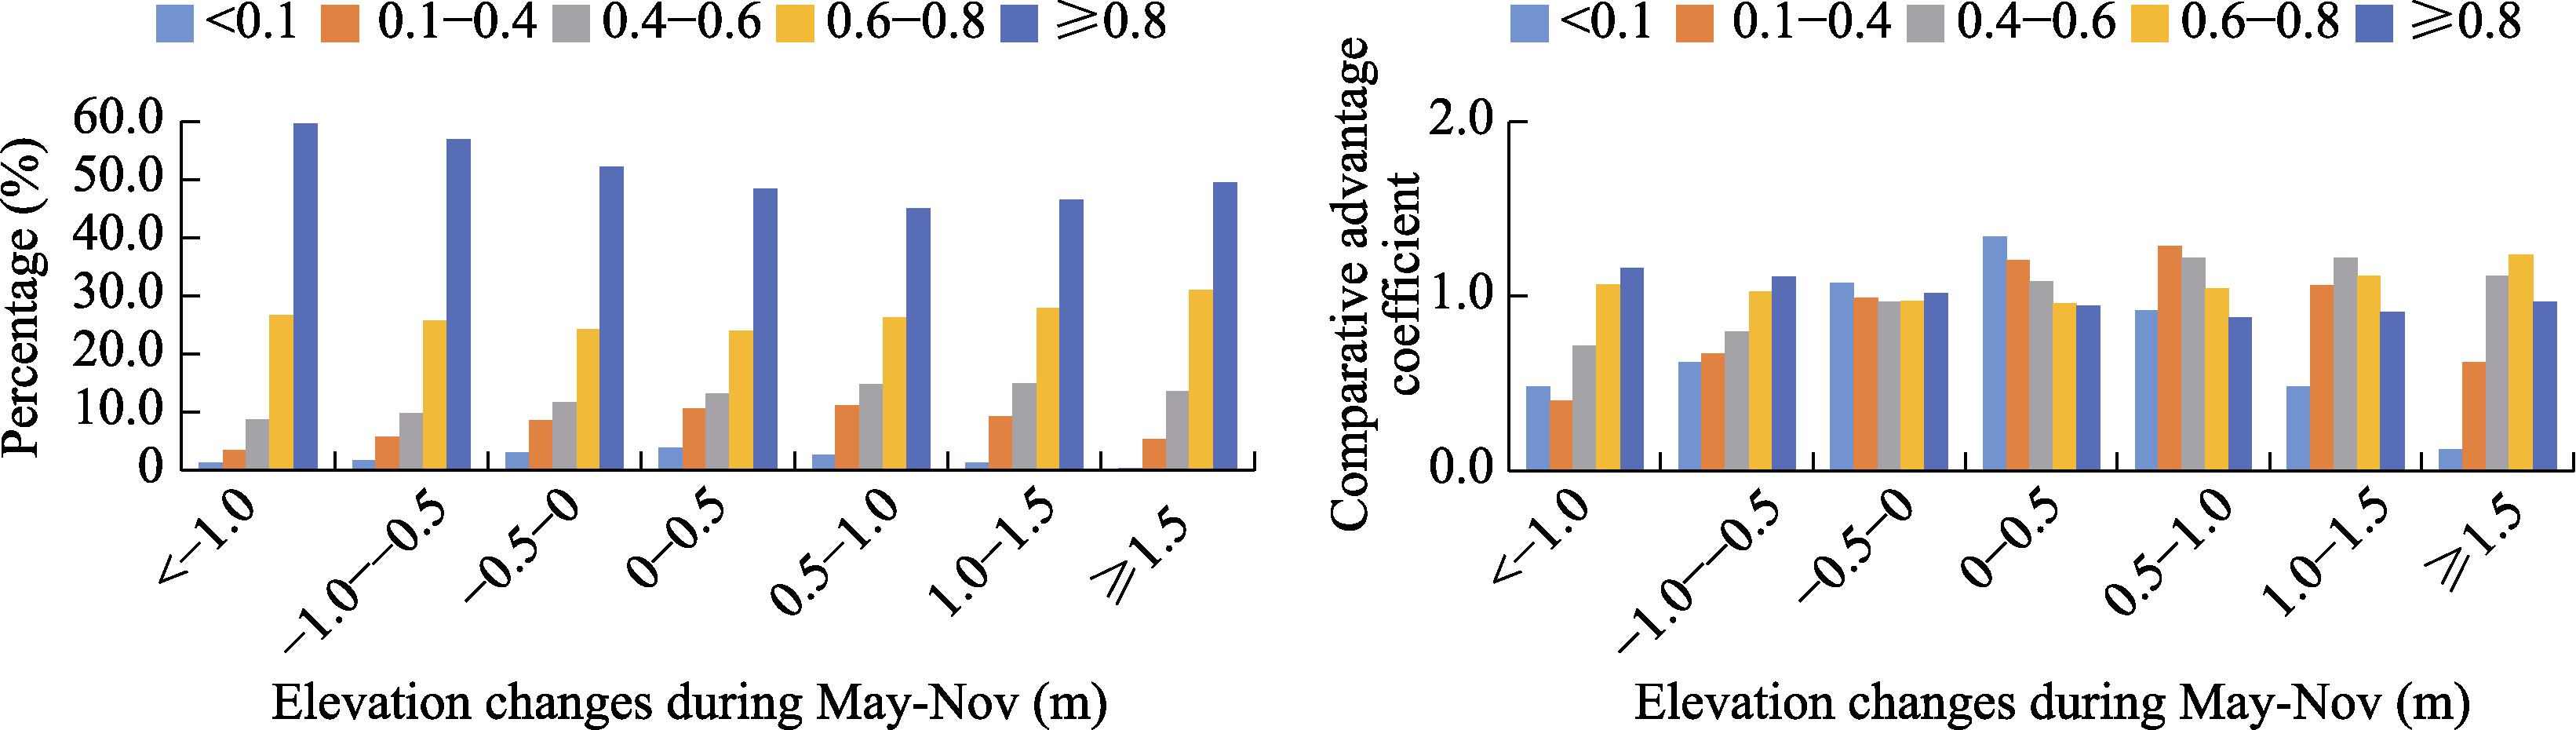
Figure 15 Comparison of changes in elevation between the Gutun catchment and the area under the Gully Land Consolidation Project Note: The histograms reflect the areas undergoing different levels of changes in elevation between the Gutun catchment and the parts of its area designated under the Gully Land Consolidation Project. The percentage labels in the histograms reflect the area ratios of different levels of changes in elevation to the corresponding area.
Other figure/table from this article