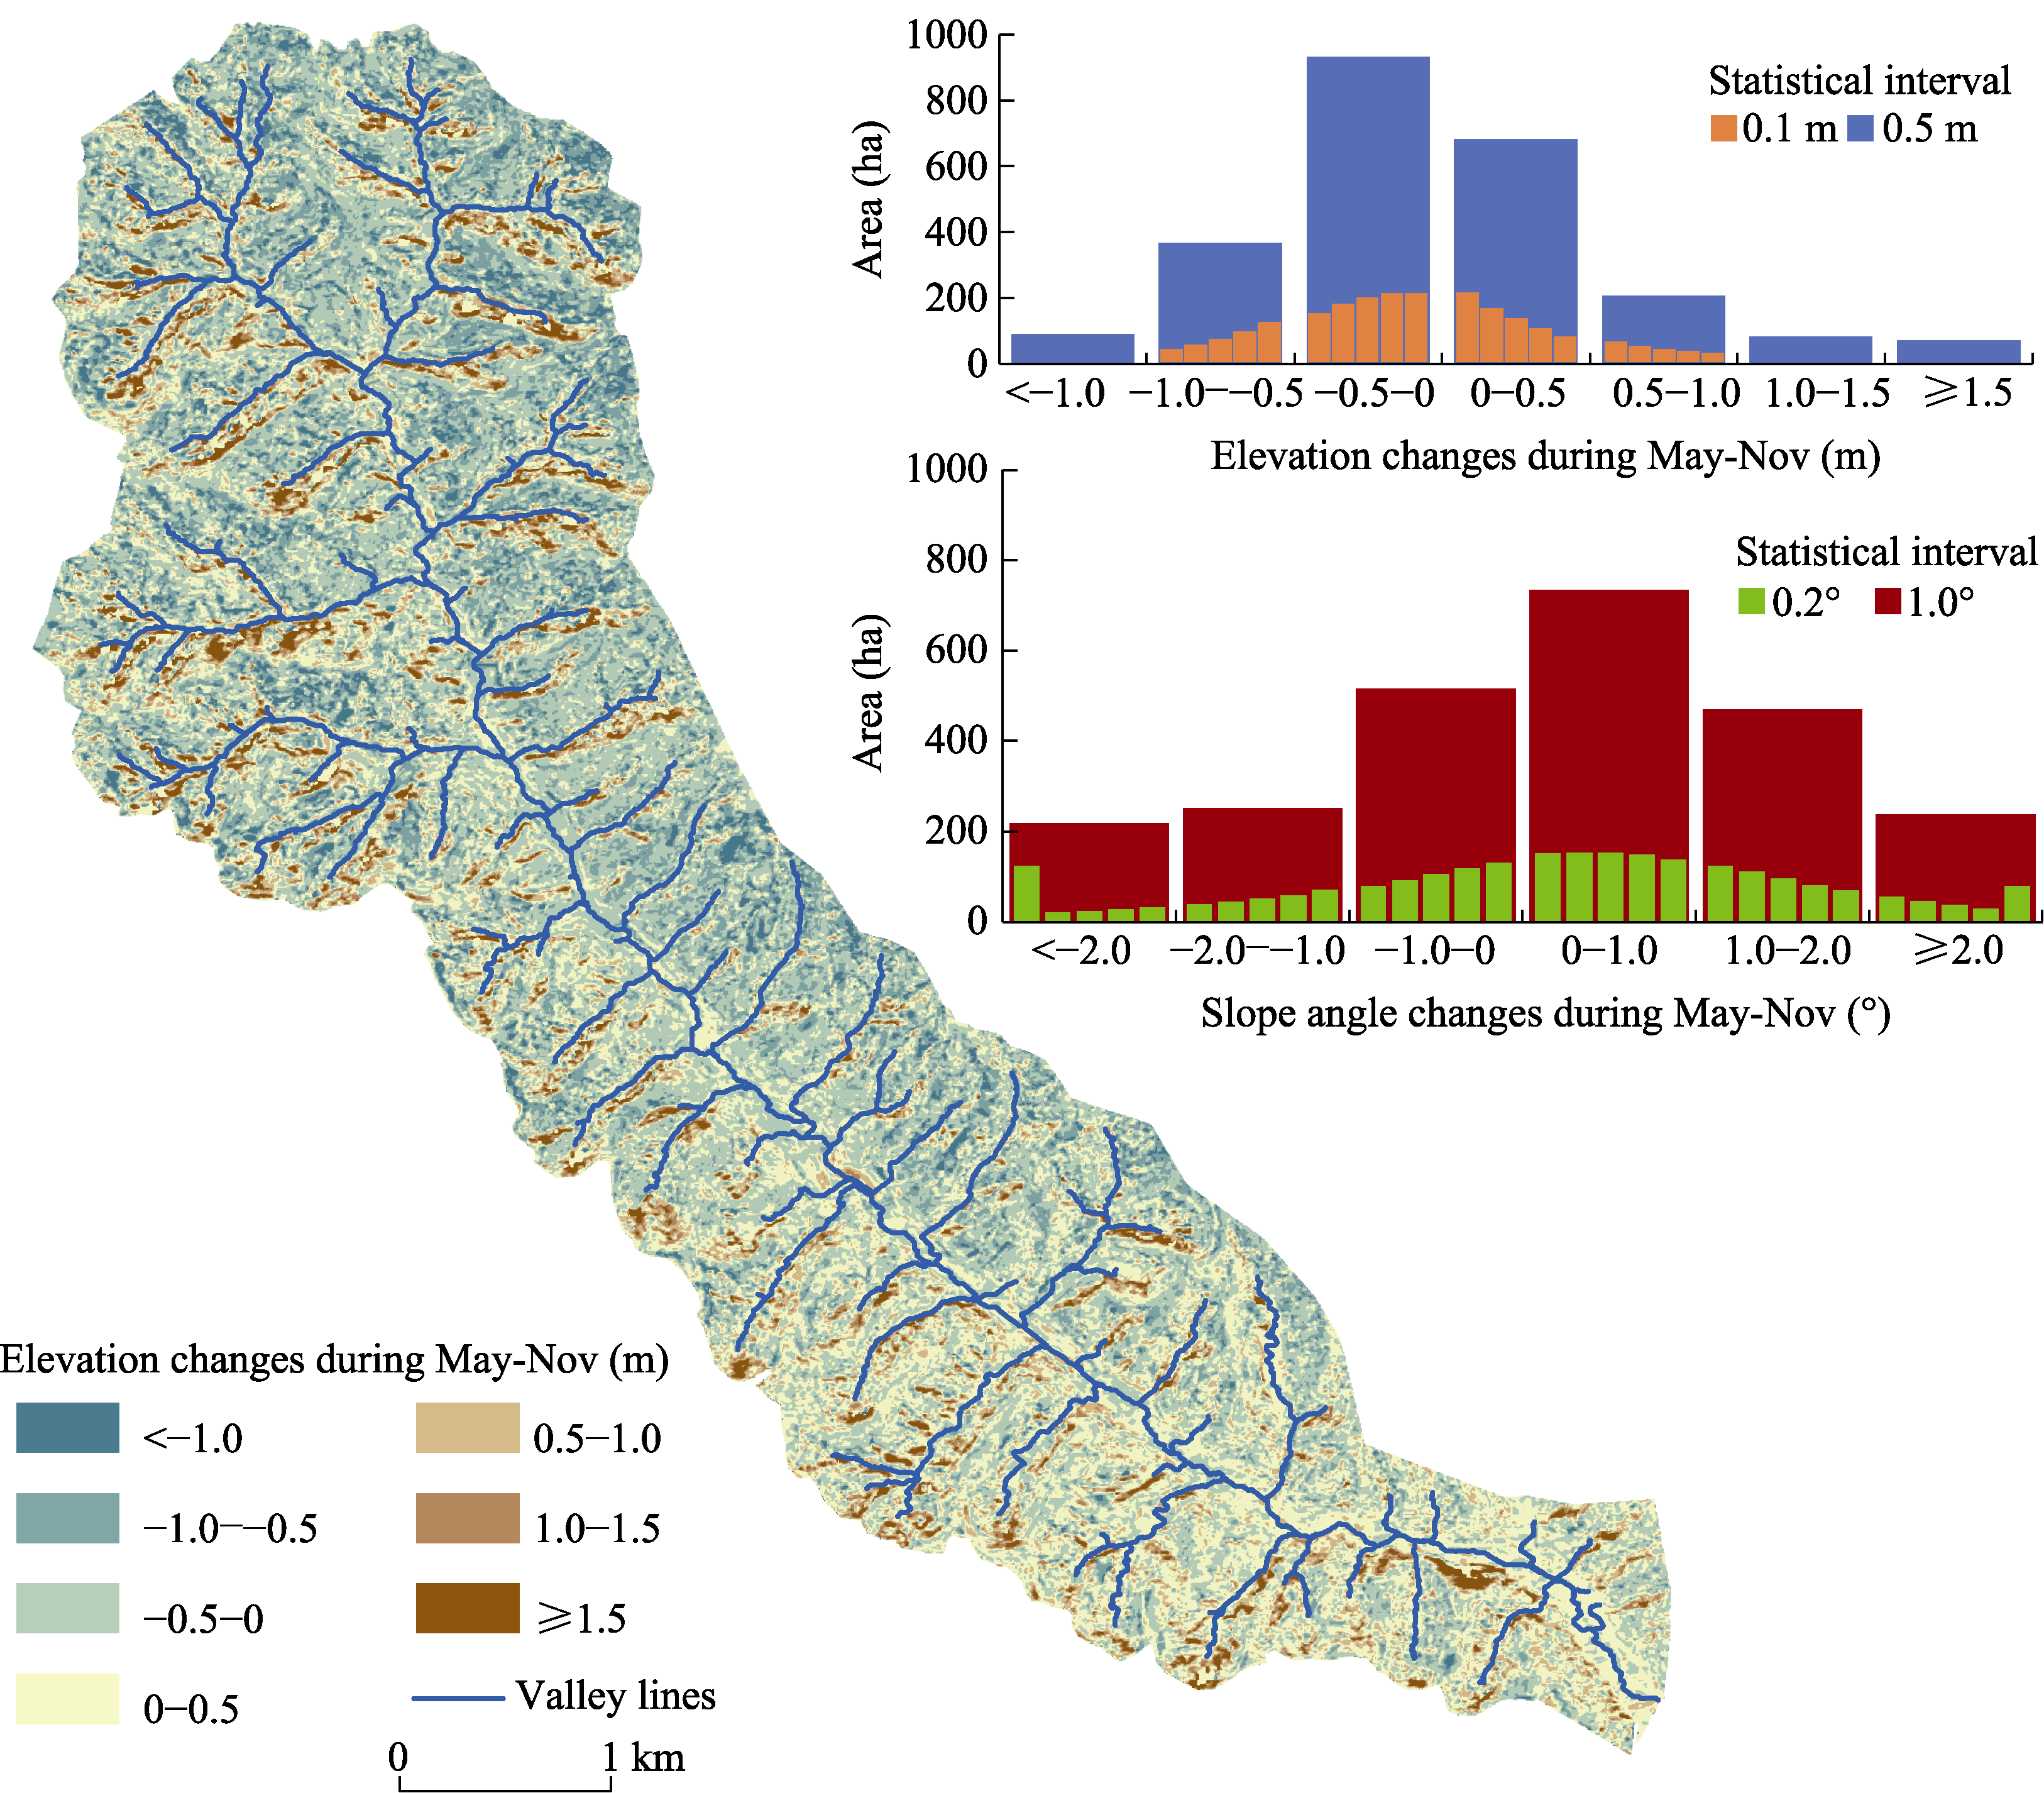
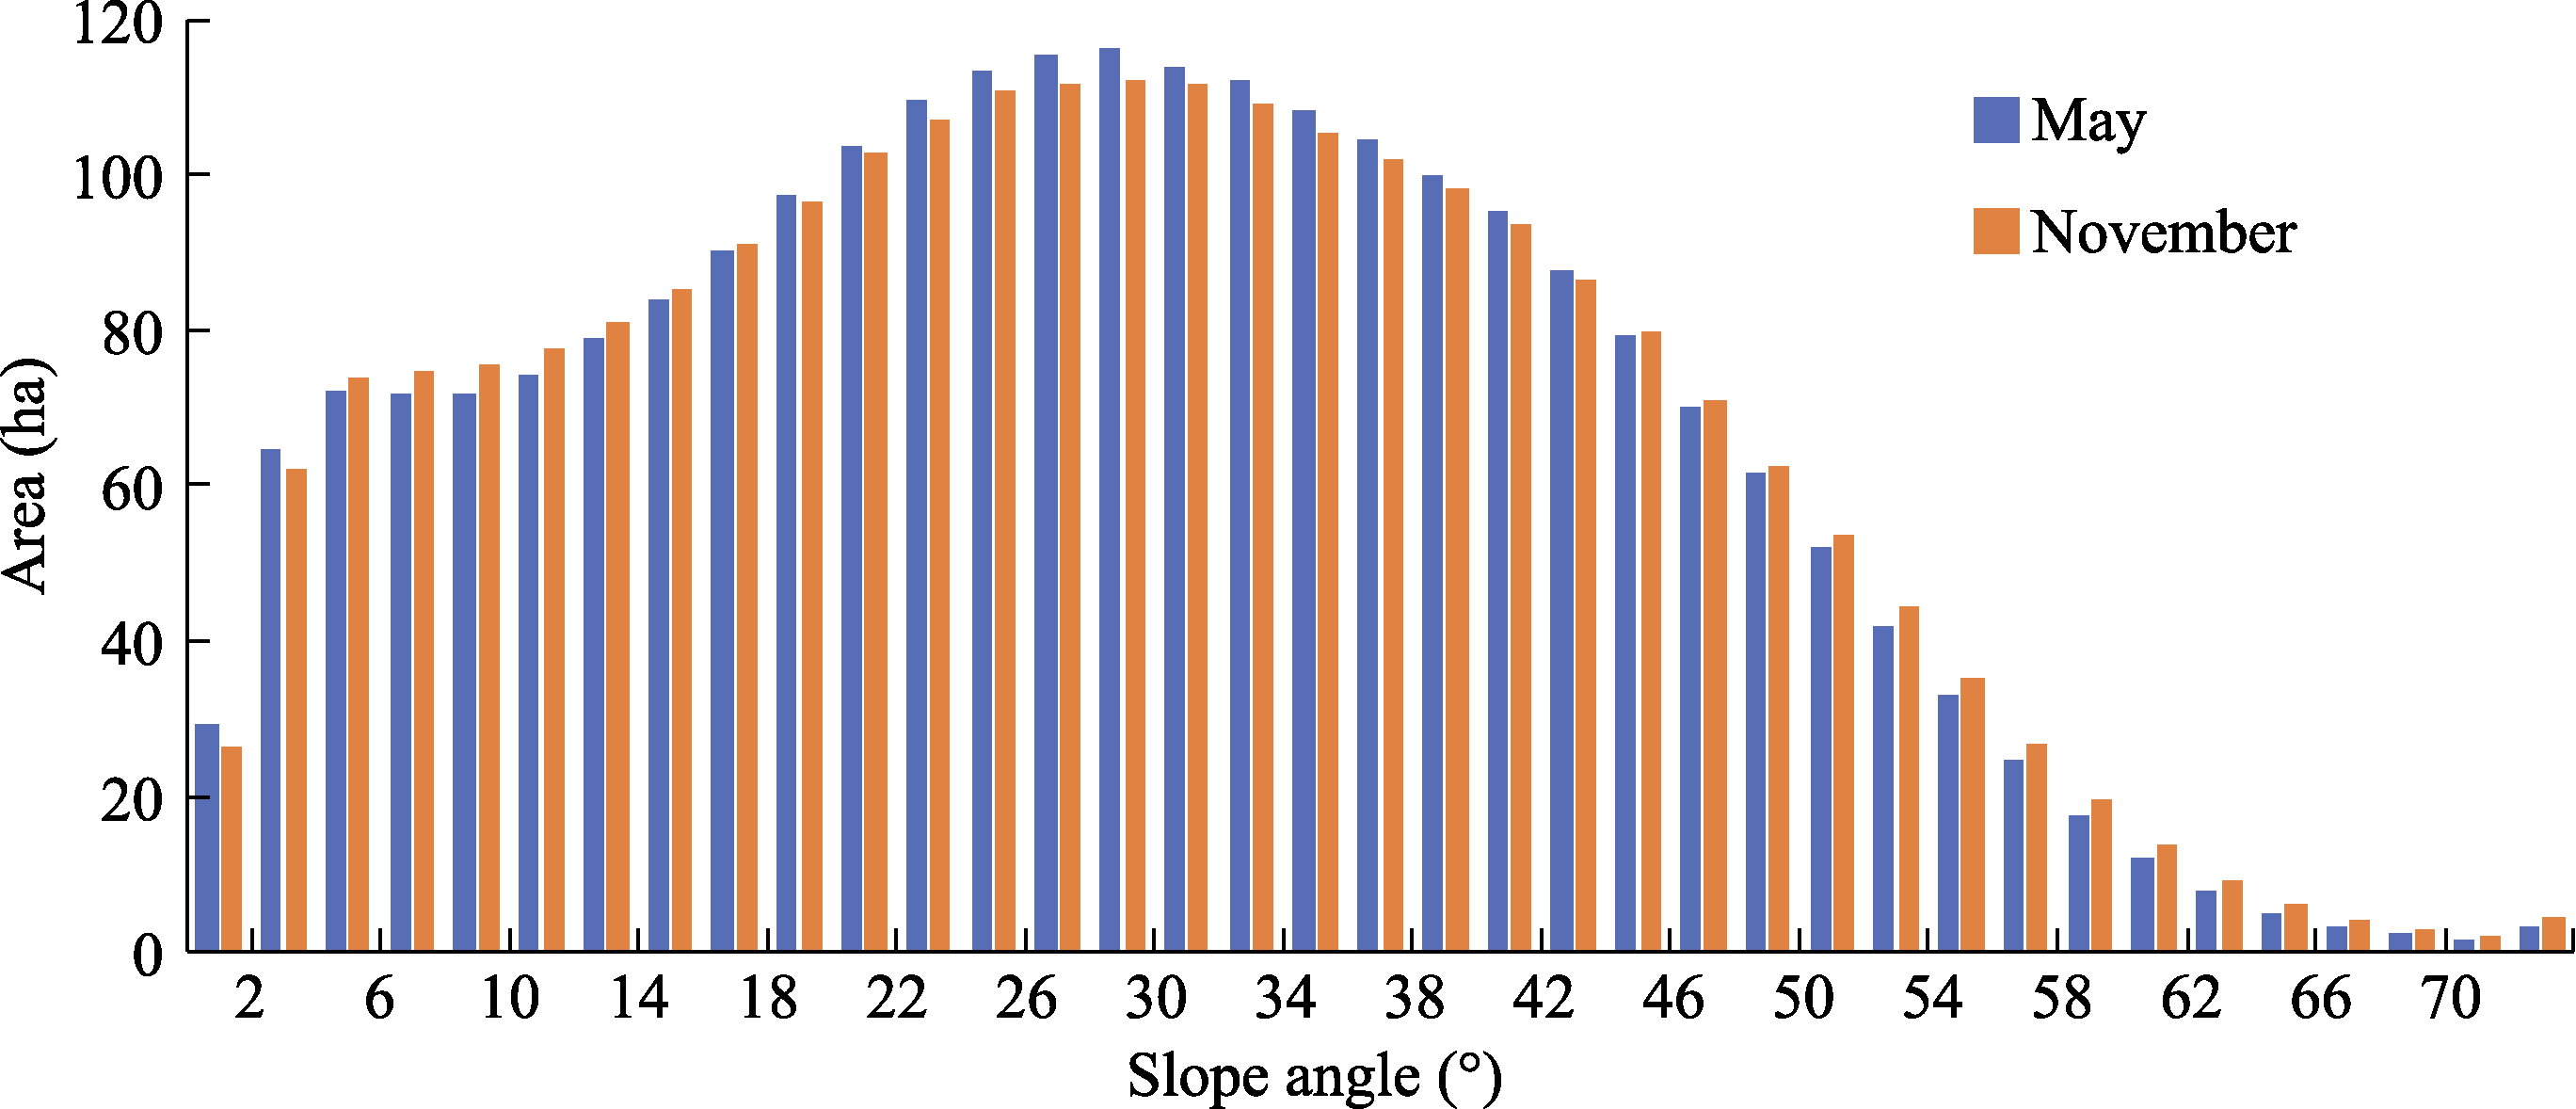
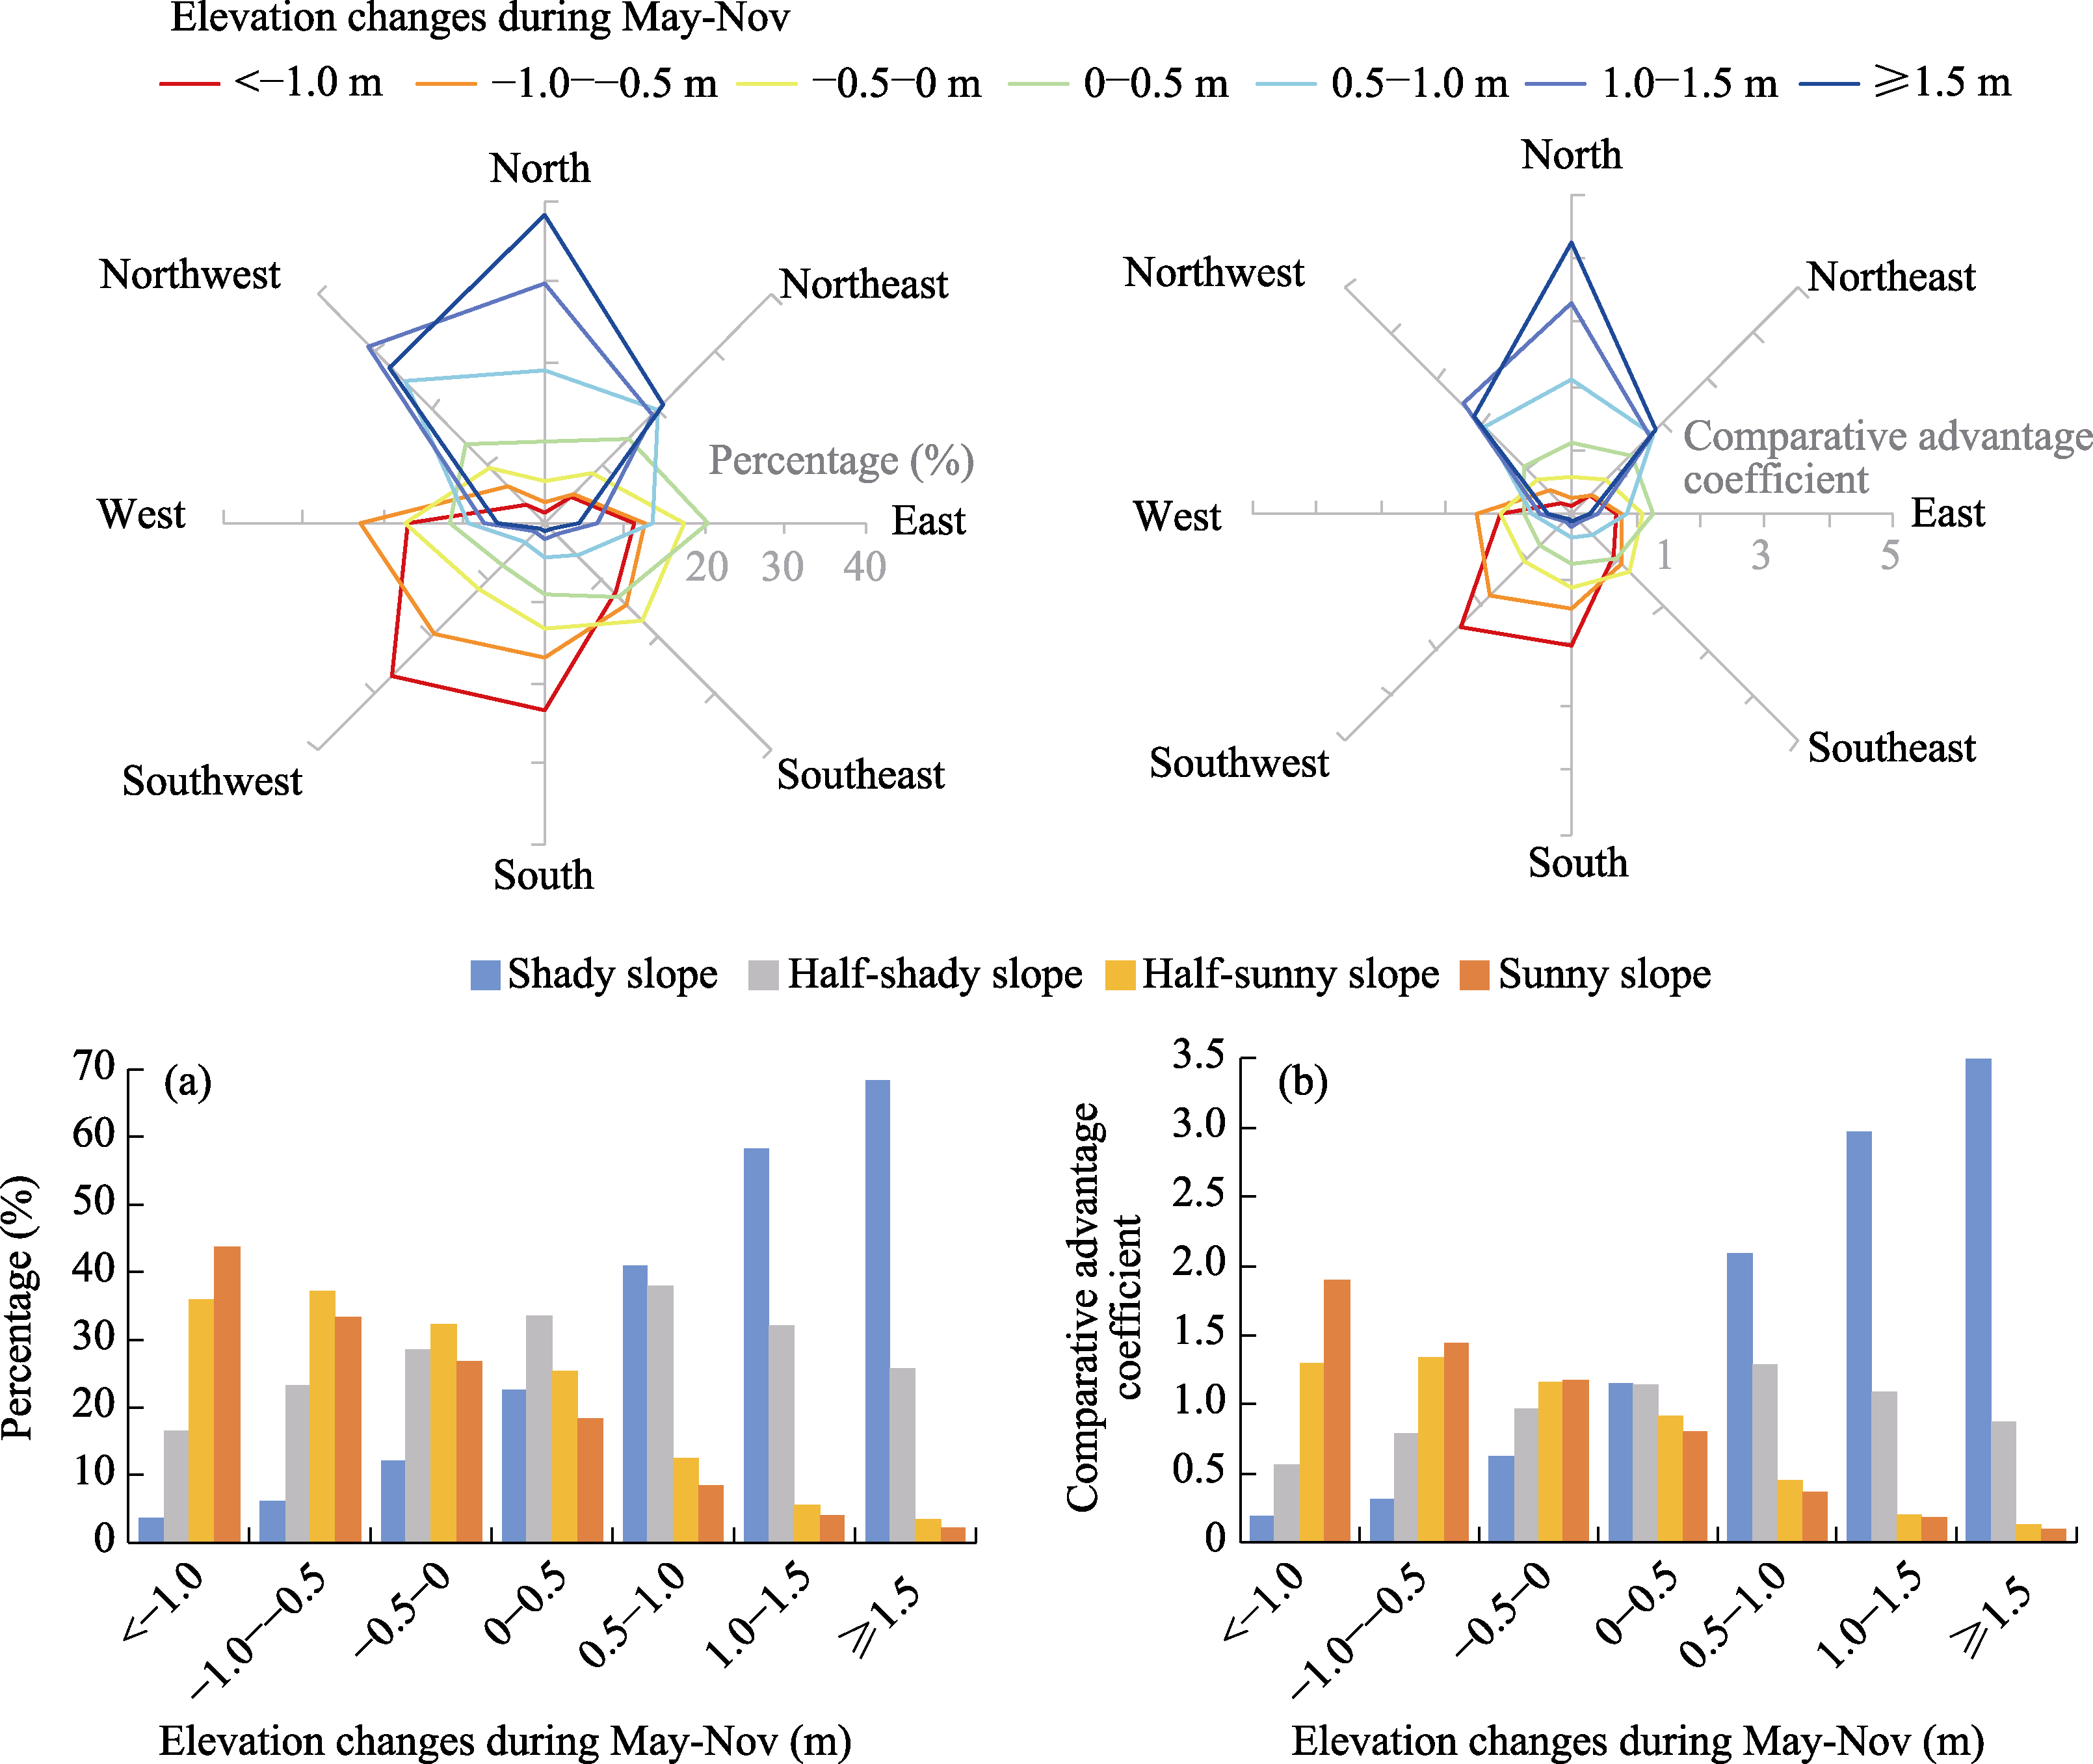
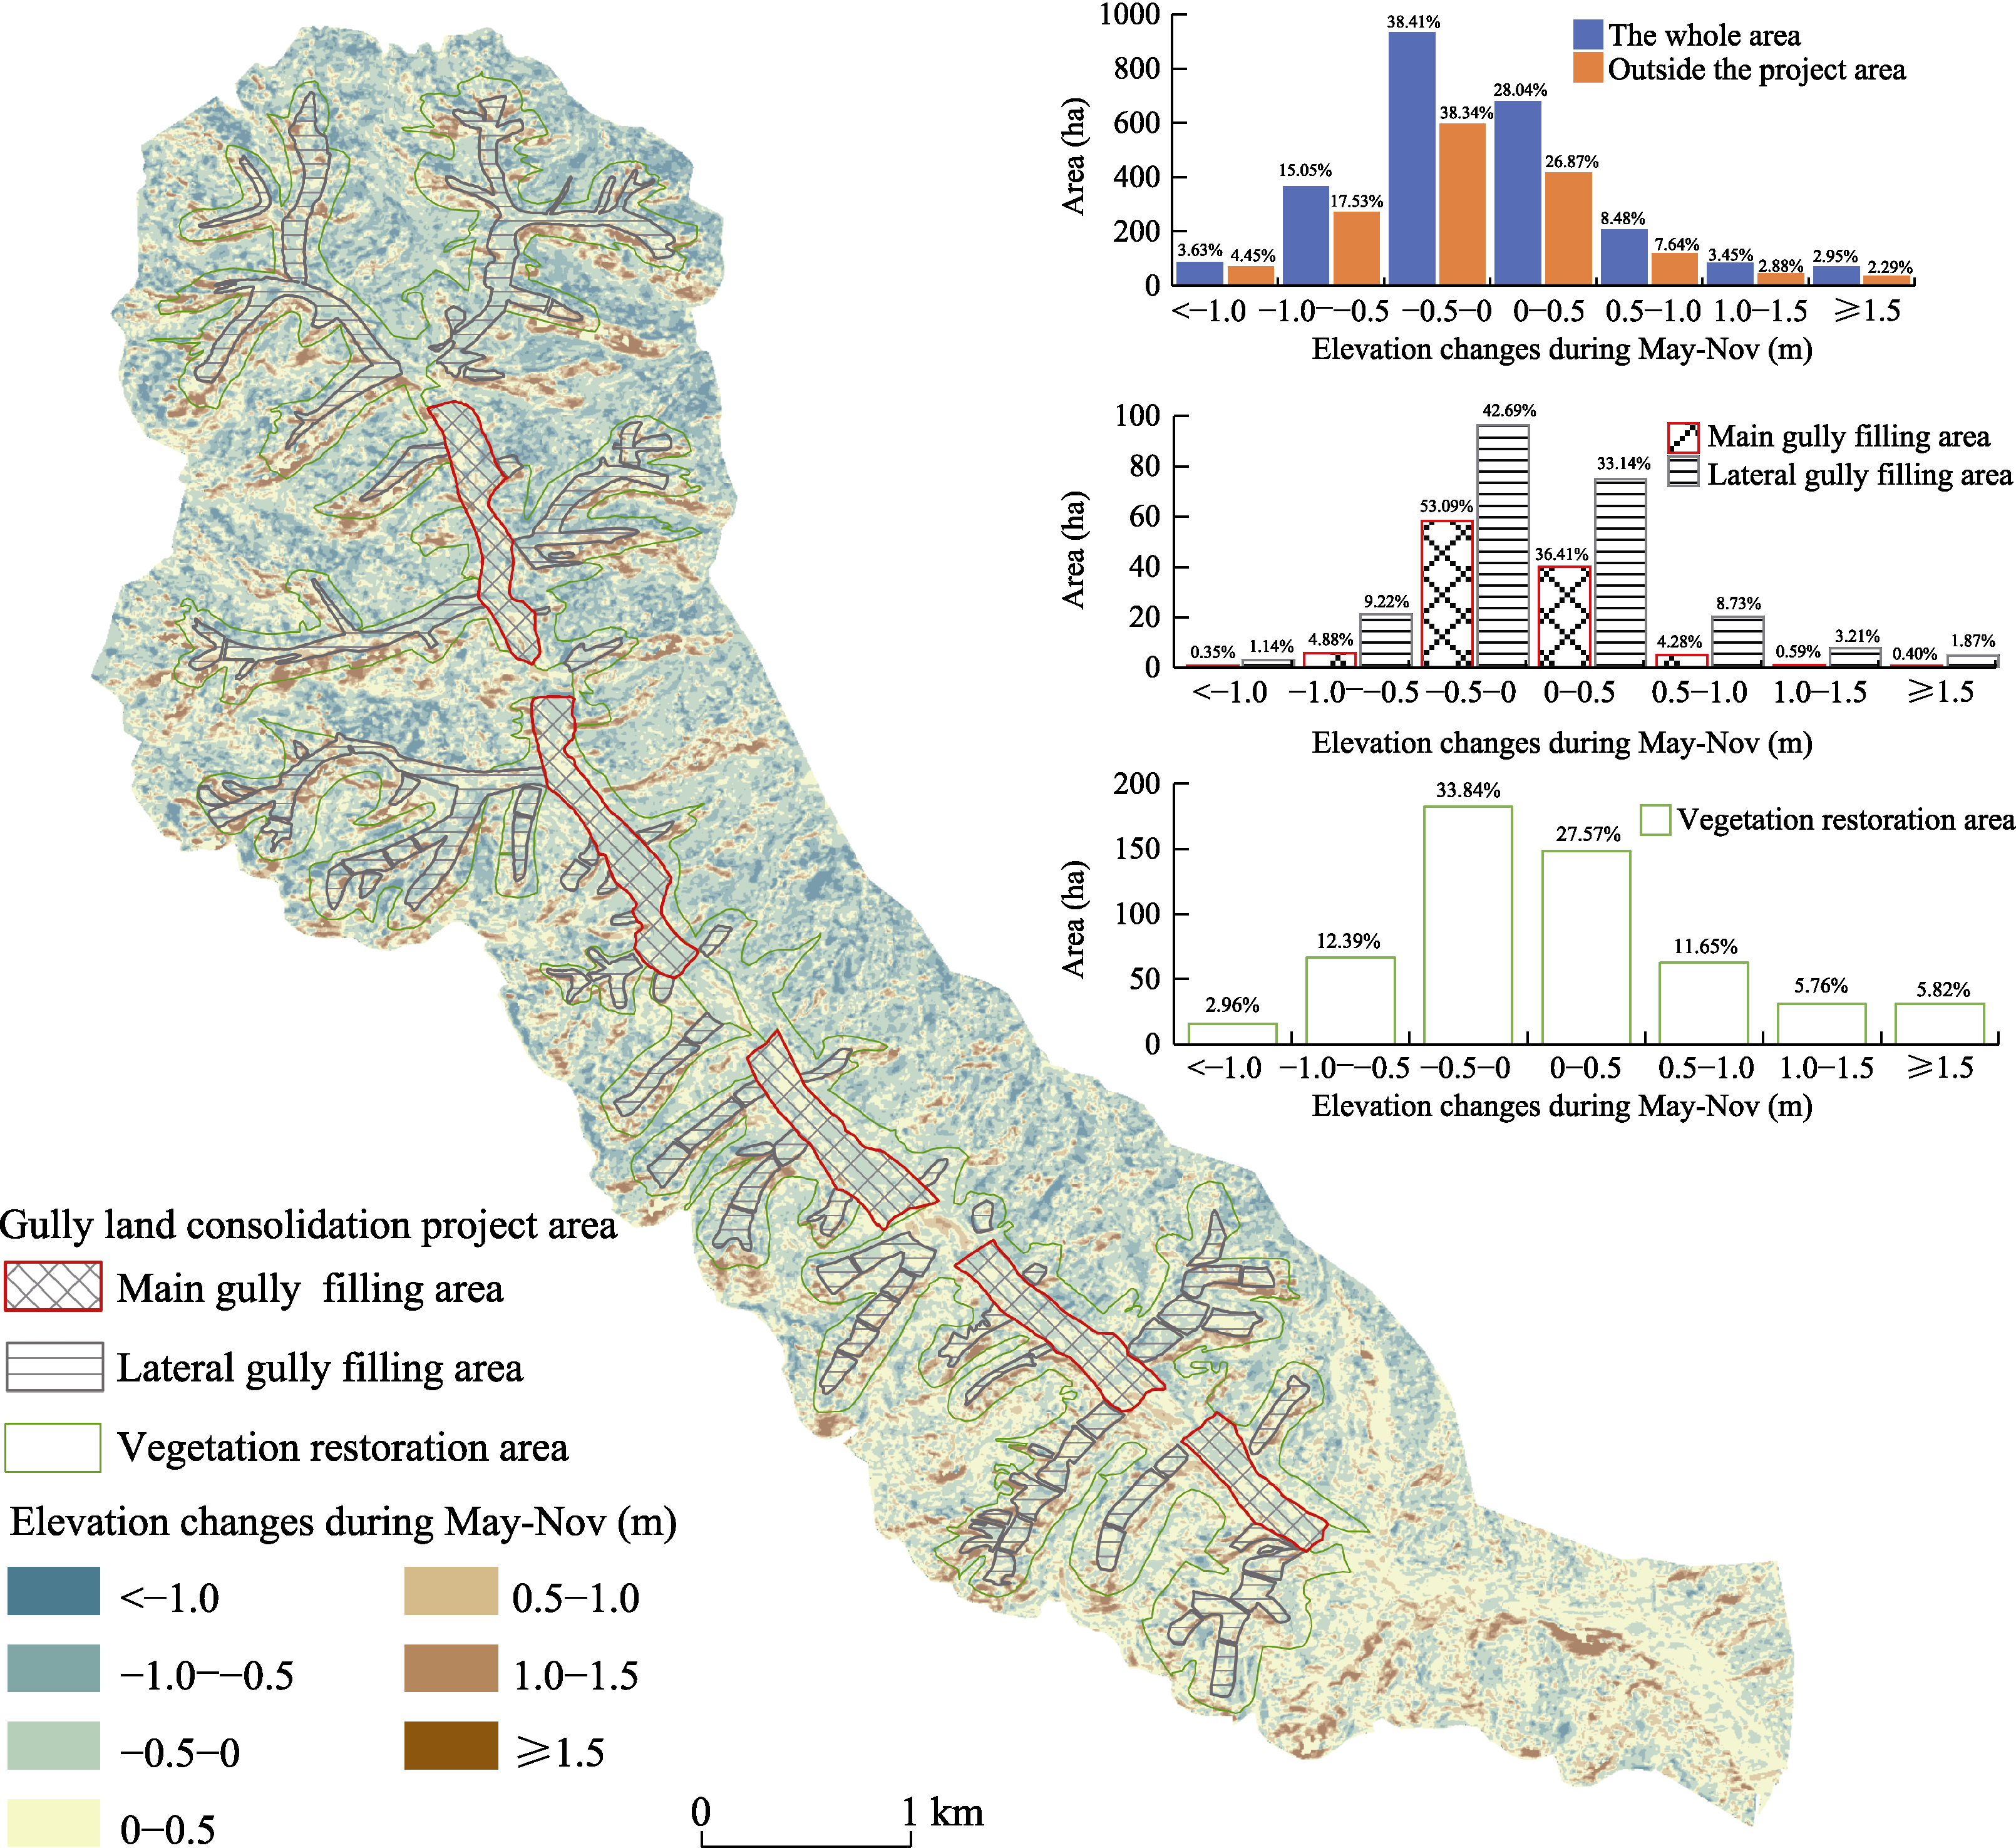
Figure 3 Patterns of changes in elevation of the Gutun catchment before and after the rainy season Note: The histograms represent the areas of changes in the elevation and slope under different statistical intervals.
Other figure/table from this article