×
模态框(Modal)标题
在这里添加一些文本
Close
Close
Submit
Cancel
Confirm
×
模态框(Modal)标题
×
Journal
Article
Figure
Search
EN
中文
Home
About Journal
About Journal
Indexed in
Awards
Editorial Board
Guide for Authors
Browse
Current Issue
Online First
Archive
Highlights
Topic
Archive by Subject
Most Viewed
Most Download
Most Cited
E-mail Alert
RSS
Subscribe
Advertisement
Contact us
EN
中文
Figure/Table detail
Distribution of topographical changes triggered by prolonged heavy rainfall in the Chinese Loess Plateau: A case study of the Gutun catchment in Yan'an
CAO Zhi, HAN Zhen, LI Yurui, WANG Jieyong
Journal of Geographical Sciences
, 2024, 34(
3
): 571-590. DOI:
10.1007/s11442-024-2218-y
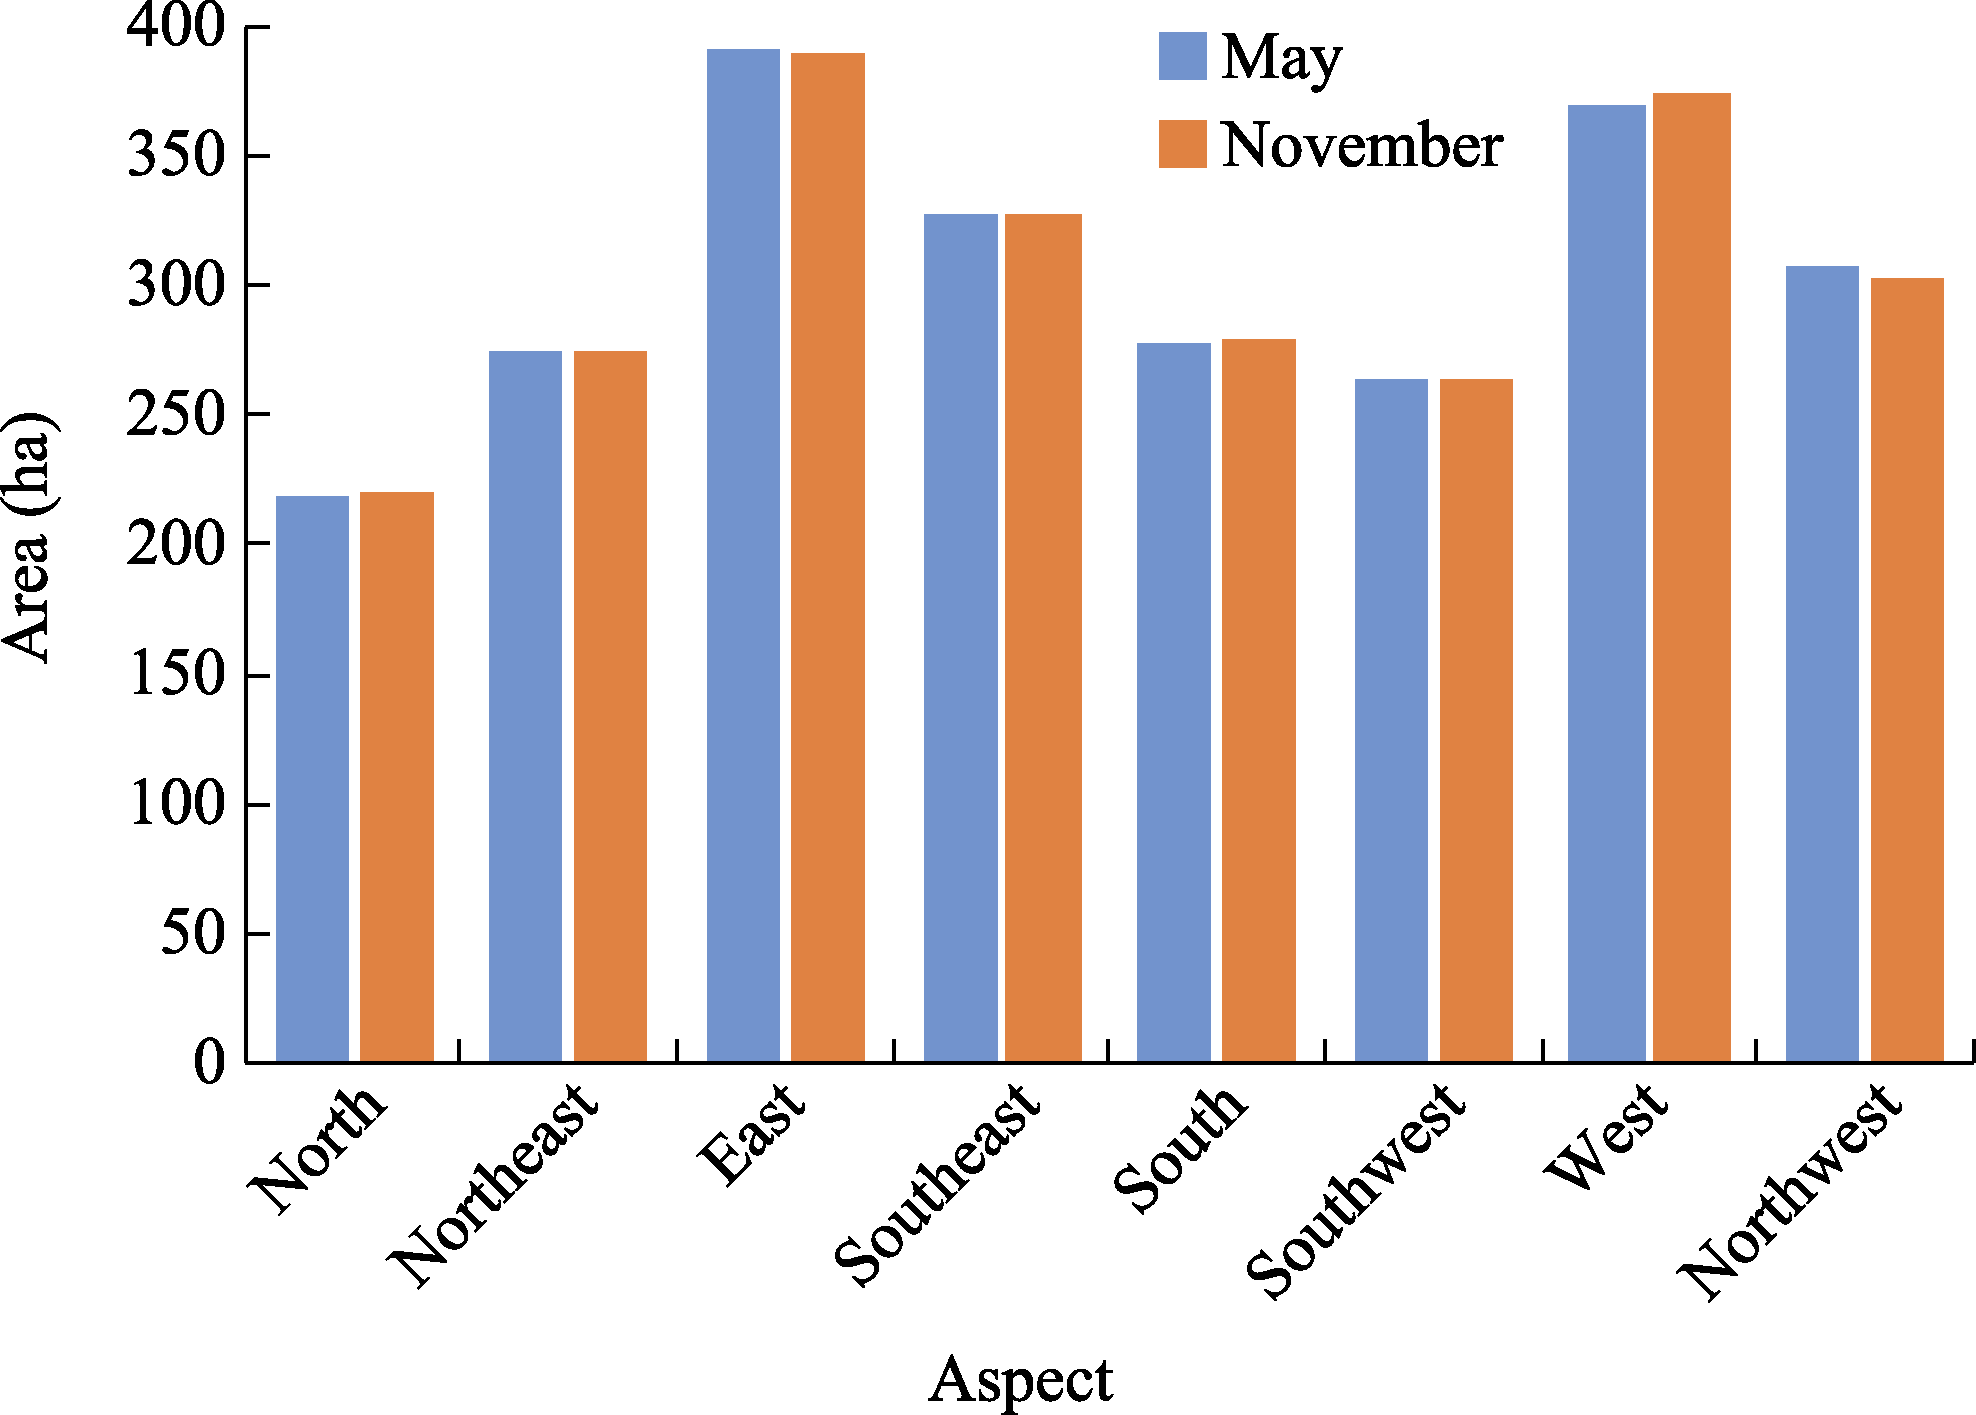
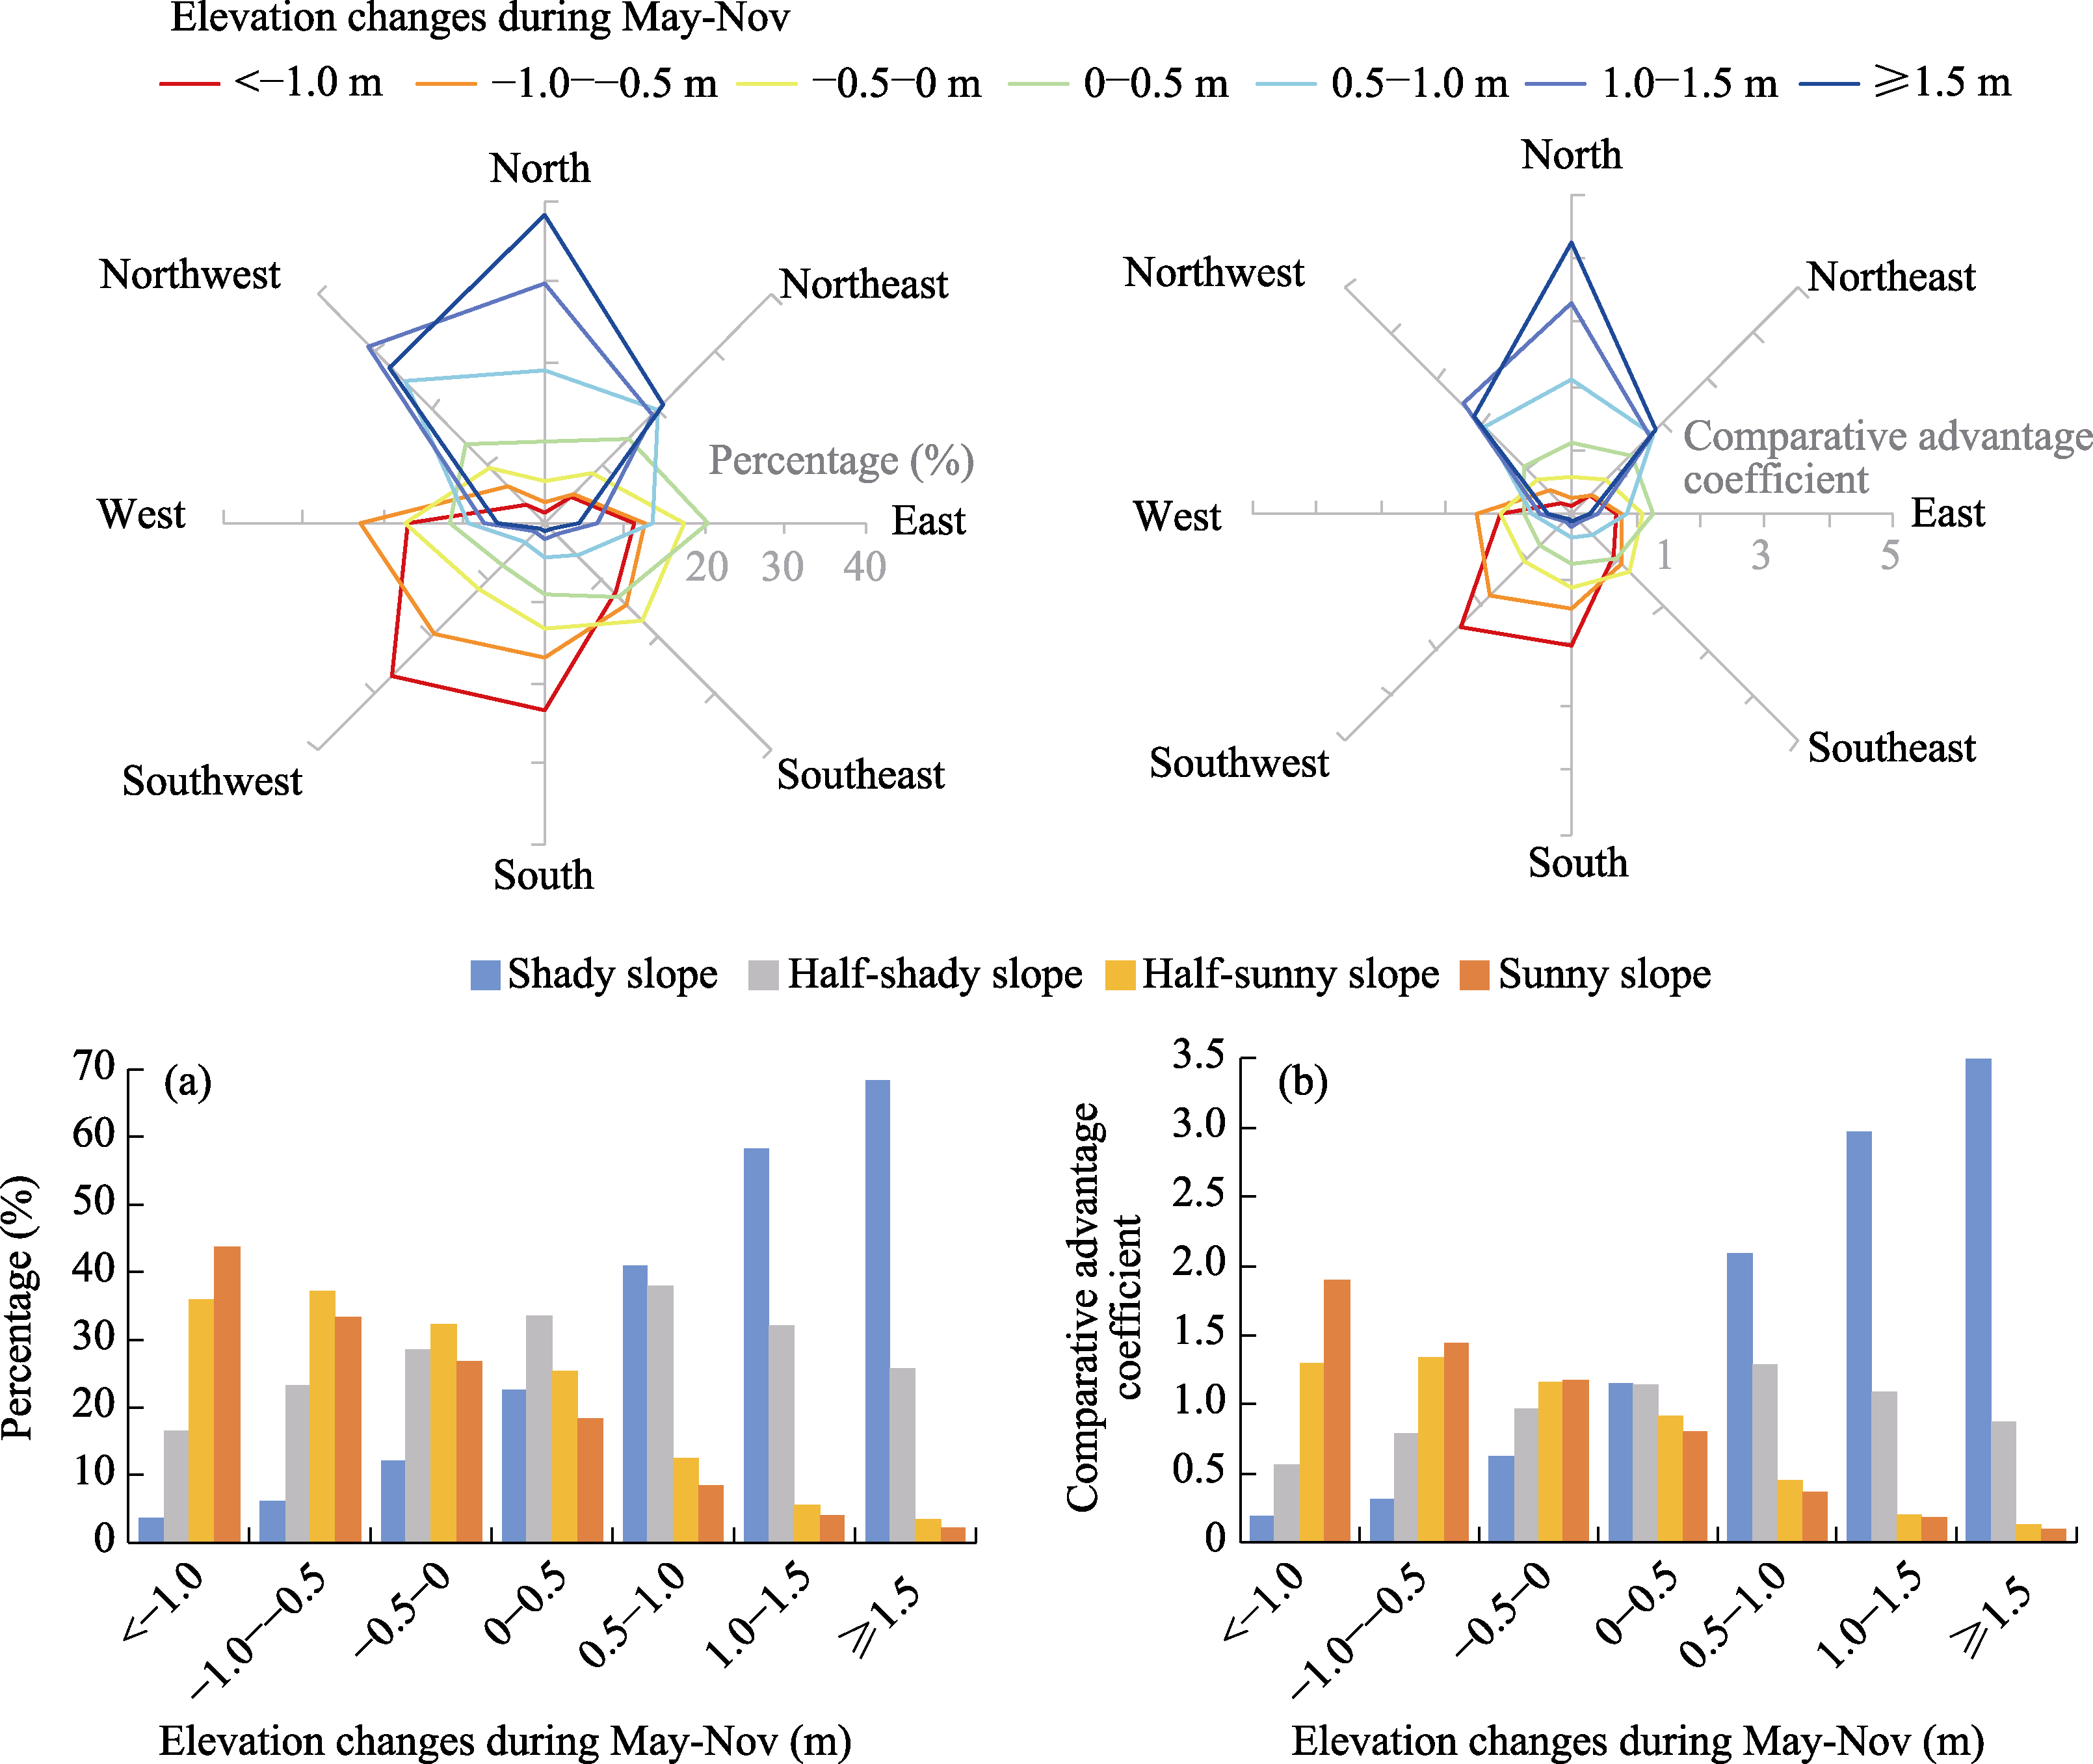
Figure 11
Histogram of the slope aspect of the Gutun catchment before and after the rainy season
Other figure/table from this article
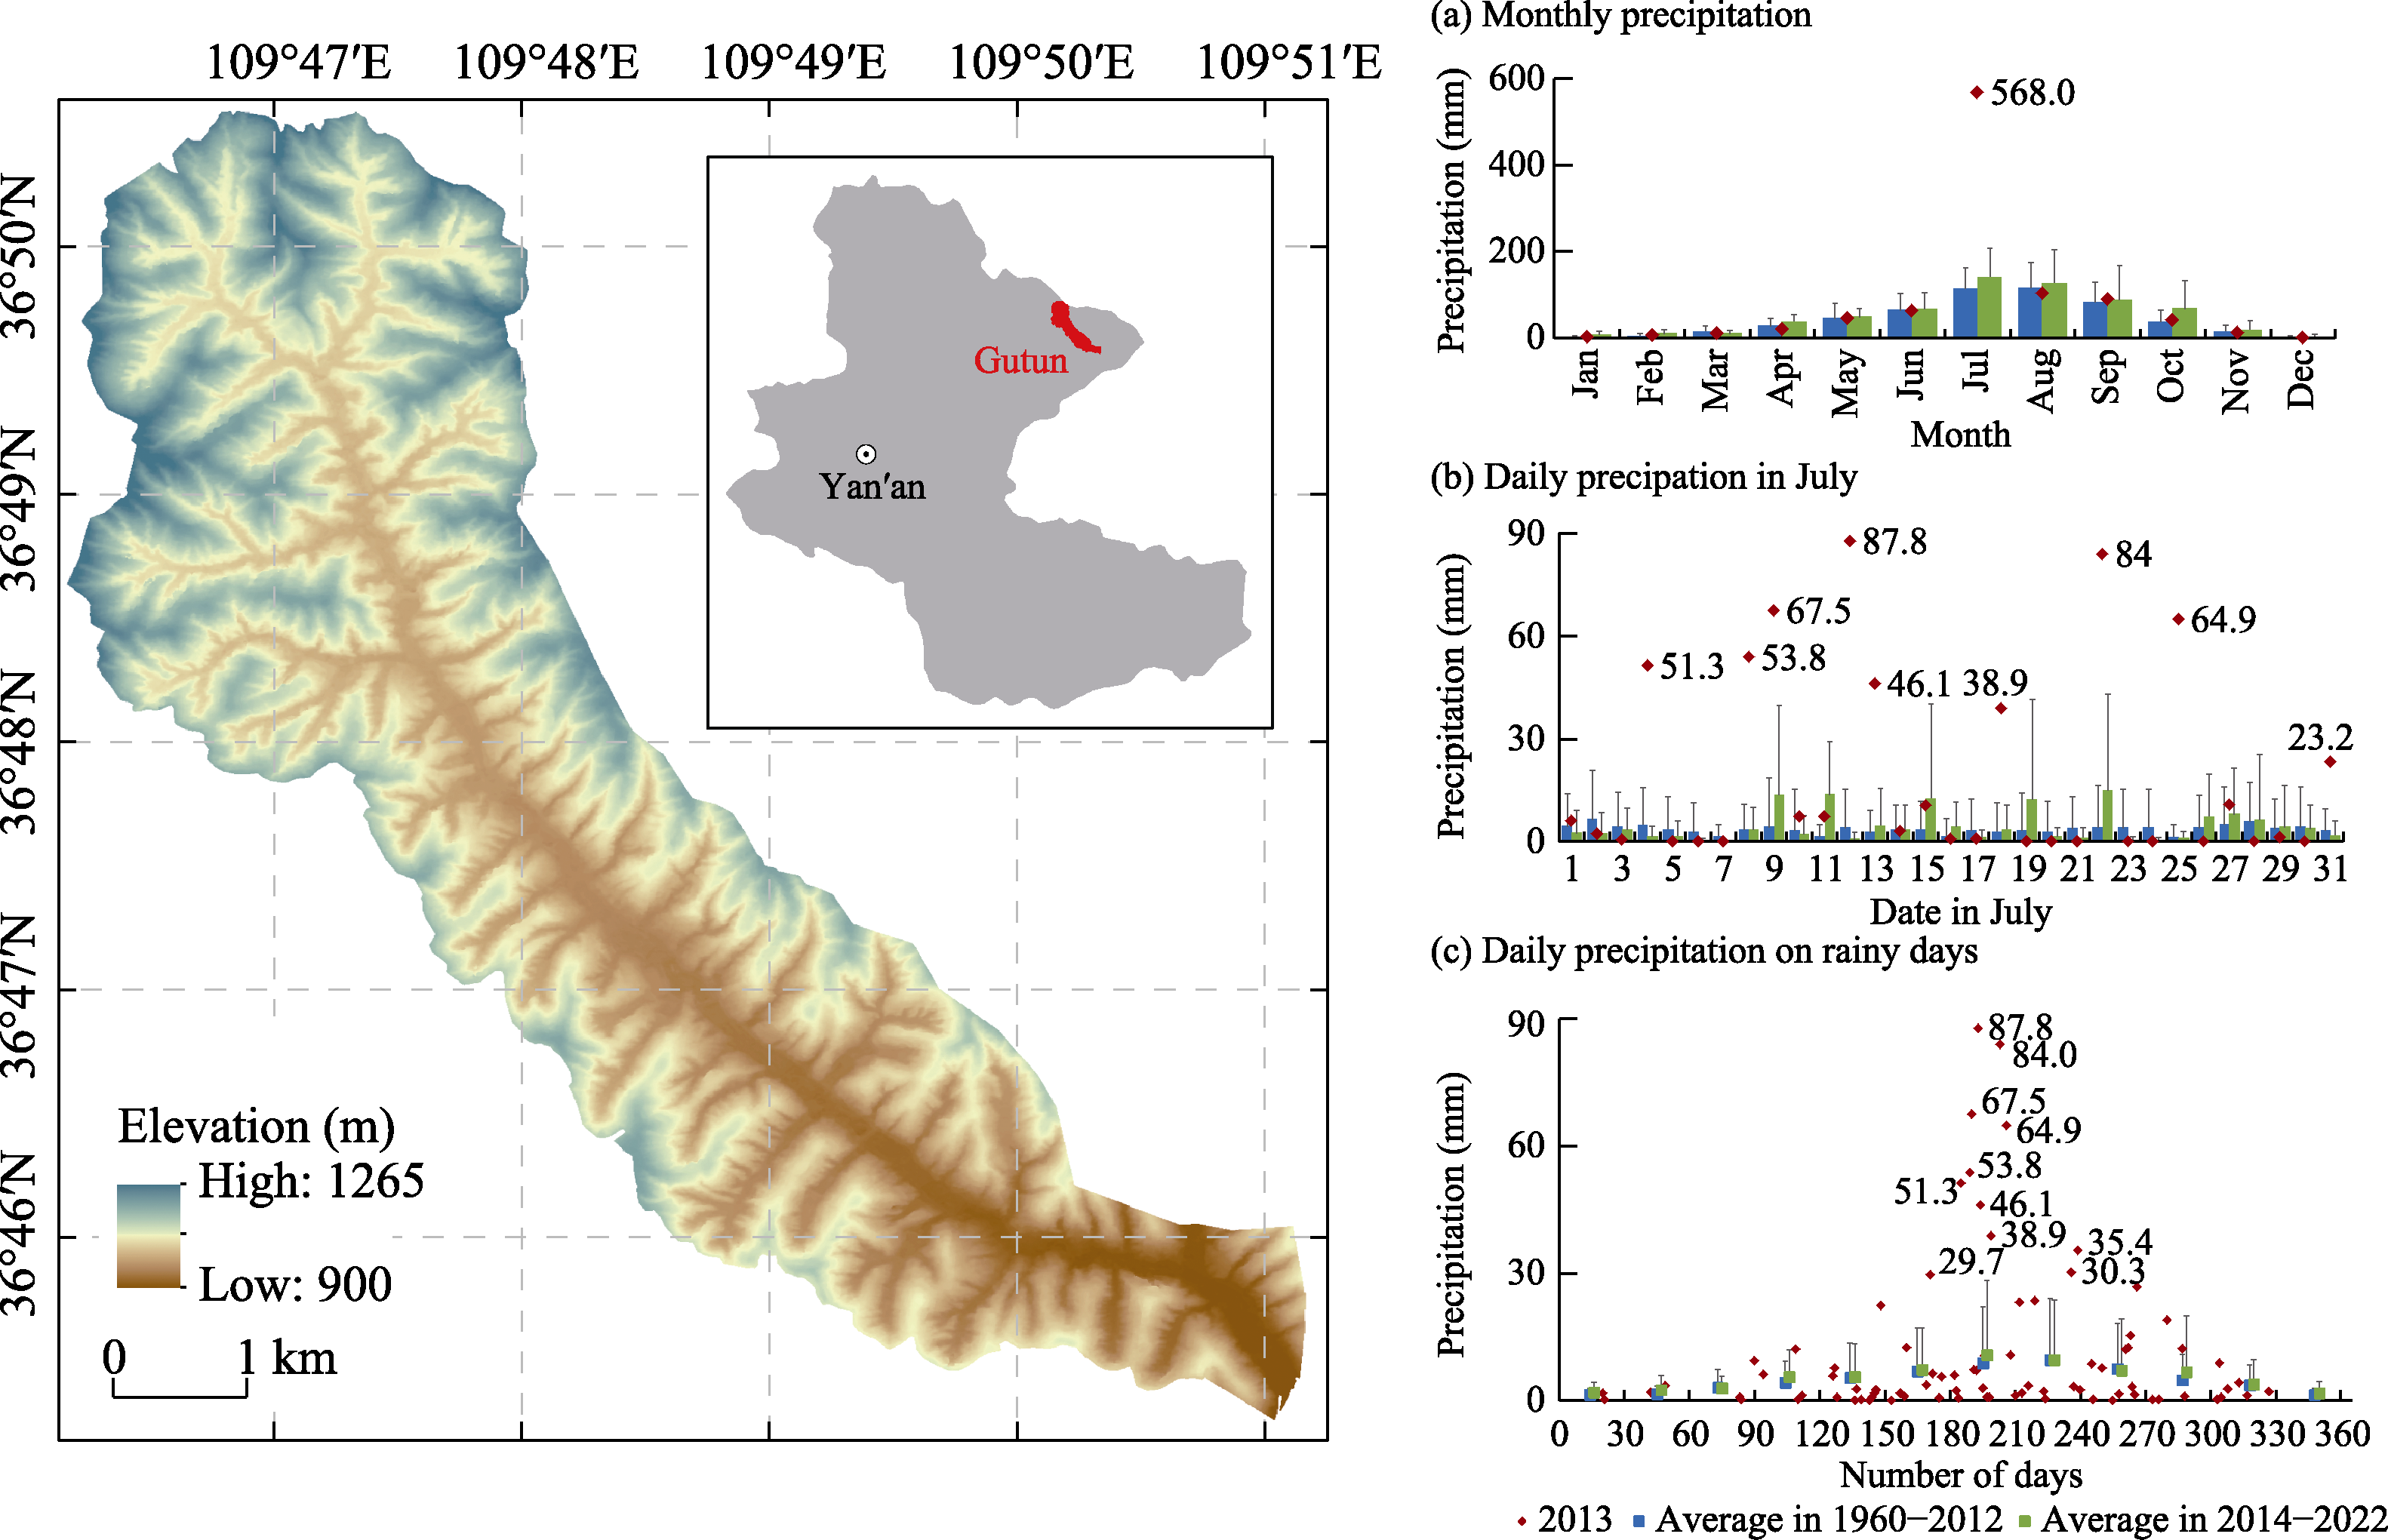
Figure 1
Location of the study area (Gutun catchment in Yan'an) and the precipitation in it
Note: The monthly and daily precipitation values in 2013, 1960-2012, and 2014-2022 are shown on the right. The red dots in (a), (b), and (c) refer to the monthly and daily precipitation values in 2013. The blue bars in (a) and (b), and the blue dots in (c) refer to the average monthly and daily precipitation values in 1960-2012. The green bars in (a) and (b), and the green dots in (c) refer to the average monthly and daily precipitation values in 2014-2022. Data on meteorological observations at the Yan'an station were obtained from the China Meteorological Data Service Center (CMDSC) (
http://data.cma.cn/
).
Table 1
Number of rainy days and the grades of precipitation in 2013
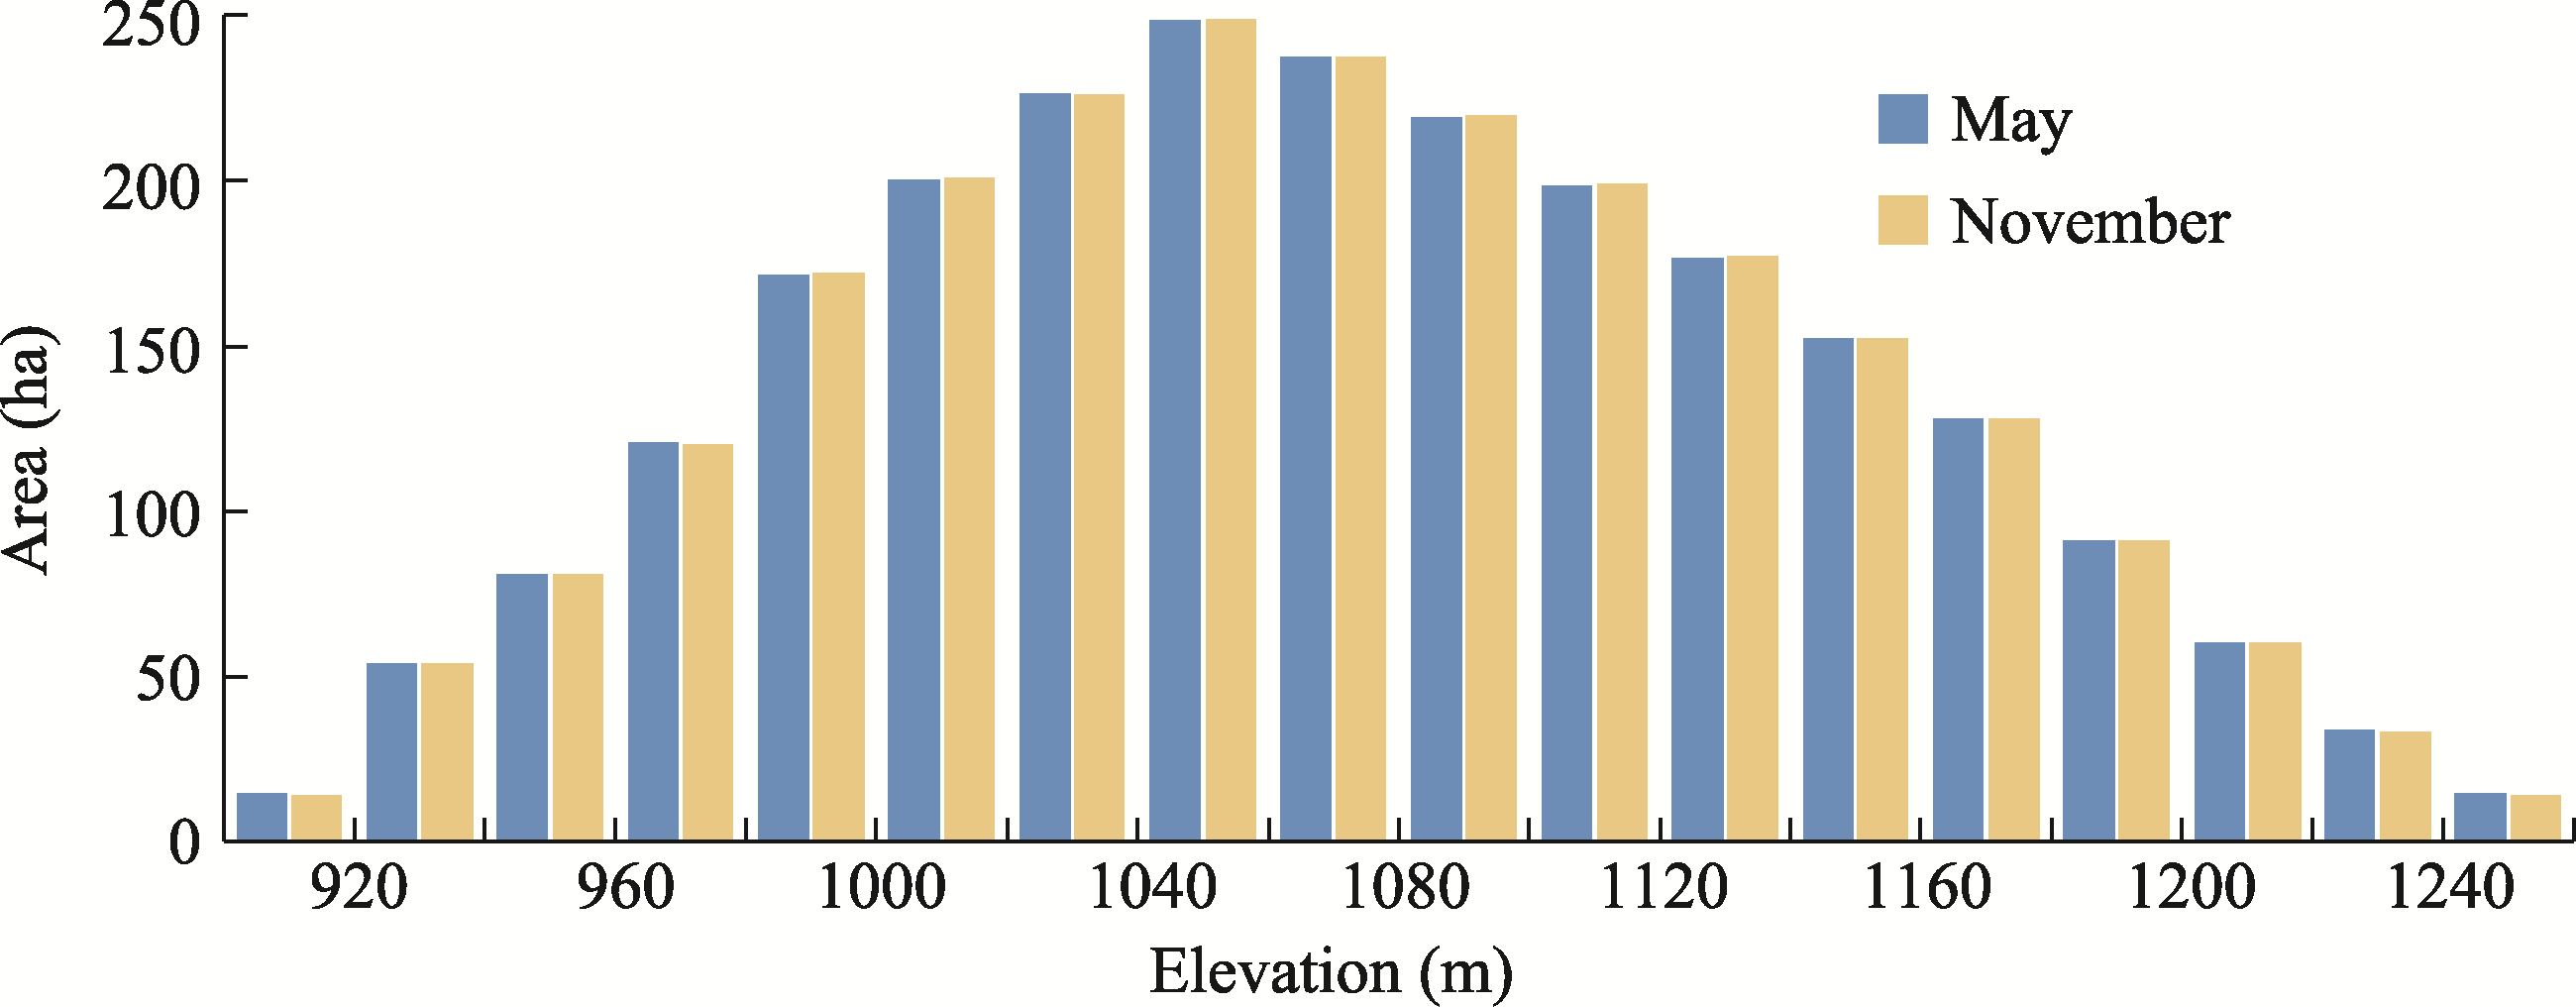
Figure 2
Histogram of elevations of the Gutun catchment before and after the rainy season
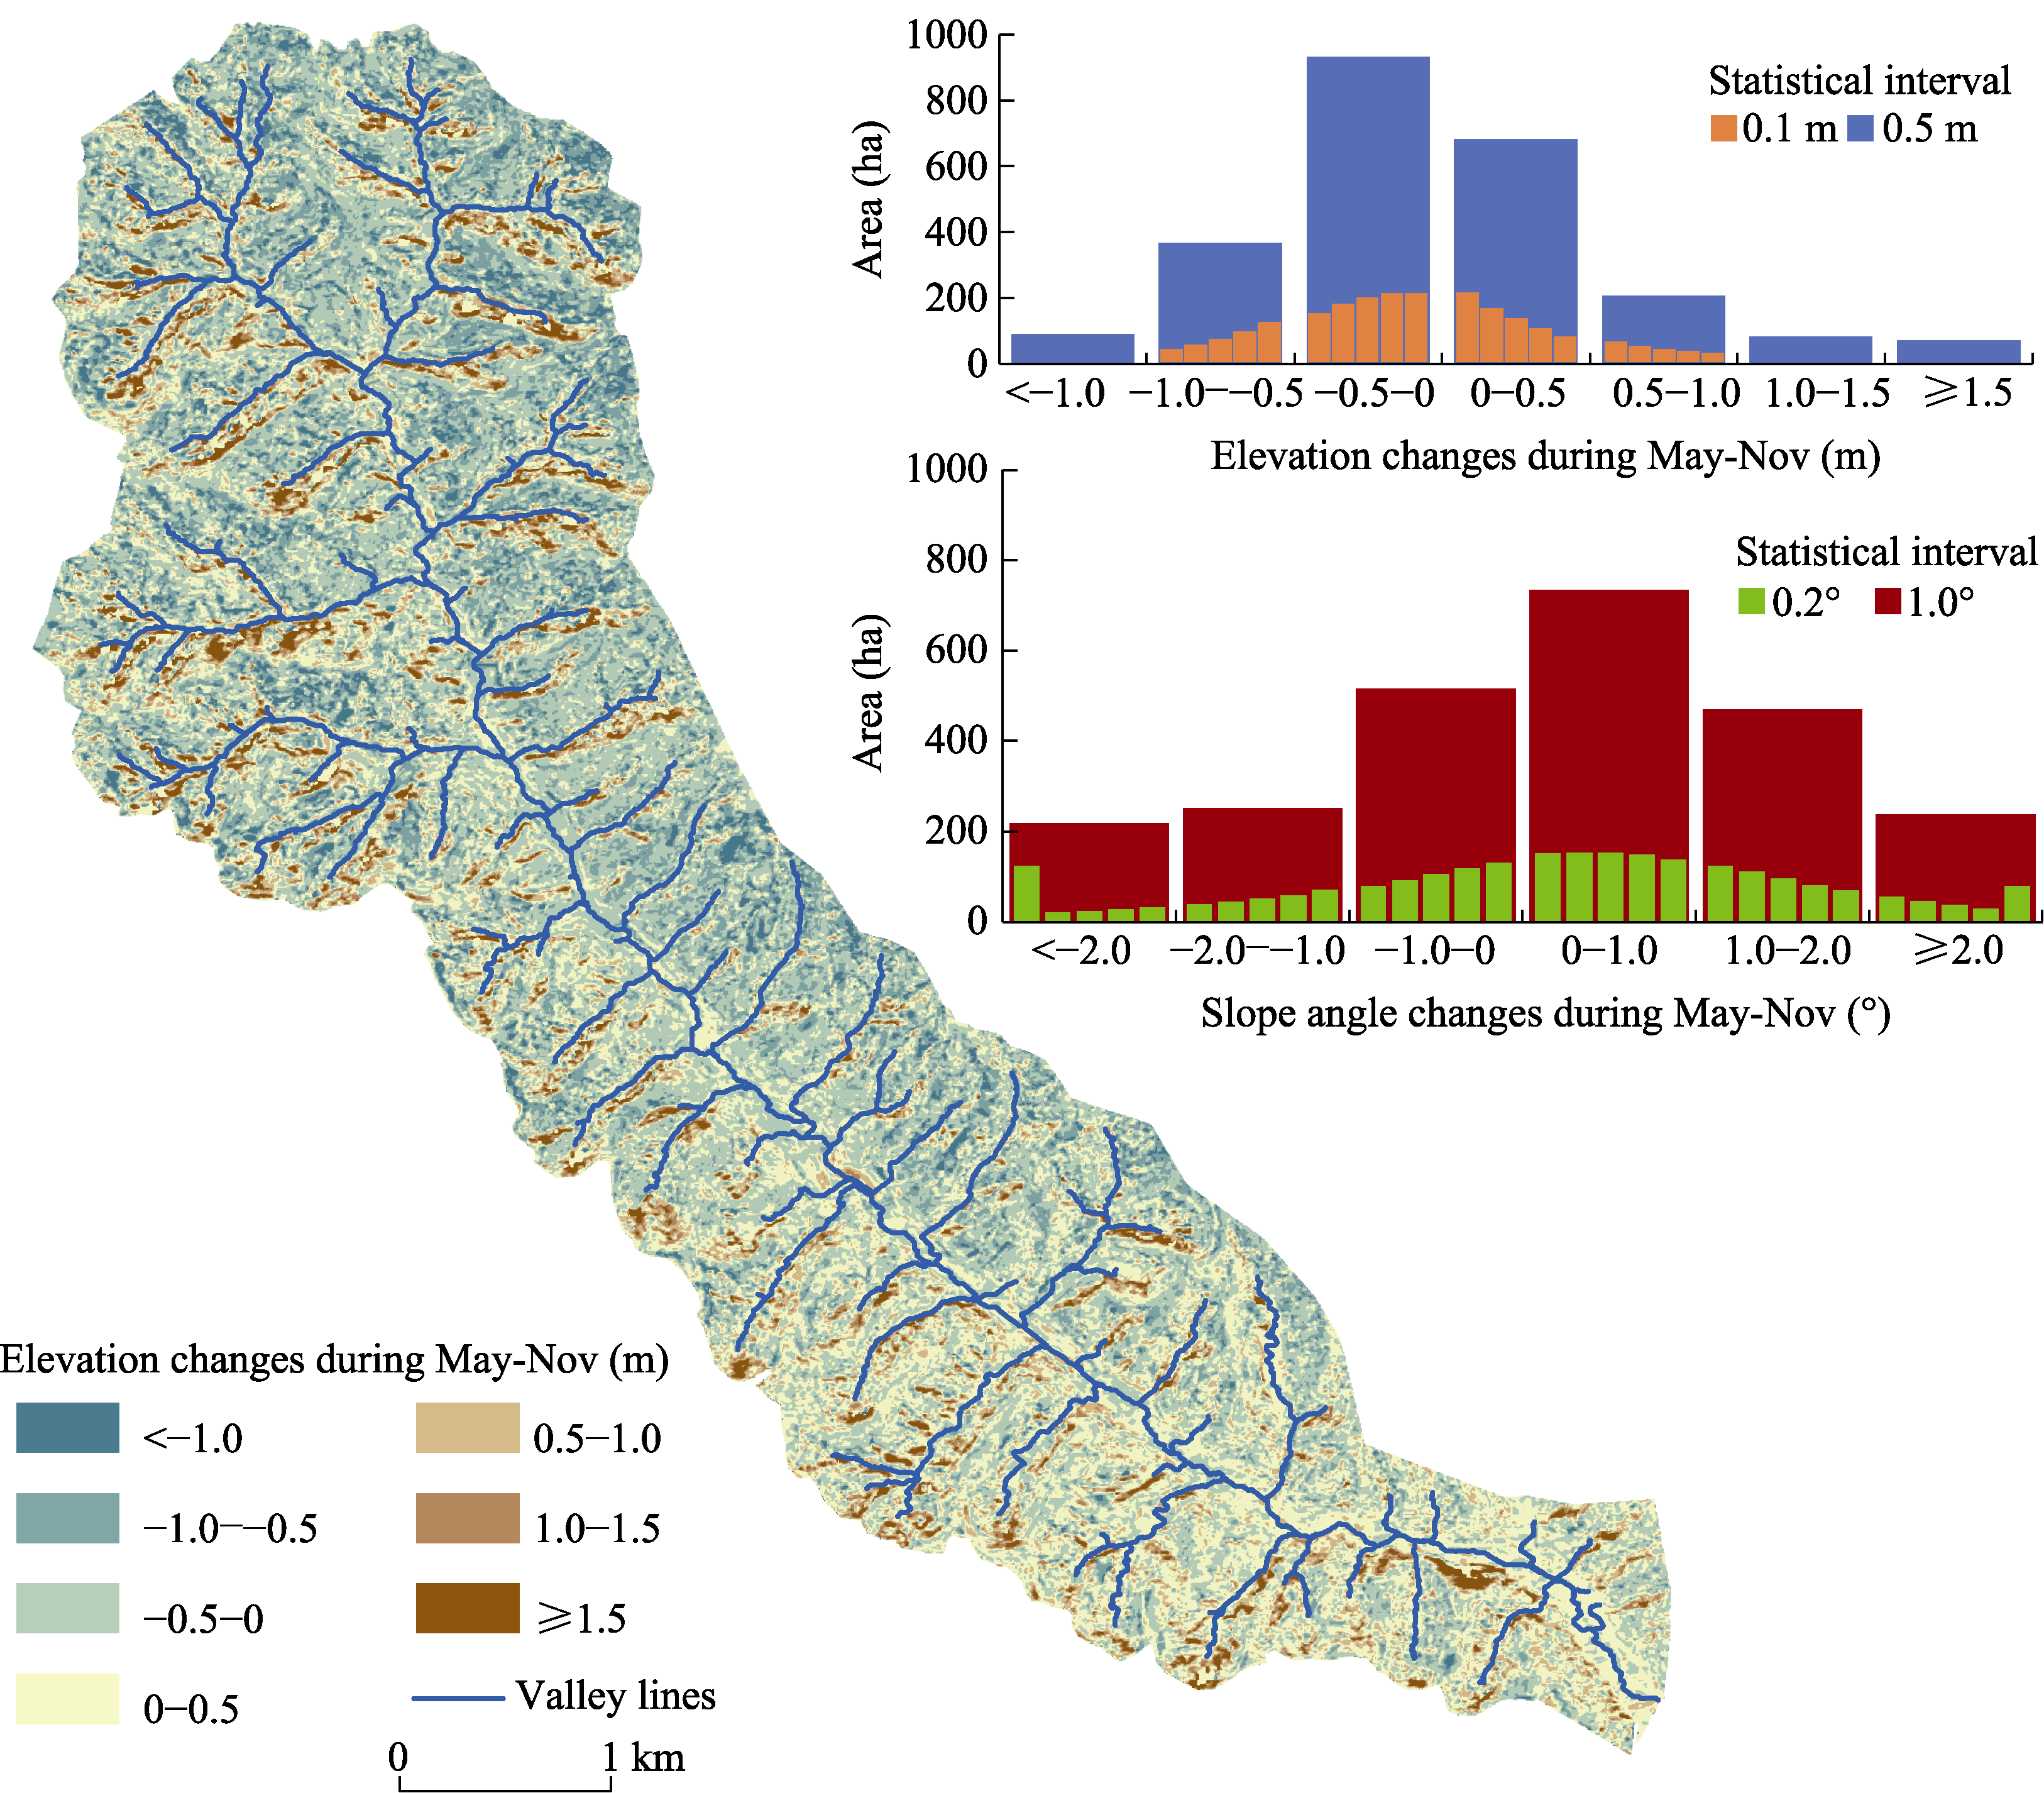
Figure 3
Patterns of changes in elevation of the Gutun catchment before and after the rainy season
Note: The histograms represent the areas of changes in the elevation and slope under different statistical intervals.
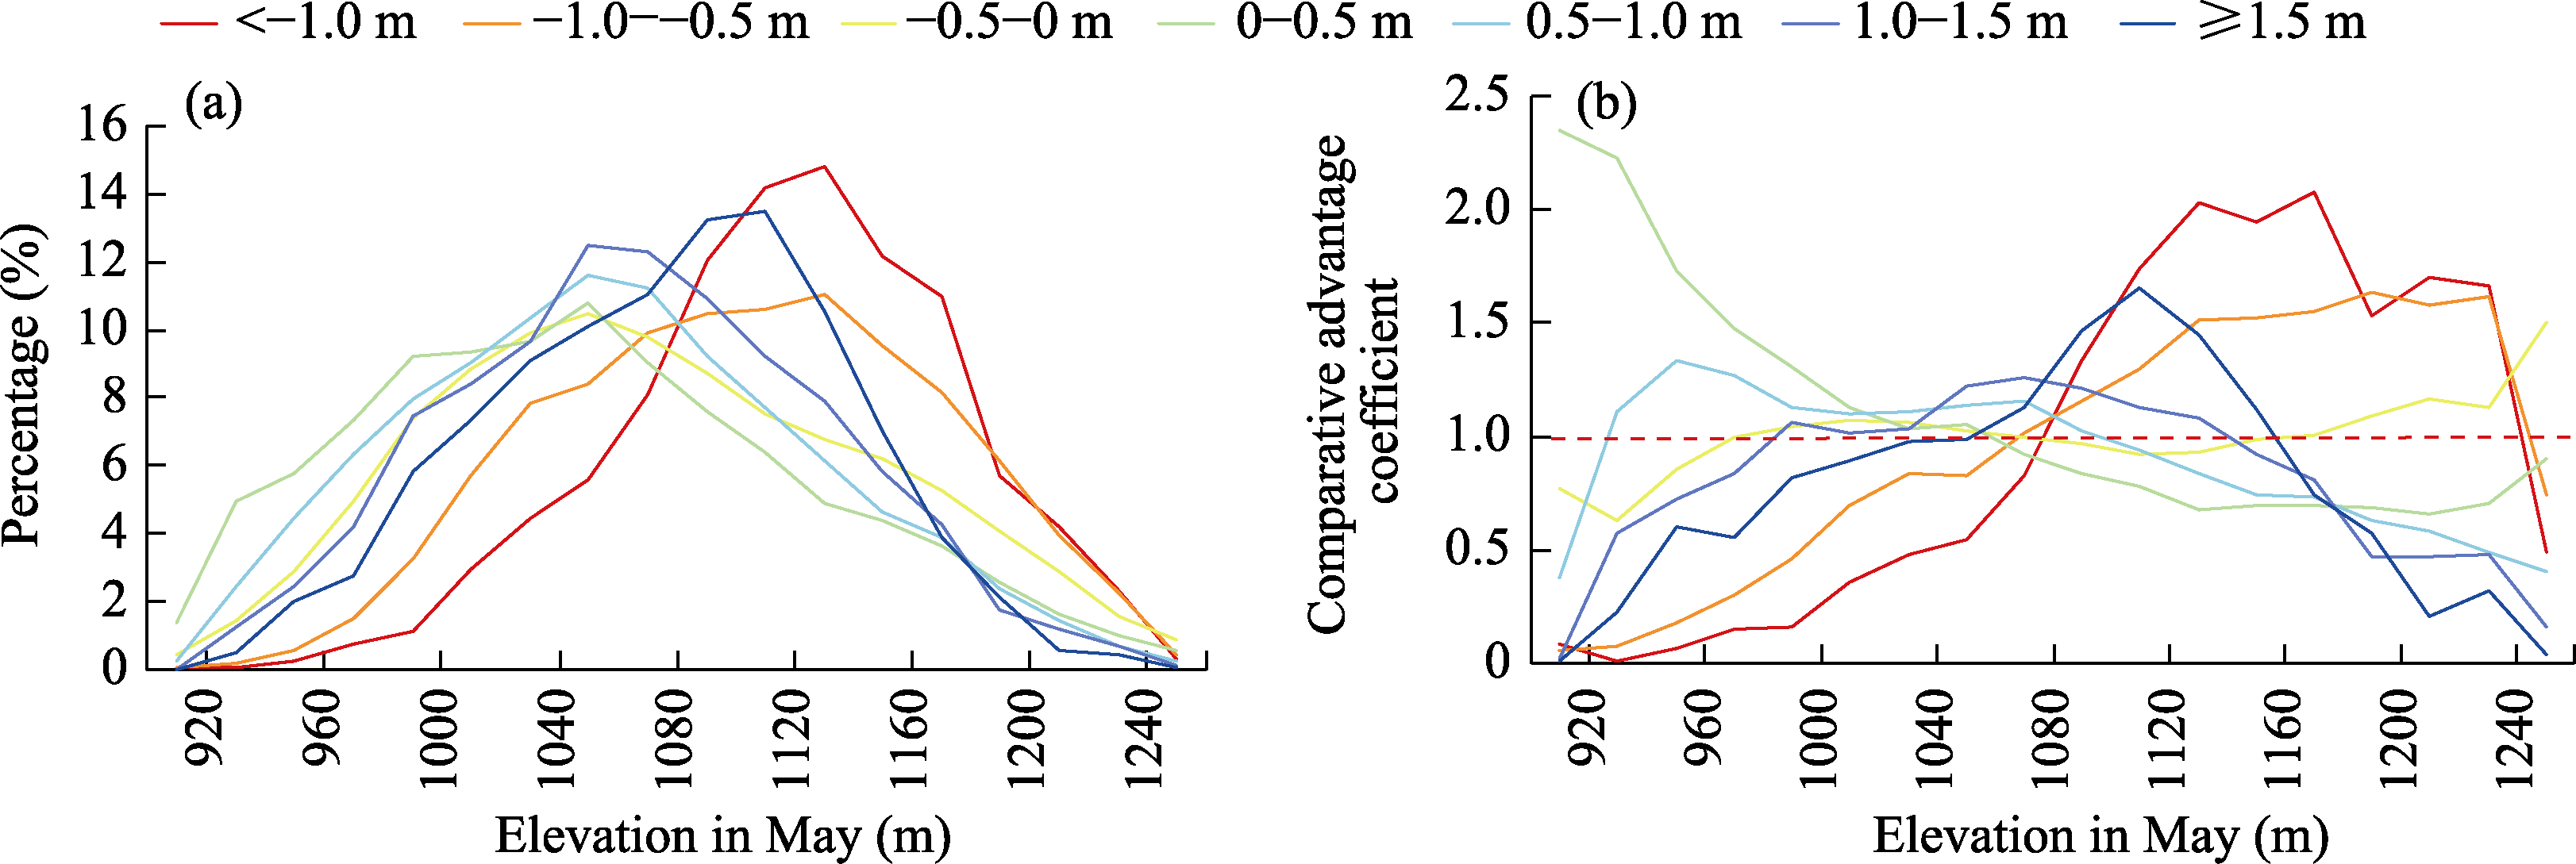
Figure 4
Coupling between the changes in elevation and the elevation before the rainy season
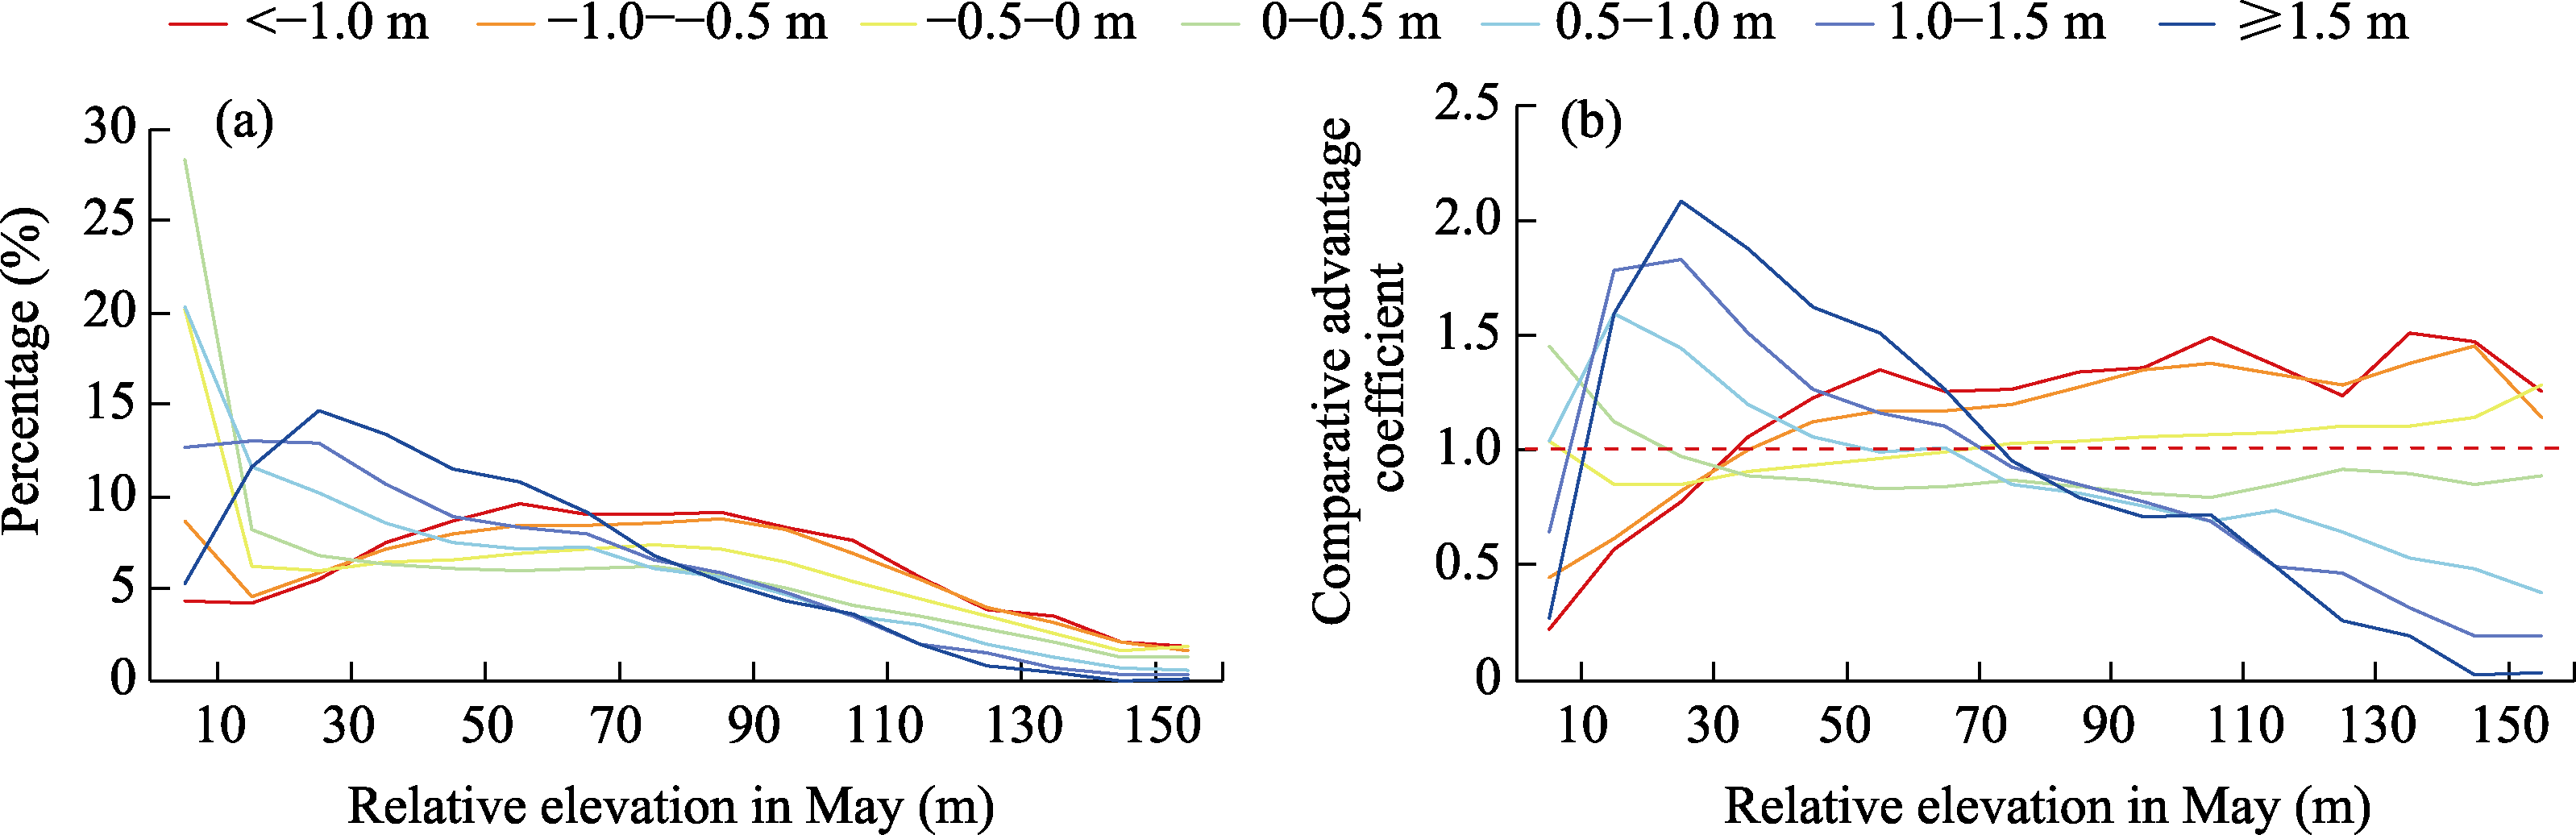
Figure 5
Coupling between the changes in elevation and the relative elevation before the rainy season
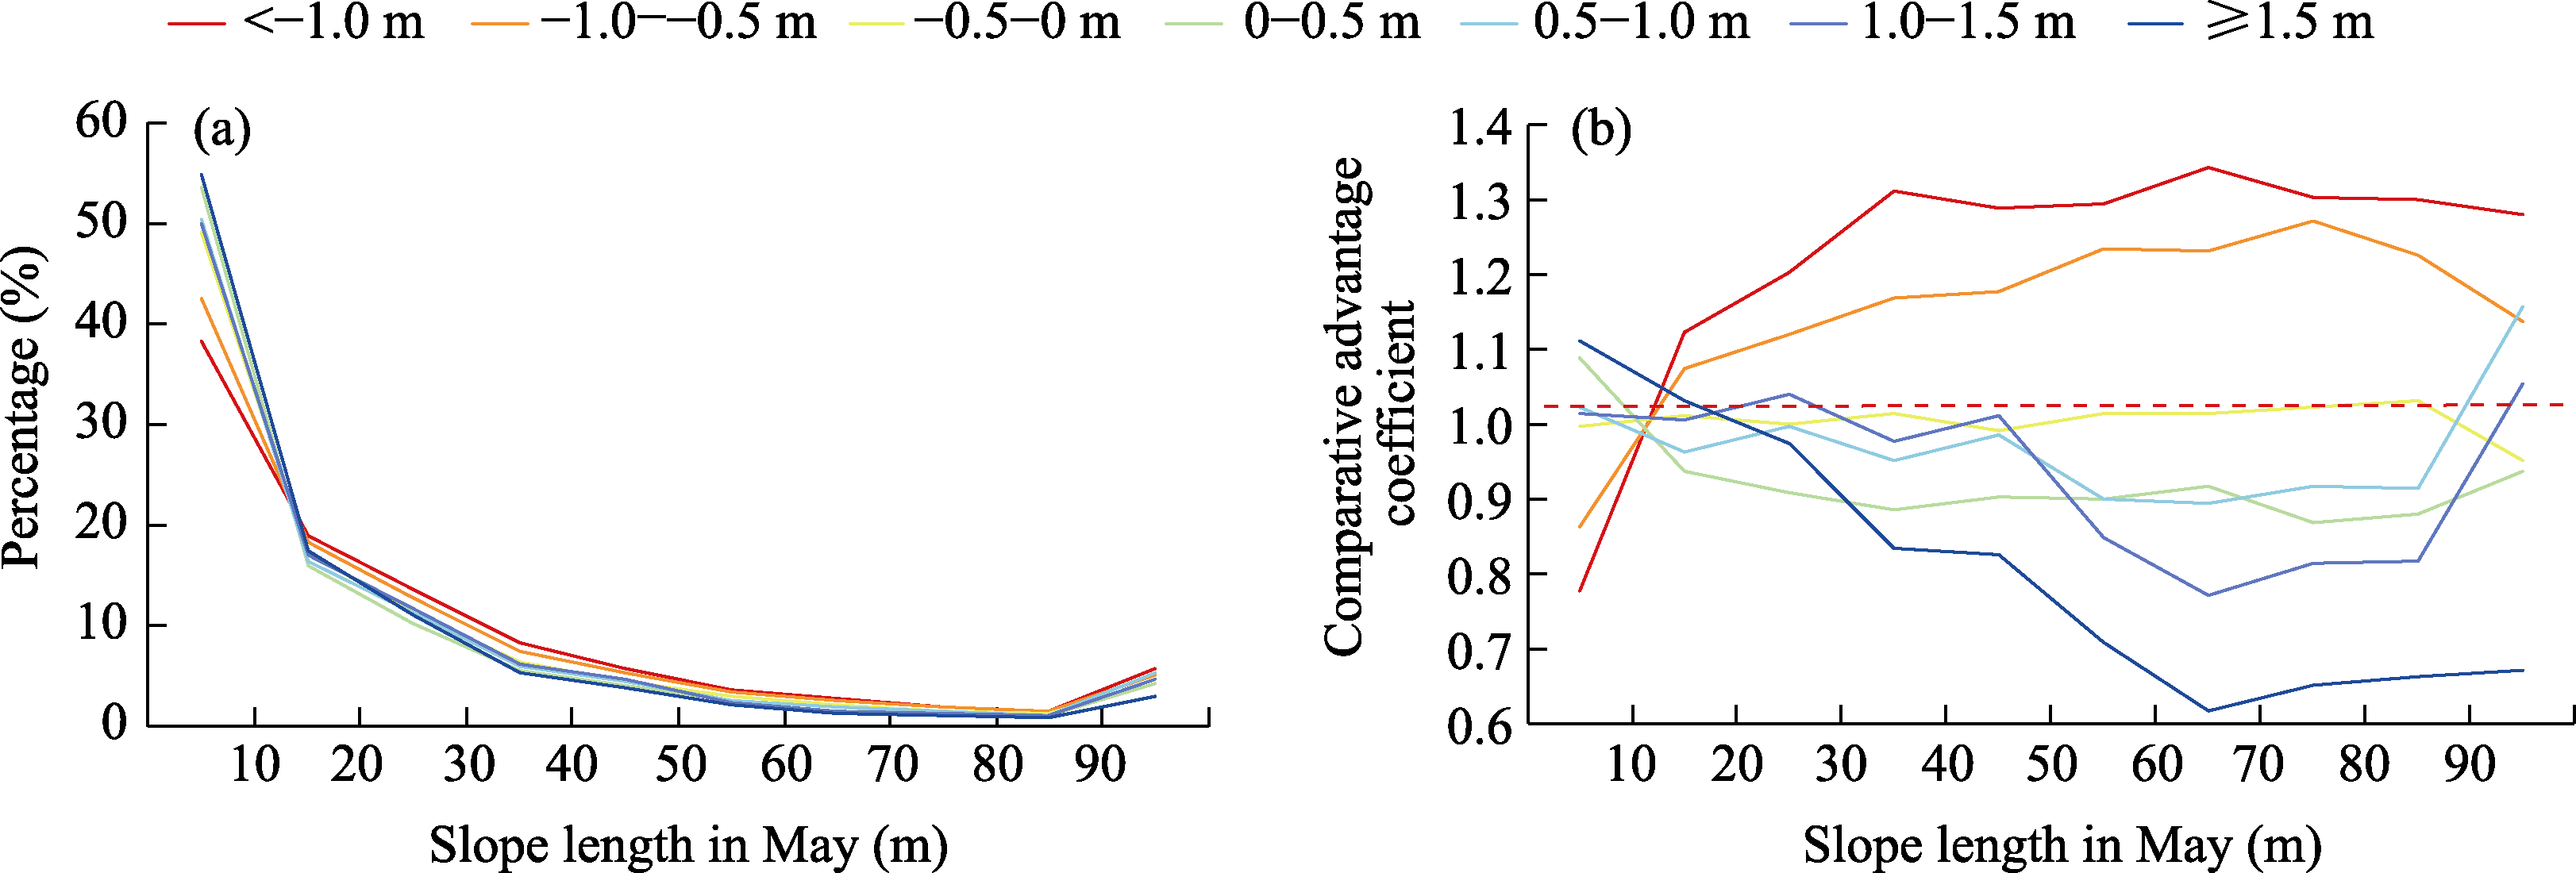
Figure 6
Coupling between the changes in elevation and the slope length before the rainy season
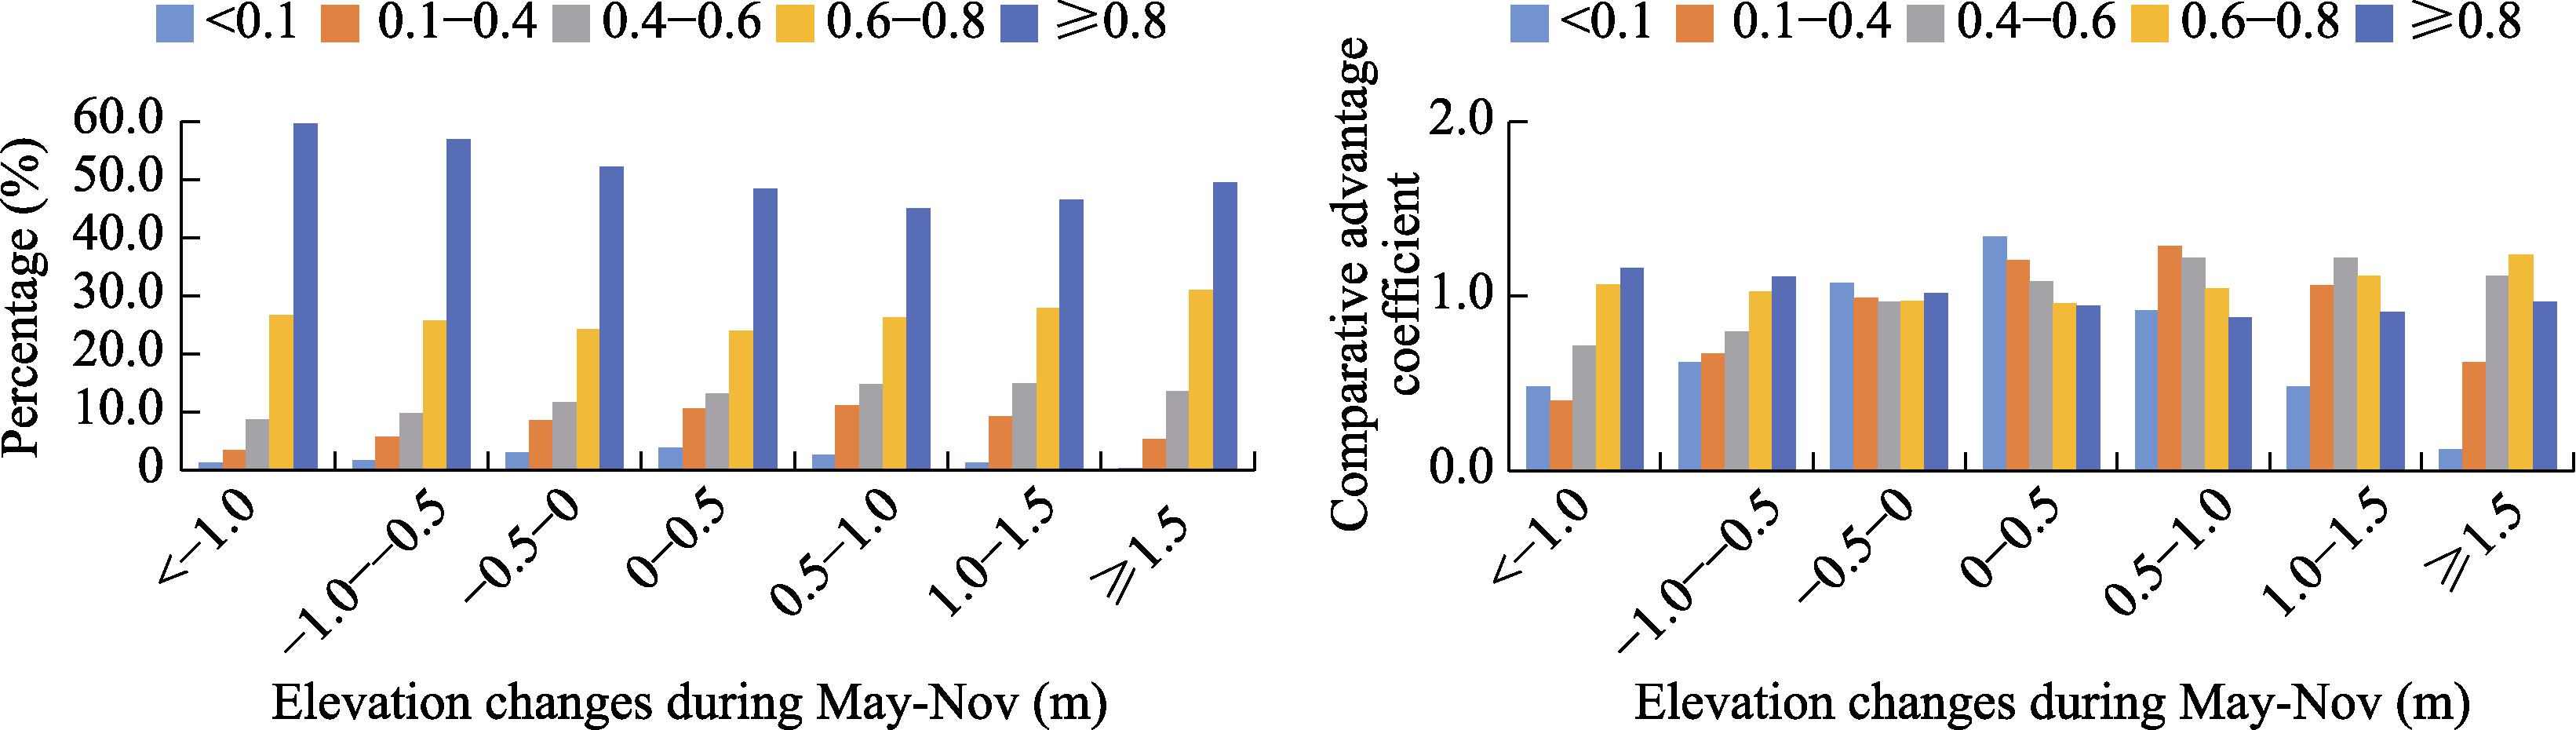
Figure 7
Coupling between the changes in elevation and the RPI before the rainy season
Figure 8
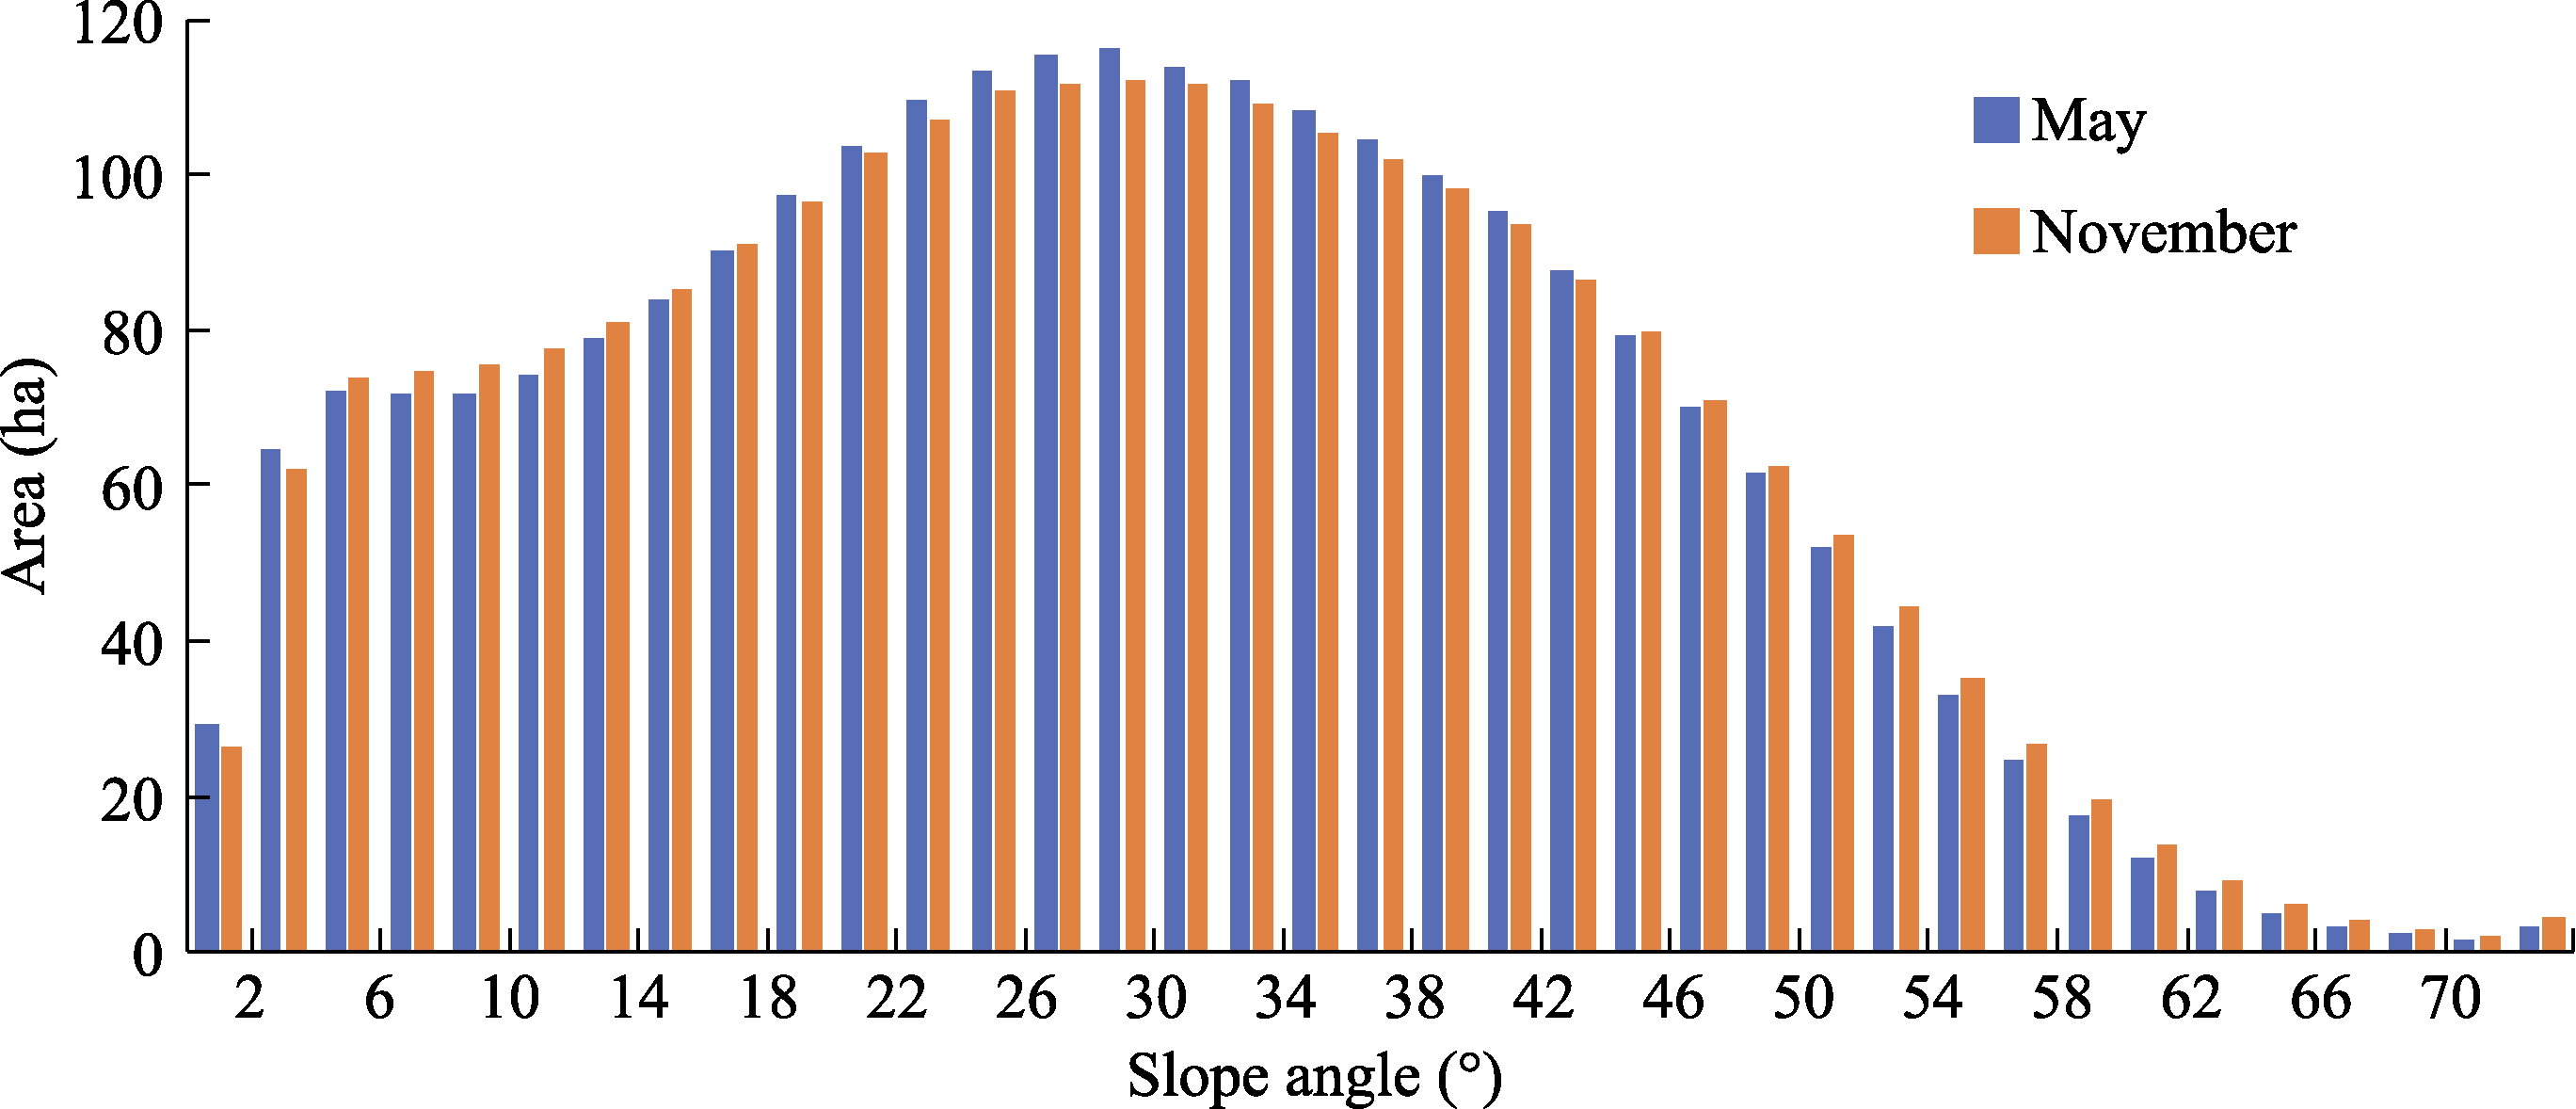
Histogram of slope inclinations of the Gutun catchment before and after the rainy season
Figure 9
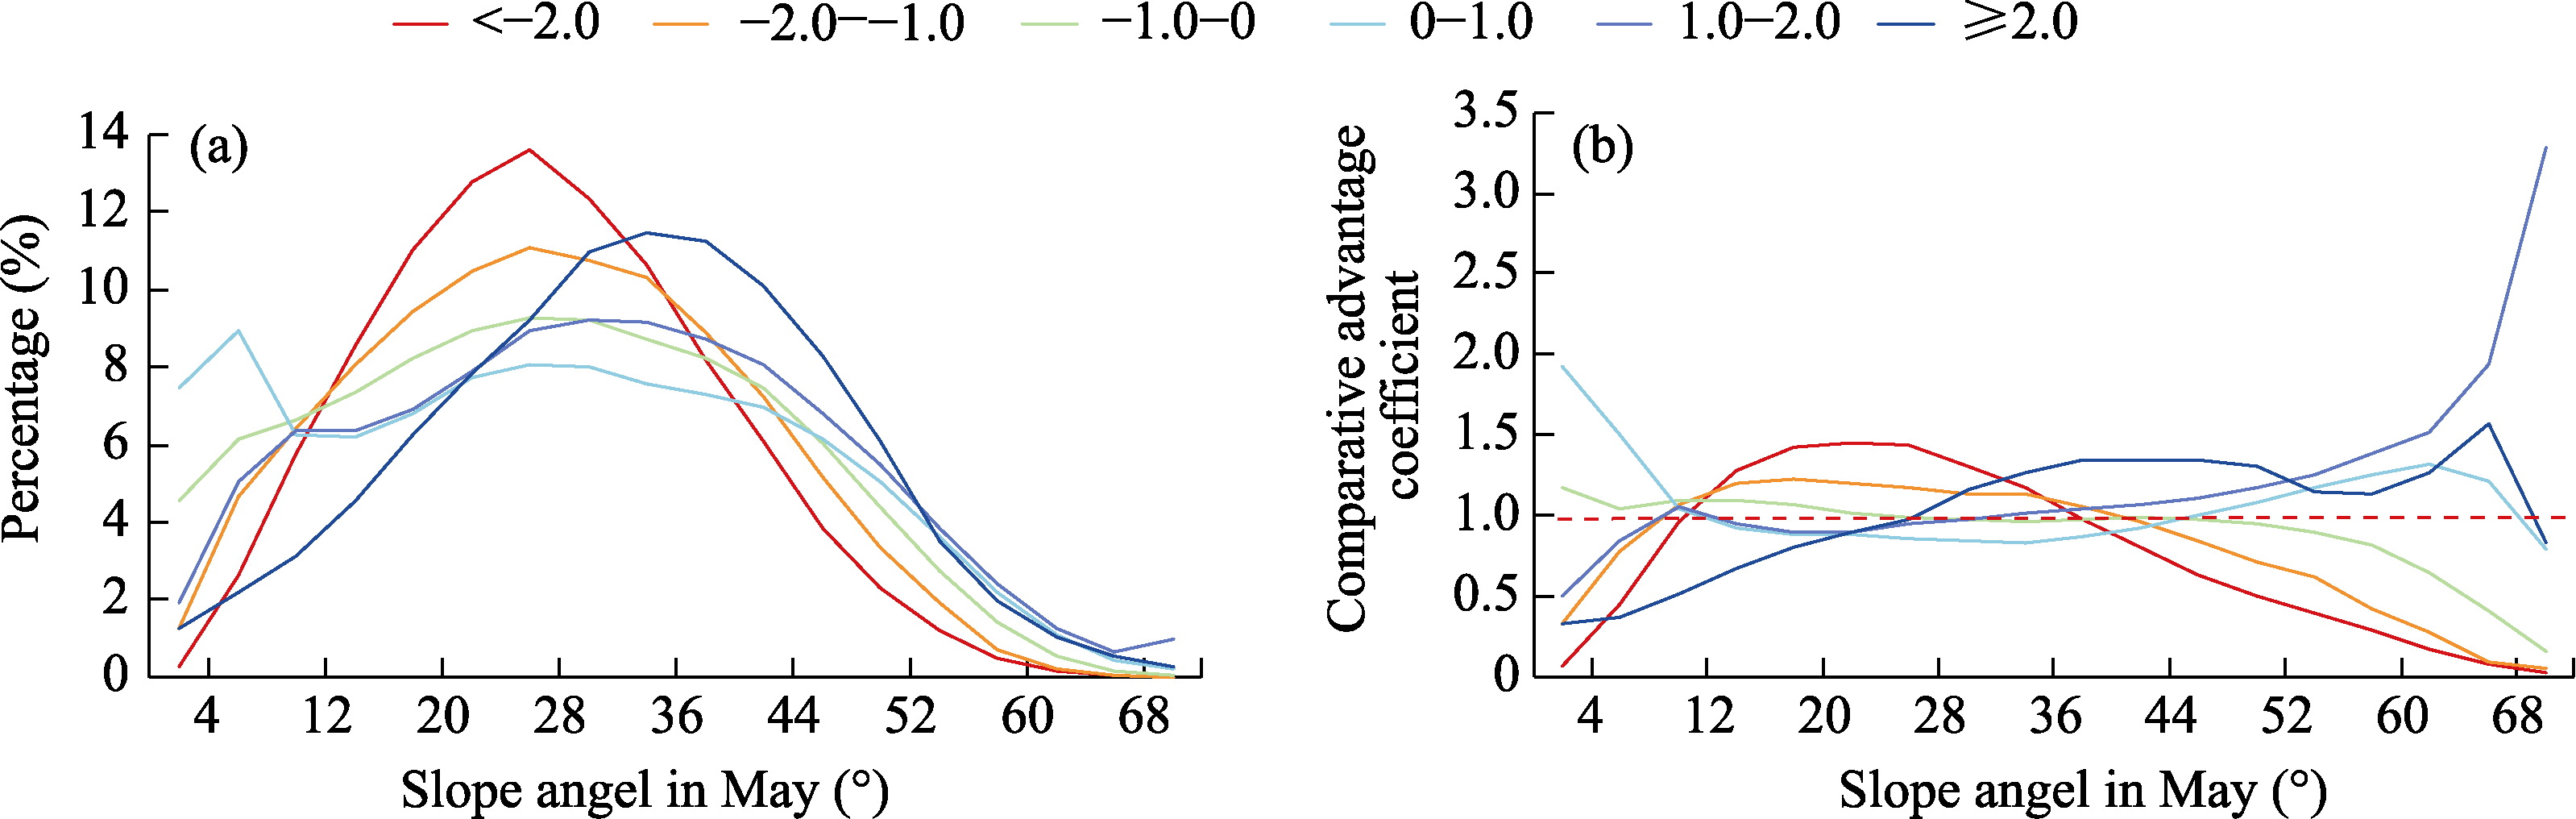
Coupling between the changes in slope inclination and the slope inclination before the rainy season
Figure 10
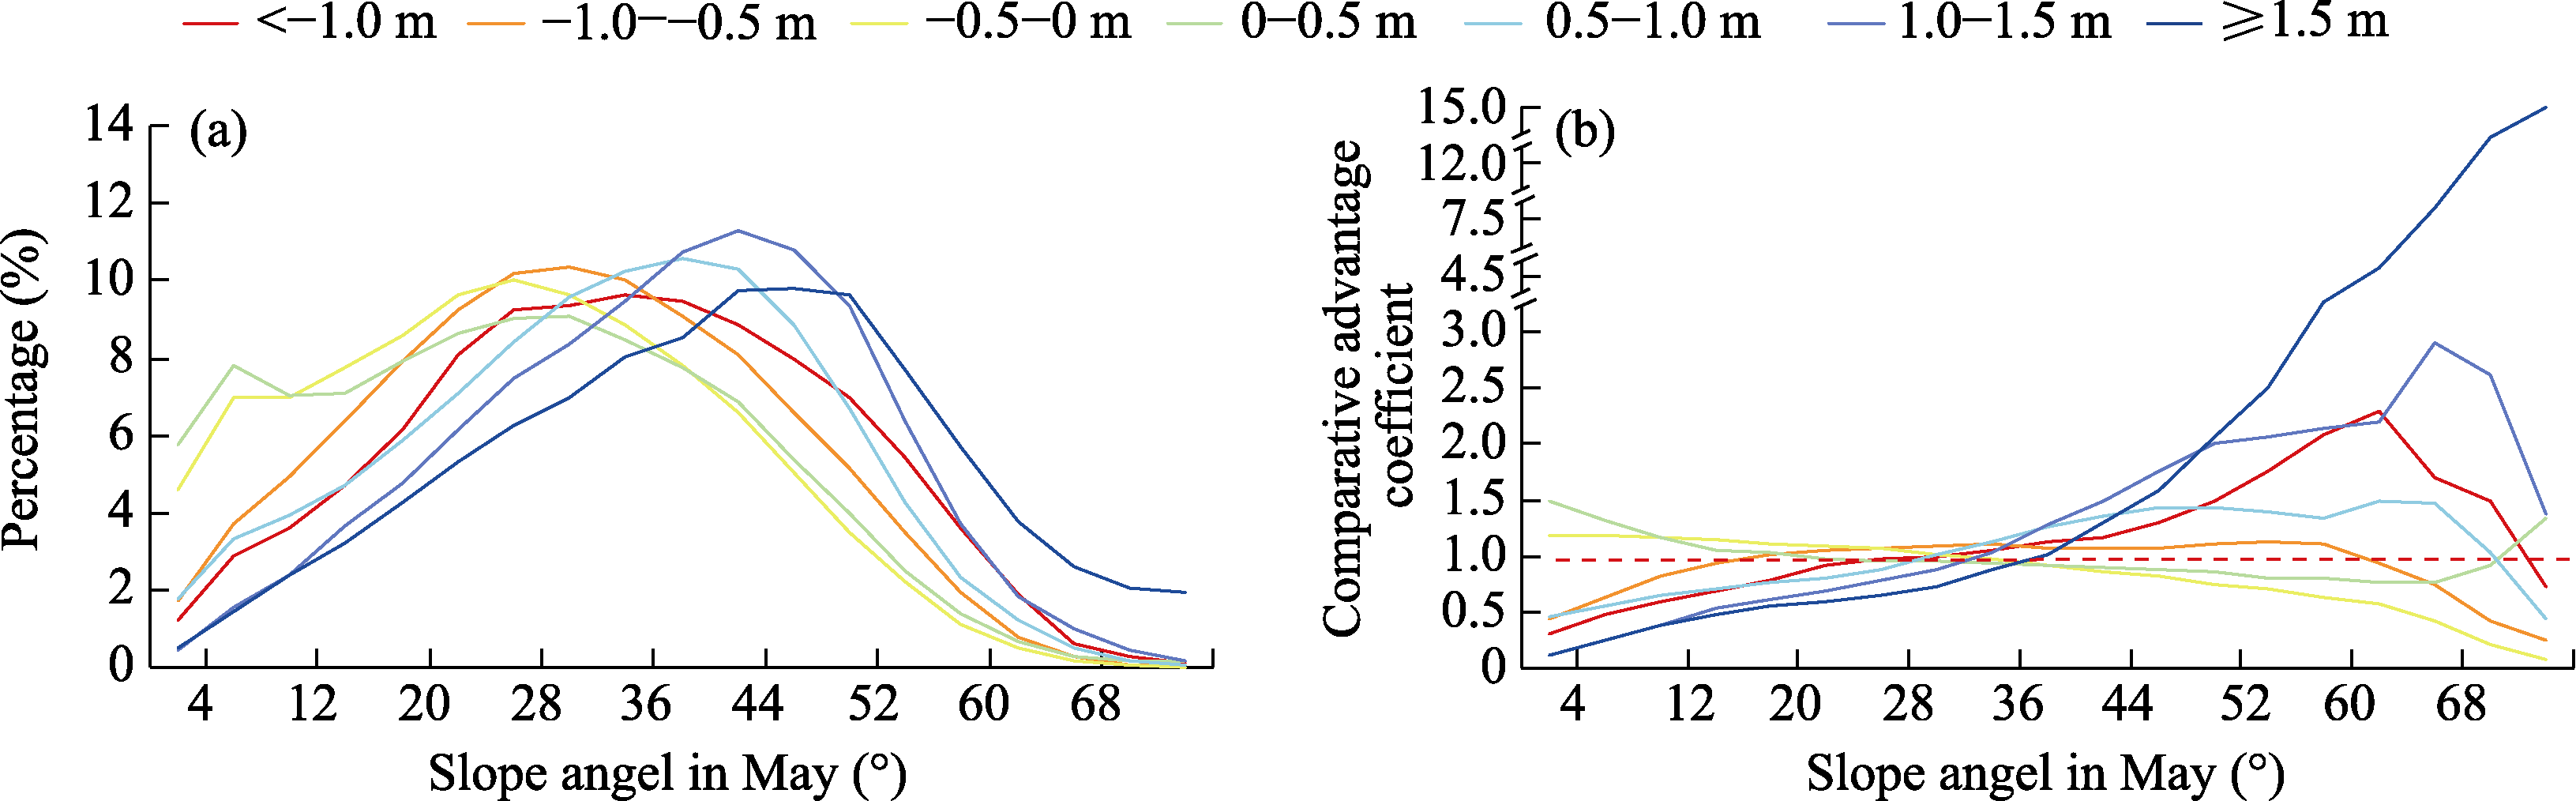
Coupling between the changes in elevation and the slope inclination before the rainy season
Figure 12
Coupling between the changes in elevation and the slope aspect before the rainy season
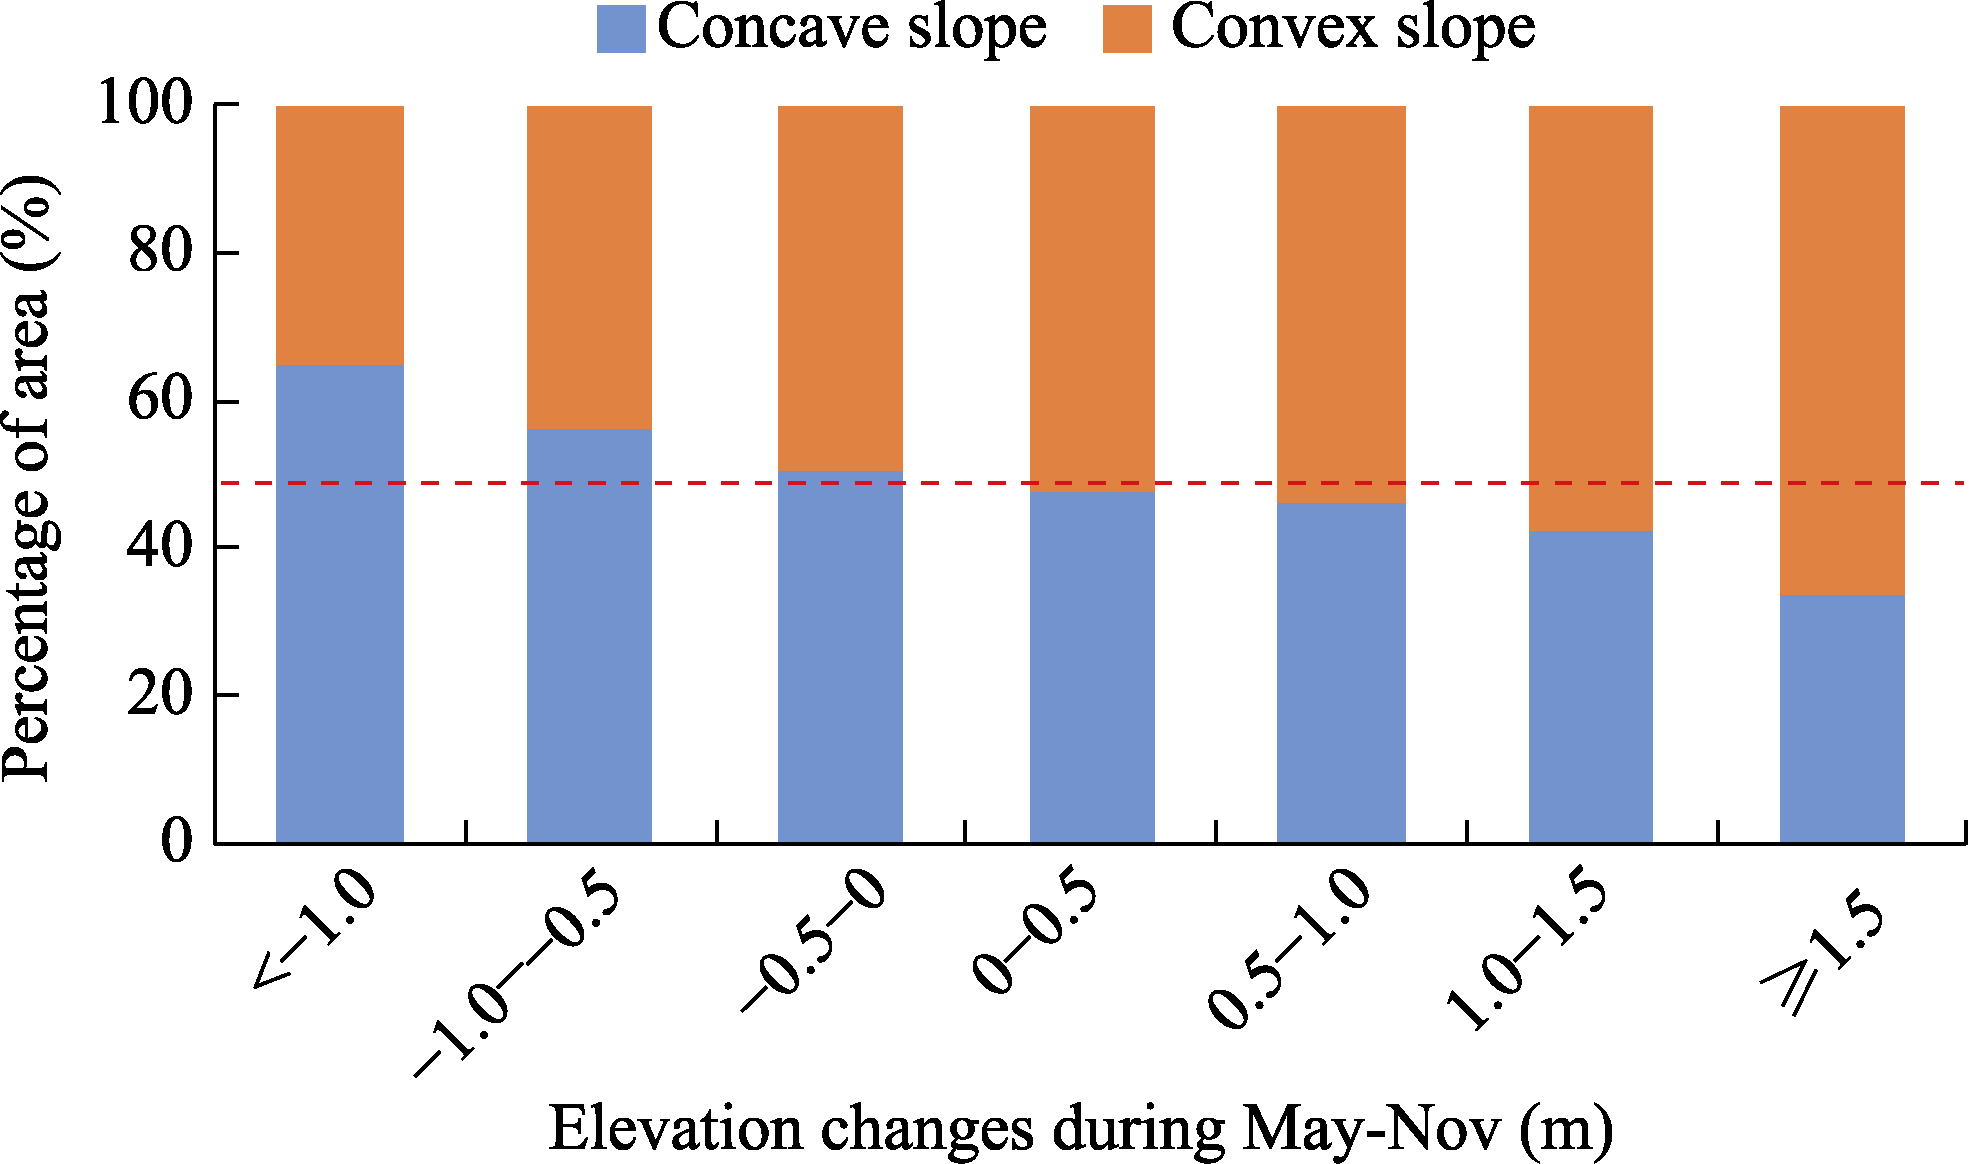
Figure 13
Ratios of convex and concave slopes in the Gutun catchment before and after the rainy season
Table 2
Correlation between the changes in elevation and topographical factors
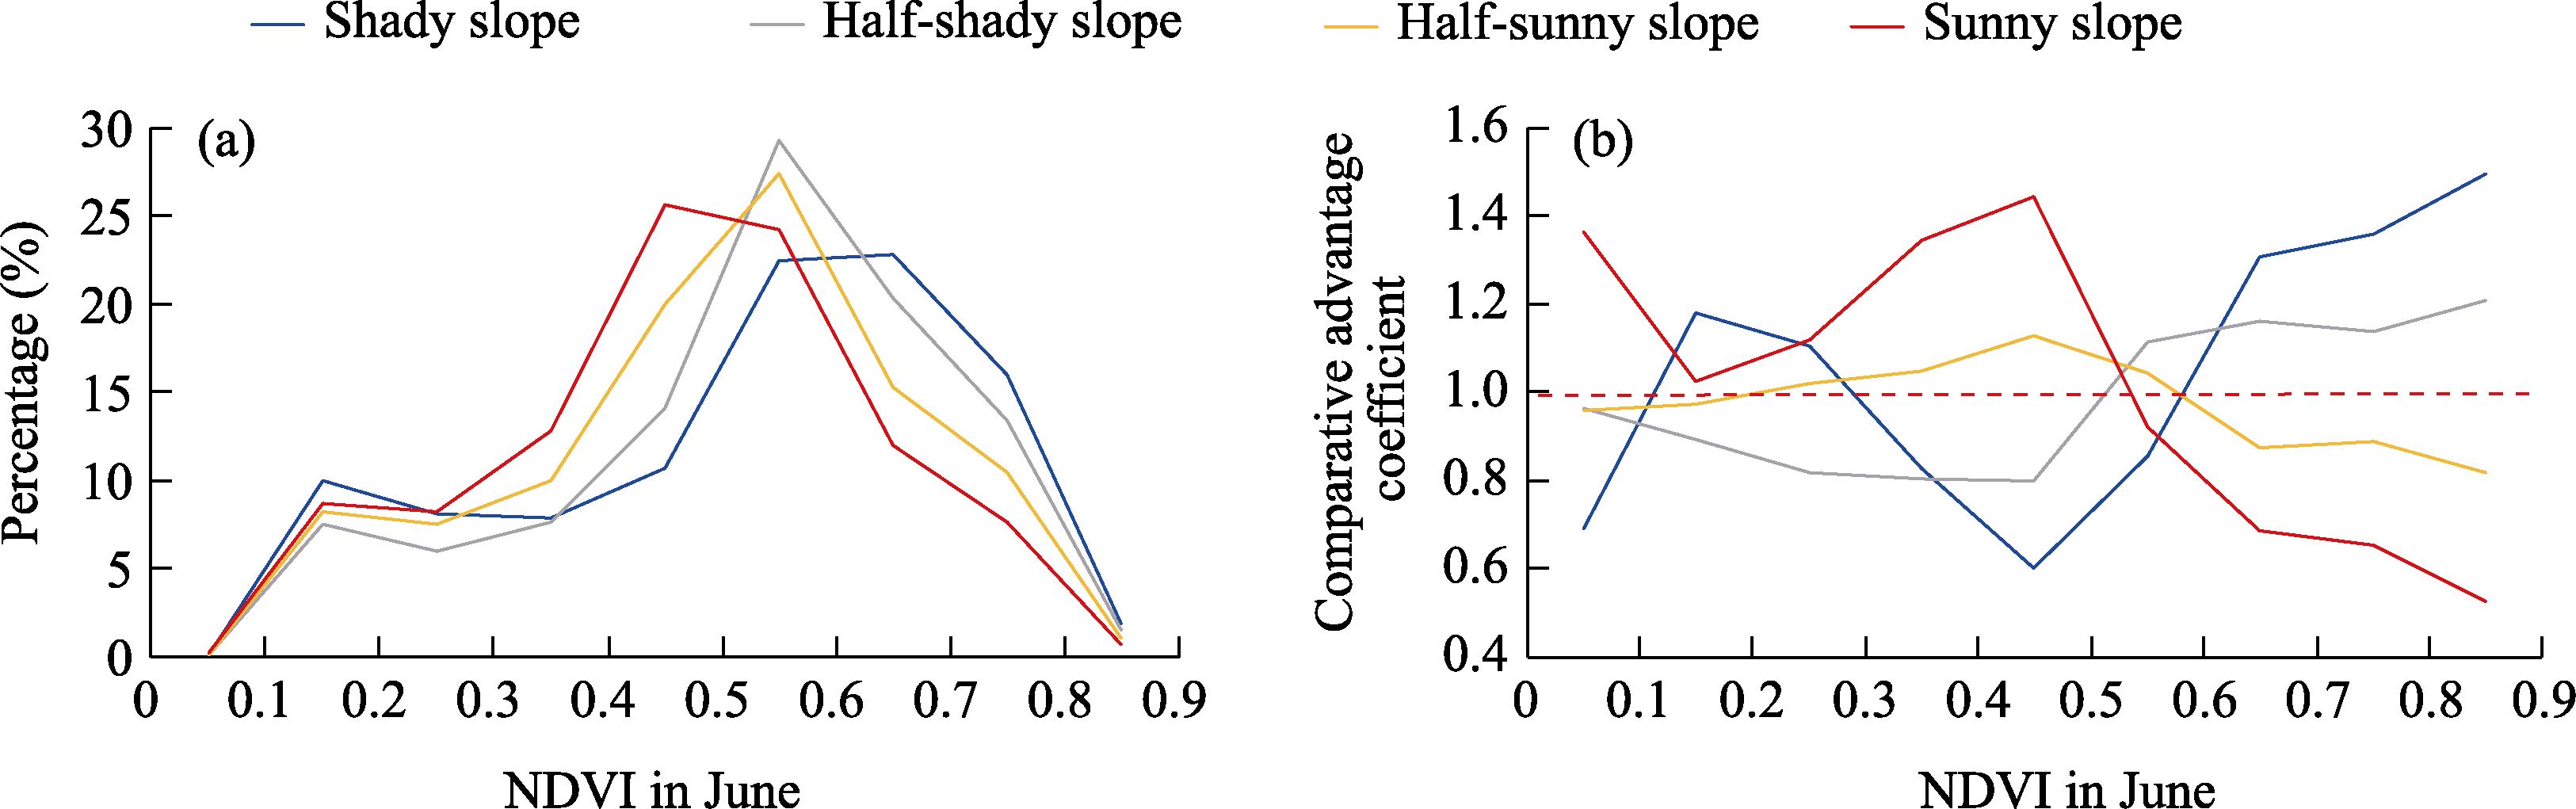
Figure 14
Coupling between the NDVI and the shape of the slopes before the rainy season
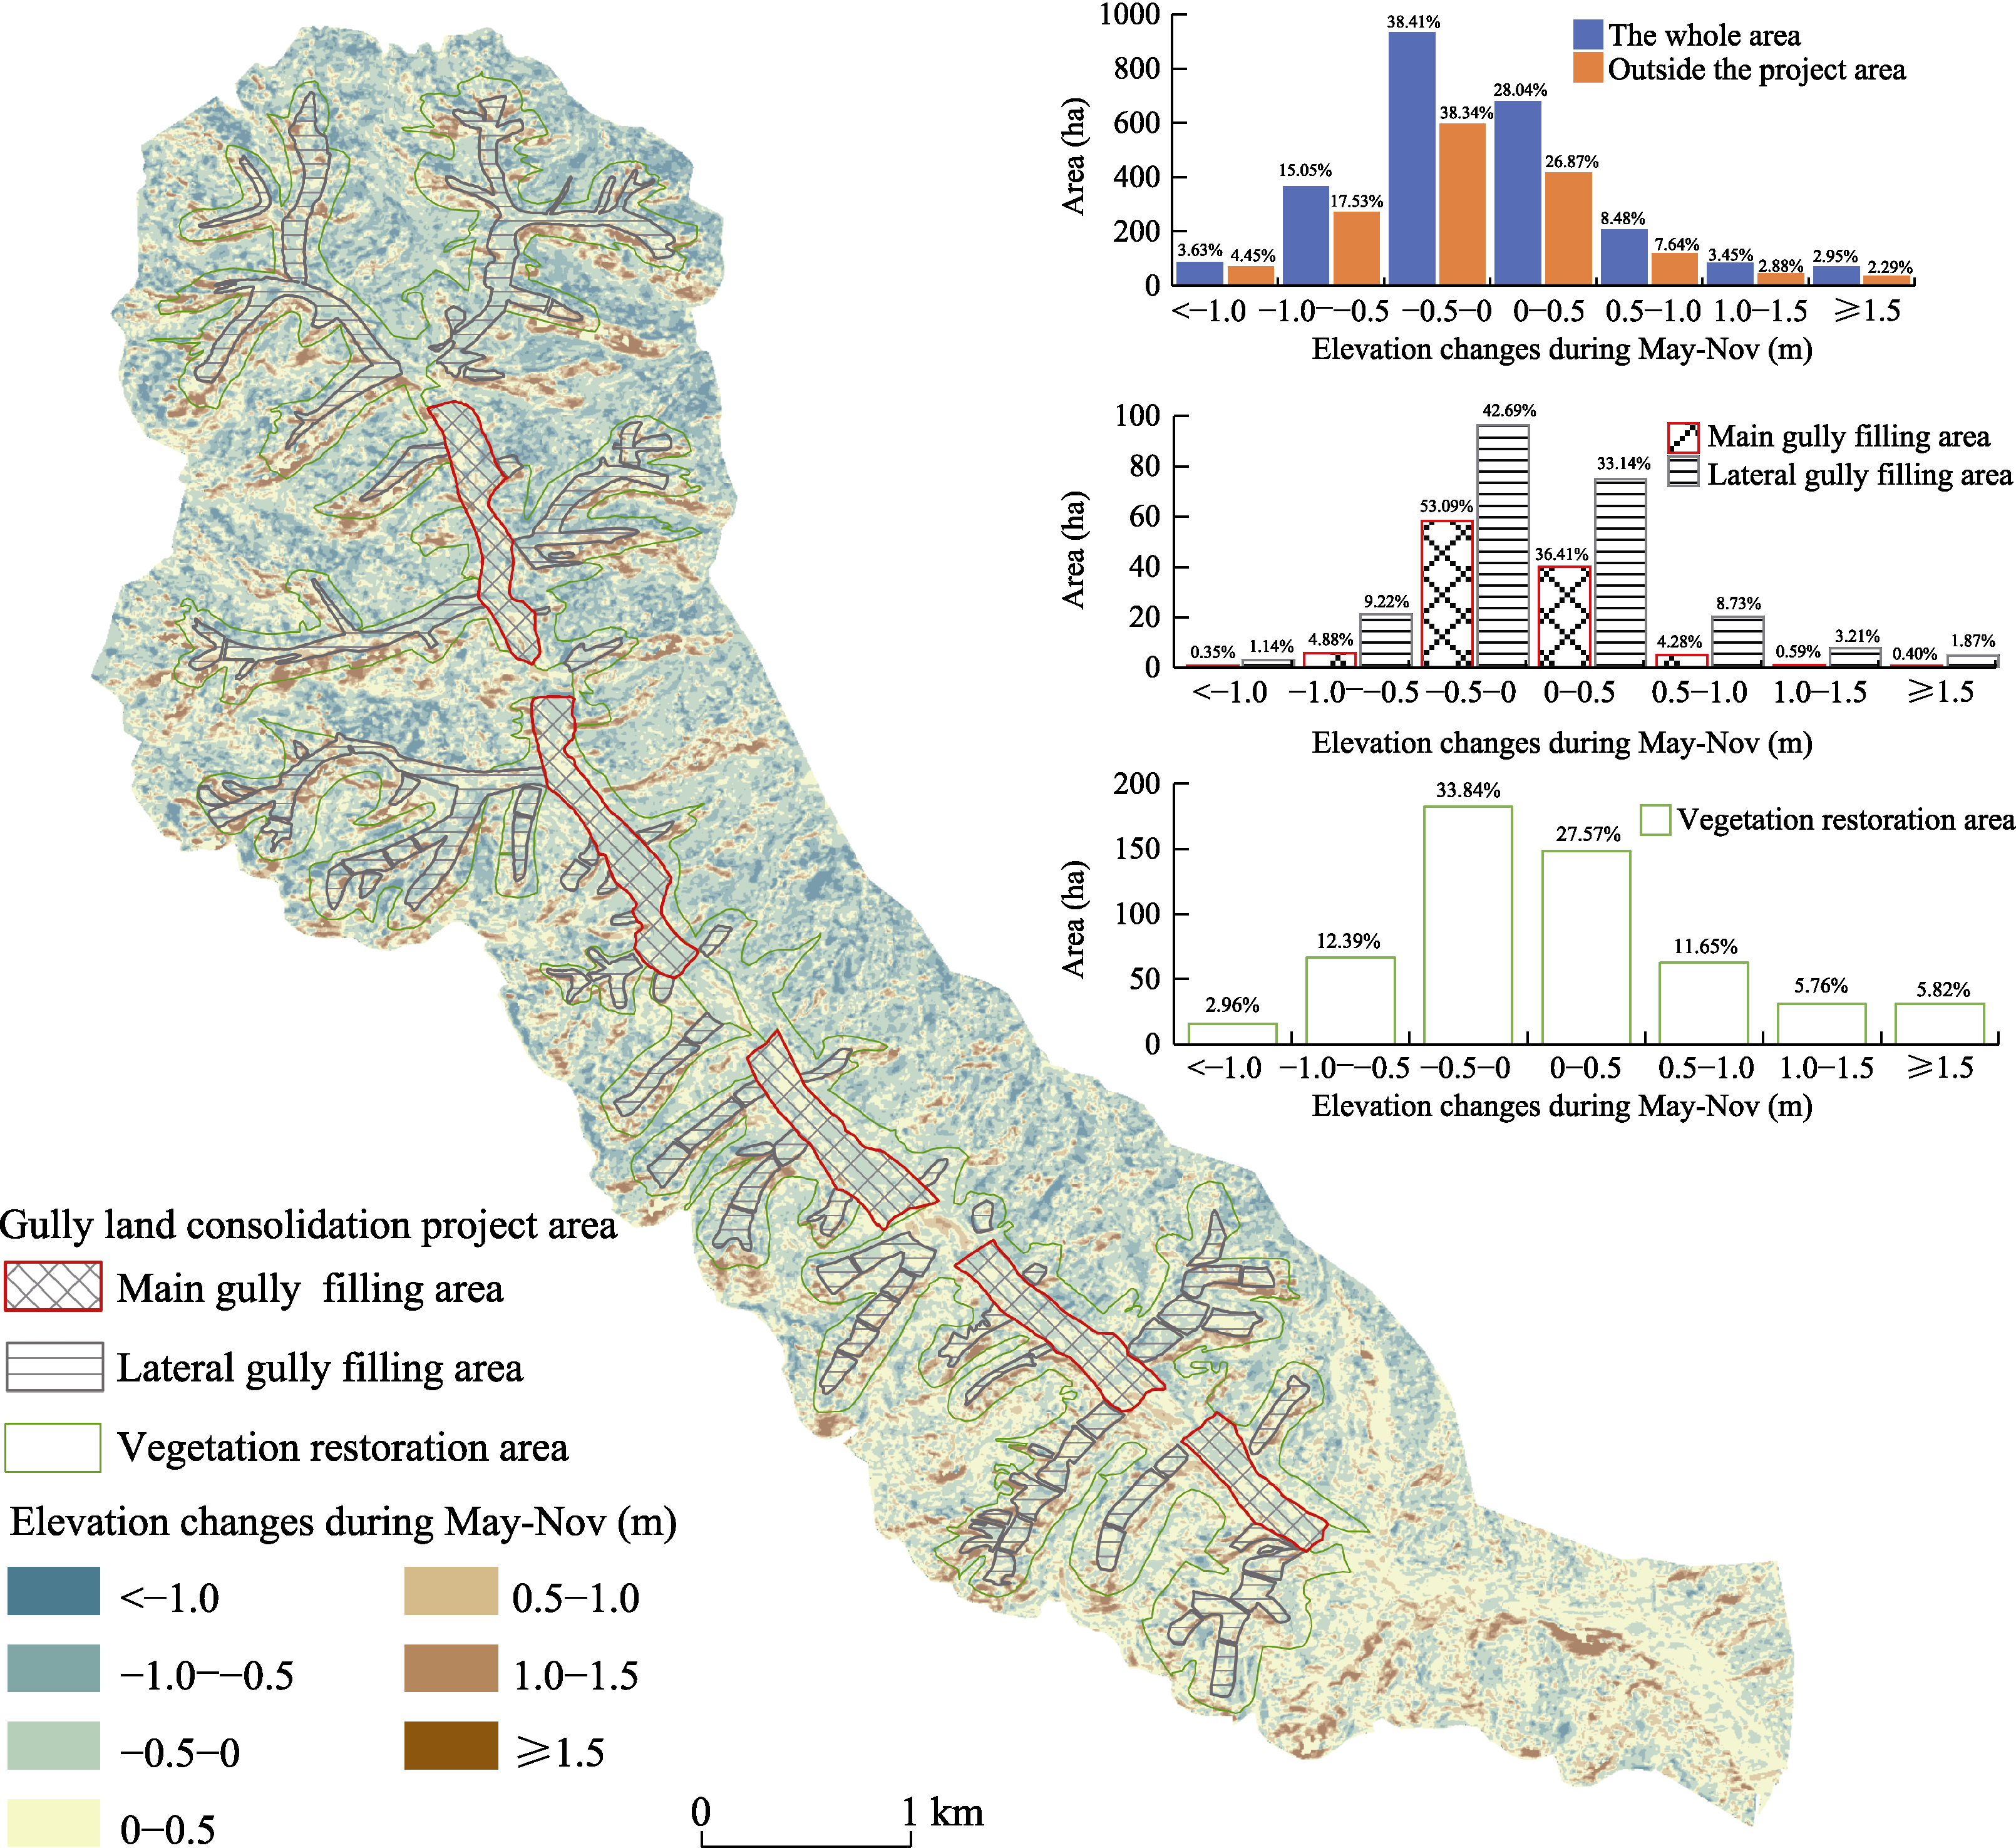
Figure 15
Comparison of changes in elevation between the Gutun catchment and the area under the Gully Land Consolidation Project
Note: The histograms reflect the areas undergoing different levels of changes in elevation between the Gutun catchment and the parts of its area designated under the Gully Land Consolidation Project. The percentage labels in the histograms reflect the area ratios of different levels of changes in elevation to the corresponding area.