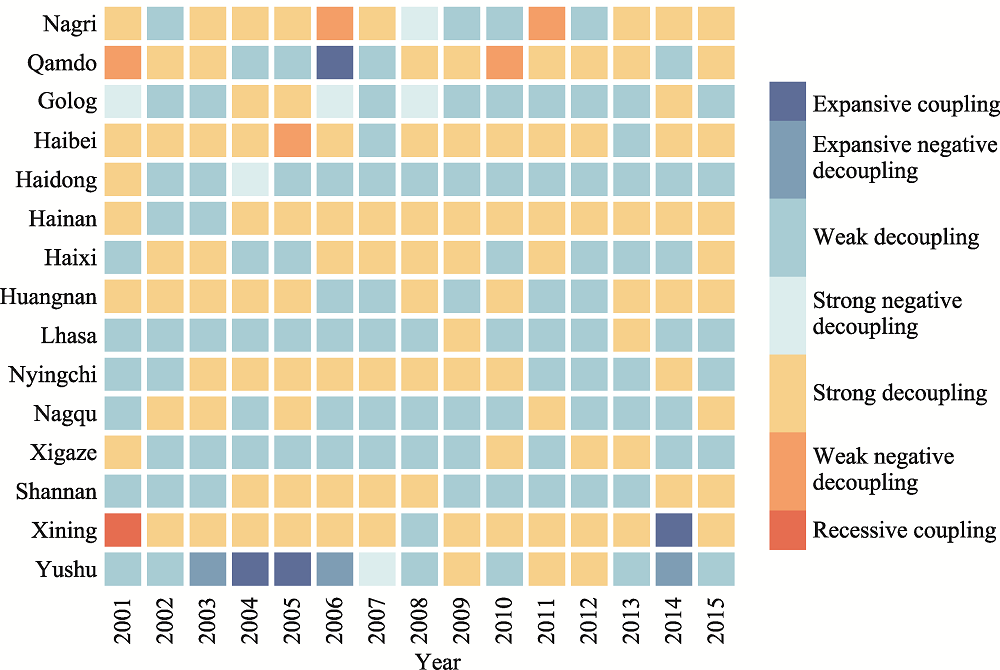
| Year | Area | ΔE | ΔU | DI | Status | Area | ΔE | ΔU | DI | Status |
|---|---|---|---|---|---|---|---|---|---|---|
| 2001 | Qinghai | -0.0214 | 0.0134 | -0.5817 | Strong decoupling | Tibet | -0.0009 | 0.0172 | -0.0118 | Strong decoupling |
| 2002 | Qinghai | 0.0041 | 0.0095 | 0.1747 | Weak decoupling | Tibet | -0.0073 | 0.0144 | -0.1317 | Strong decoupling |
| 2003 | Qinghai | -0.0024 | 0.0101 | -0.0997 | Strong decoupling | Tibet | 0.0041 | 0.0100 | 0.1176 | Weak decoupling |
| 2004 | Qinghai | -0.0234 | 0.0089 | -1.1814 | Strong decoupling | Tibet | 0.0009 | 0.0094 | 0.0275 | Weak decoupling |
| 2005 | Qinghai | 0.0243 | 0.0152 | 0.7844 | Weak decoupling | Tibet | 0.0003 | 0.0072 | 0.0142 | Weak decoupling |
| 2006 | Qinghai | -0.0049 | 0.0178 | -0.1381 | Strong decoupling | Tibet | -0.0006 | 0.0129 | -0.0159 | Strong decoupling |
| 2007 | Qinghai | -0.0054 | 0.0214 | -0.1362 | Strong decoupling | Tibet | -0.0016 | 0.0330 | -0.0167 | Strong decoupling |
| 2008 | Qinghai | -0.0049 | 0.0231 | -0.1254 | Strong decoupling | Tibet | -0.0018 | 0.0167 | -0.0437 | Strong decoupling |
| 2009 | Qinghai | 0.0013 | 0.0229 | 0.0356 | Weak decoupling | Tibet | -0.0017 | 0.0188 | -0.0383 | Strong decoupling |
| 2010 | Qinghai | -0.0146 | 0.0319 | -0.3197 | Strong decoupling | Tibet | -0.0009 | 0.0251 | -0.0168 | Strong decoupling |
| 2011 | Qinghai | 0.0034 | 0.0408 | 0.0662 | Weak decoupling | Tibet | -0.0004 | 0.0238 | -0.0094 | Strong decoupling |
| 2012 | Qinghai | -0.0014 | 0.0421 | -0.0280 | Strong decoupling | Tibet | -0.0028 | 0.0322 | -0.0481 | Strong decoupling |
| 2013 | Qinghai | -0.0260 | 0.0400 | -0.6294 | Strong decoupling | Tibet | -0.0029 | 0.0374 | -0.0463 | Strong decoupling |
| 2014 | Qinghai | -0.0454 | 0.0414 | -1.2288 | Strong decoupling | Tibet | -0.0096 | 0.0345 | -0.1862 | Strong decoupling |
| 2015 | Qinghai | 0.0500 | 0.0404 | 1.6851 | Expanding negative decoupling | Tibet | 0.0053 | 0.0536 | 0.0730 | Weak decoupling |