| Classification of group | Gravel coverage (%) | WR (g m-2 min-1) | Cv (%) | Dr (%) | Regression (R2/F) | ||
|---|---|---|---|---|---|---|---|
| Min | Max | Mean | |||||
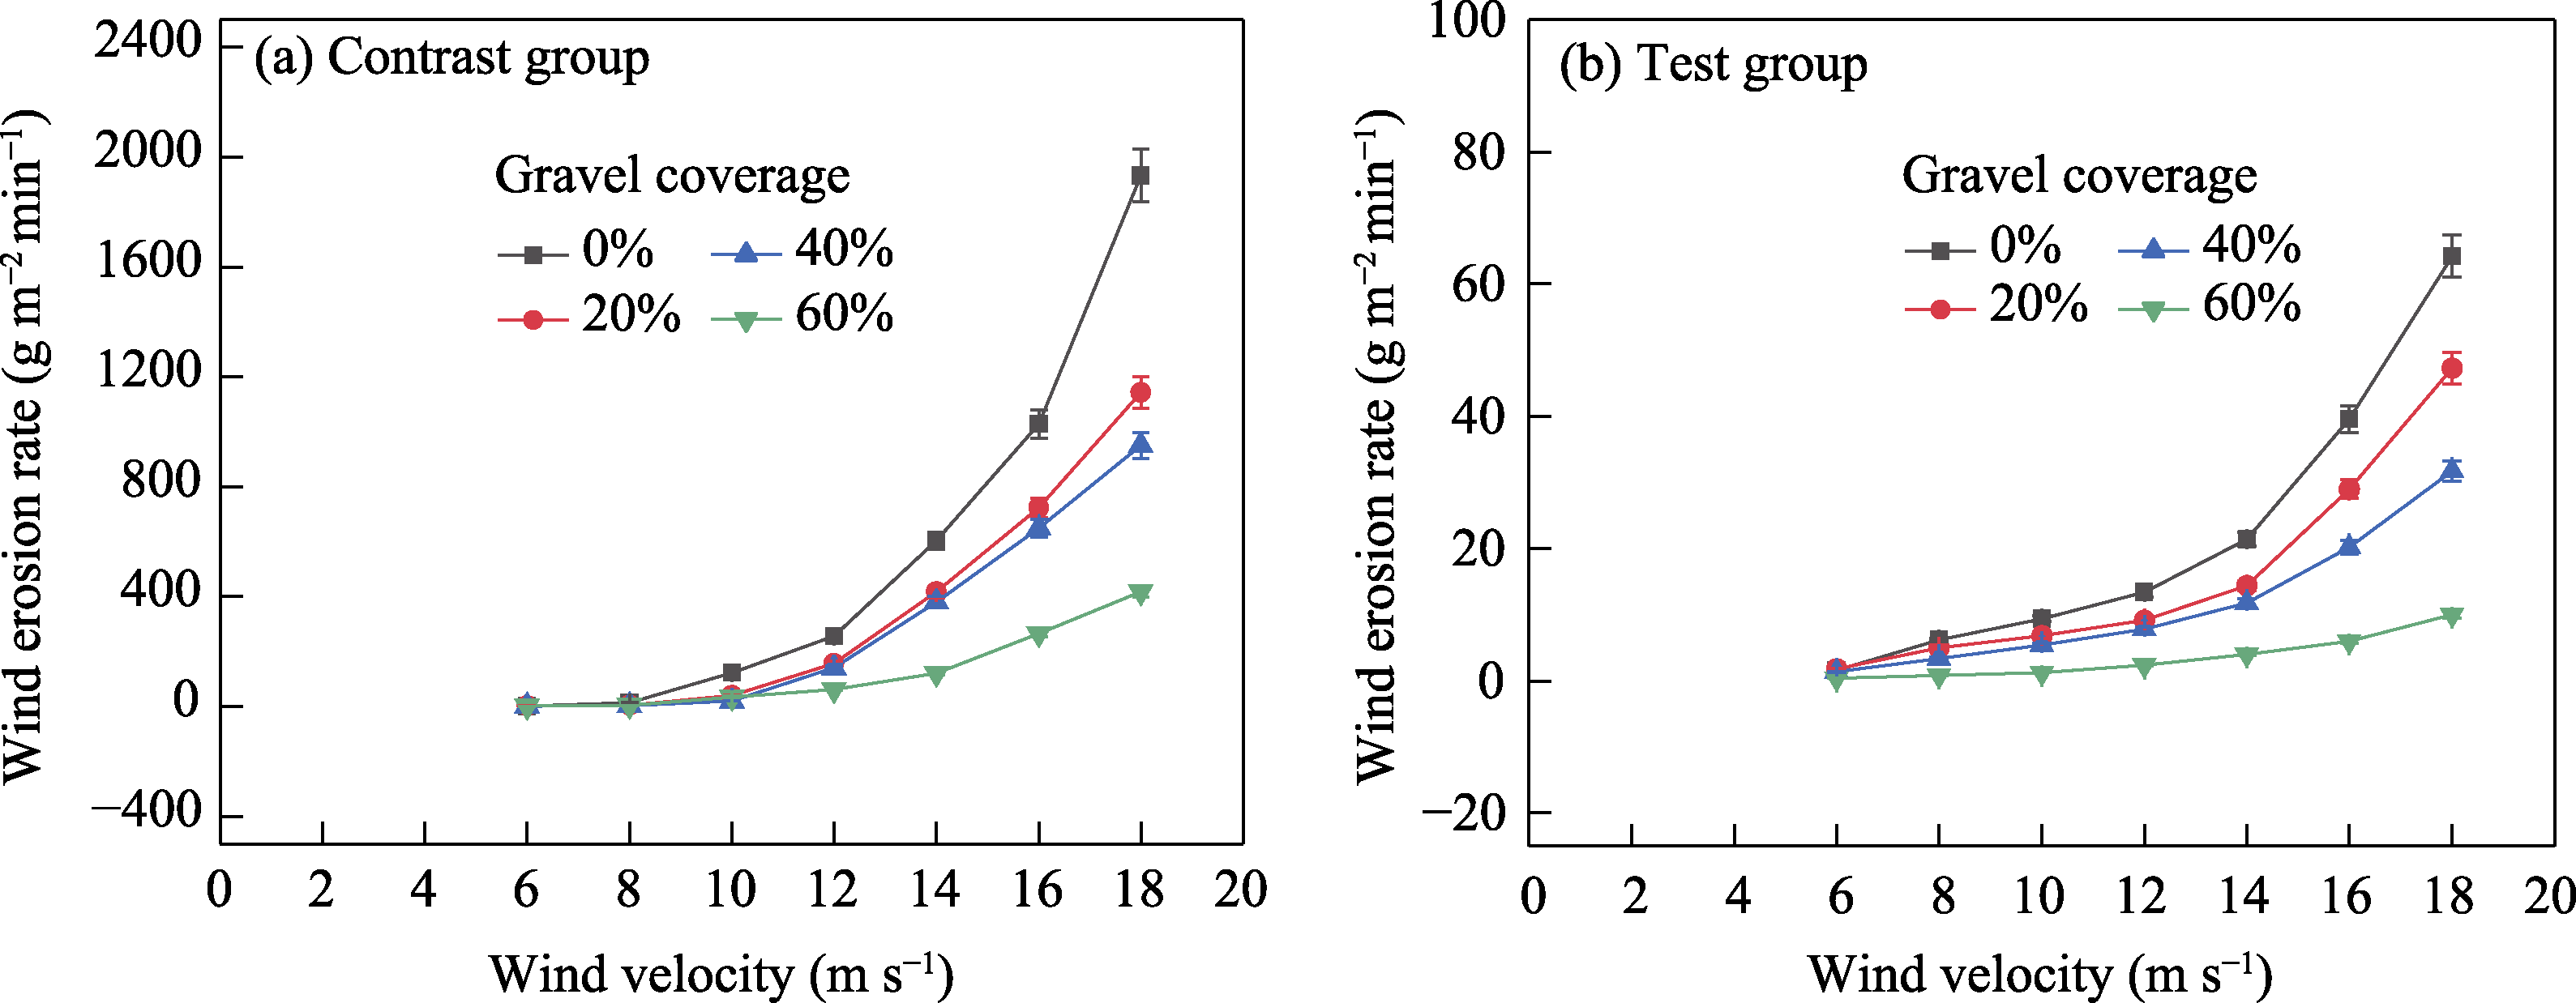
| Contrast group | 0 | 1.1 | 1931.2 | 565.3±654.1Aa | 115.7 | y=1.19x3.85 (0.998/22.99) | |
| 20 | 2.8 | 1142.8 | 355.4±404.6Aab | 113.8 | 37.1 | y=4E-05x6.05 (0.969/29.31) | |
| 40 | 1.2 | 950.0 | 306.9±344.6Aab | 112.3 | 45.7 | y=5E-06x6.70 (0.929/33.42) | |
| 60 | 0.8 | 418.0 | 129.7±145.2Ab | 111.9 | 77.1 | y=4E-05x5.68 (0.986/25.85) | |
| Total group | 0.8 | 1931.2 | 339.3±454.9A | / | / | y=2E-05x6.25 (0.760/27.55) | |
| Test group | 0 | 1.6 | 64.2 | 22.3±20.7Ba | 92.8 | / | y=0.007x3.10 (0.979/28.17) |
| 20 | 1.8 | 47.3 | 16.2±15.1Bab | 93.4 | 27.2 | y=0.01x2.75 (0.953/23.02) | |
| 40 | 1.4 | 31.7 | 11.7±10.0Bab | 85.6 | 47.5 | y=0.01x2.70 (0.977/33.82) | |
| 60 | 0.4 | 10.0 | 3.6±3.2Bb | 90.1 | 84.0 | y=0.002x2.91 (0.985/34.85) | |
| Total group | 0.4 | 64.2 | 13.4±15.4B | / | / | y=0.008x2.88 (0.972/27.89) | |