×
模态框(Modal)标题
在这里添加一些文本
关闭
关闭
提交更改
取消
确定并提交
×
模态框(Modal)标题
×
期刊
文章
图表
检索
EN
中文
首页
关于期刊
期刊介绍
数据库收录
期刊荣誉
编委会
投稿指南
在线期刊
当期目录
优先出版
过刊浏览
推荐文章
专题
按栏目浏览
阅读排行
下载排行
引用排行
E-mail Alert
RSS
期刊订阅
广告合作
联系我们
EN
中文
图/表 详细信息
Rainfall effects on wind erosion processes on the simulated Gobi surface using indoor experiments
SUN Liying, WANG Chunhui, DUAN Guangyao
地理学报(英文版), 2024, 34(
3
): 610-630. DOI:
10.1007/s11442-024-2220-4
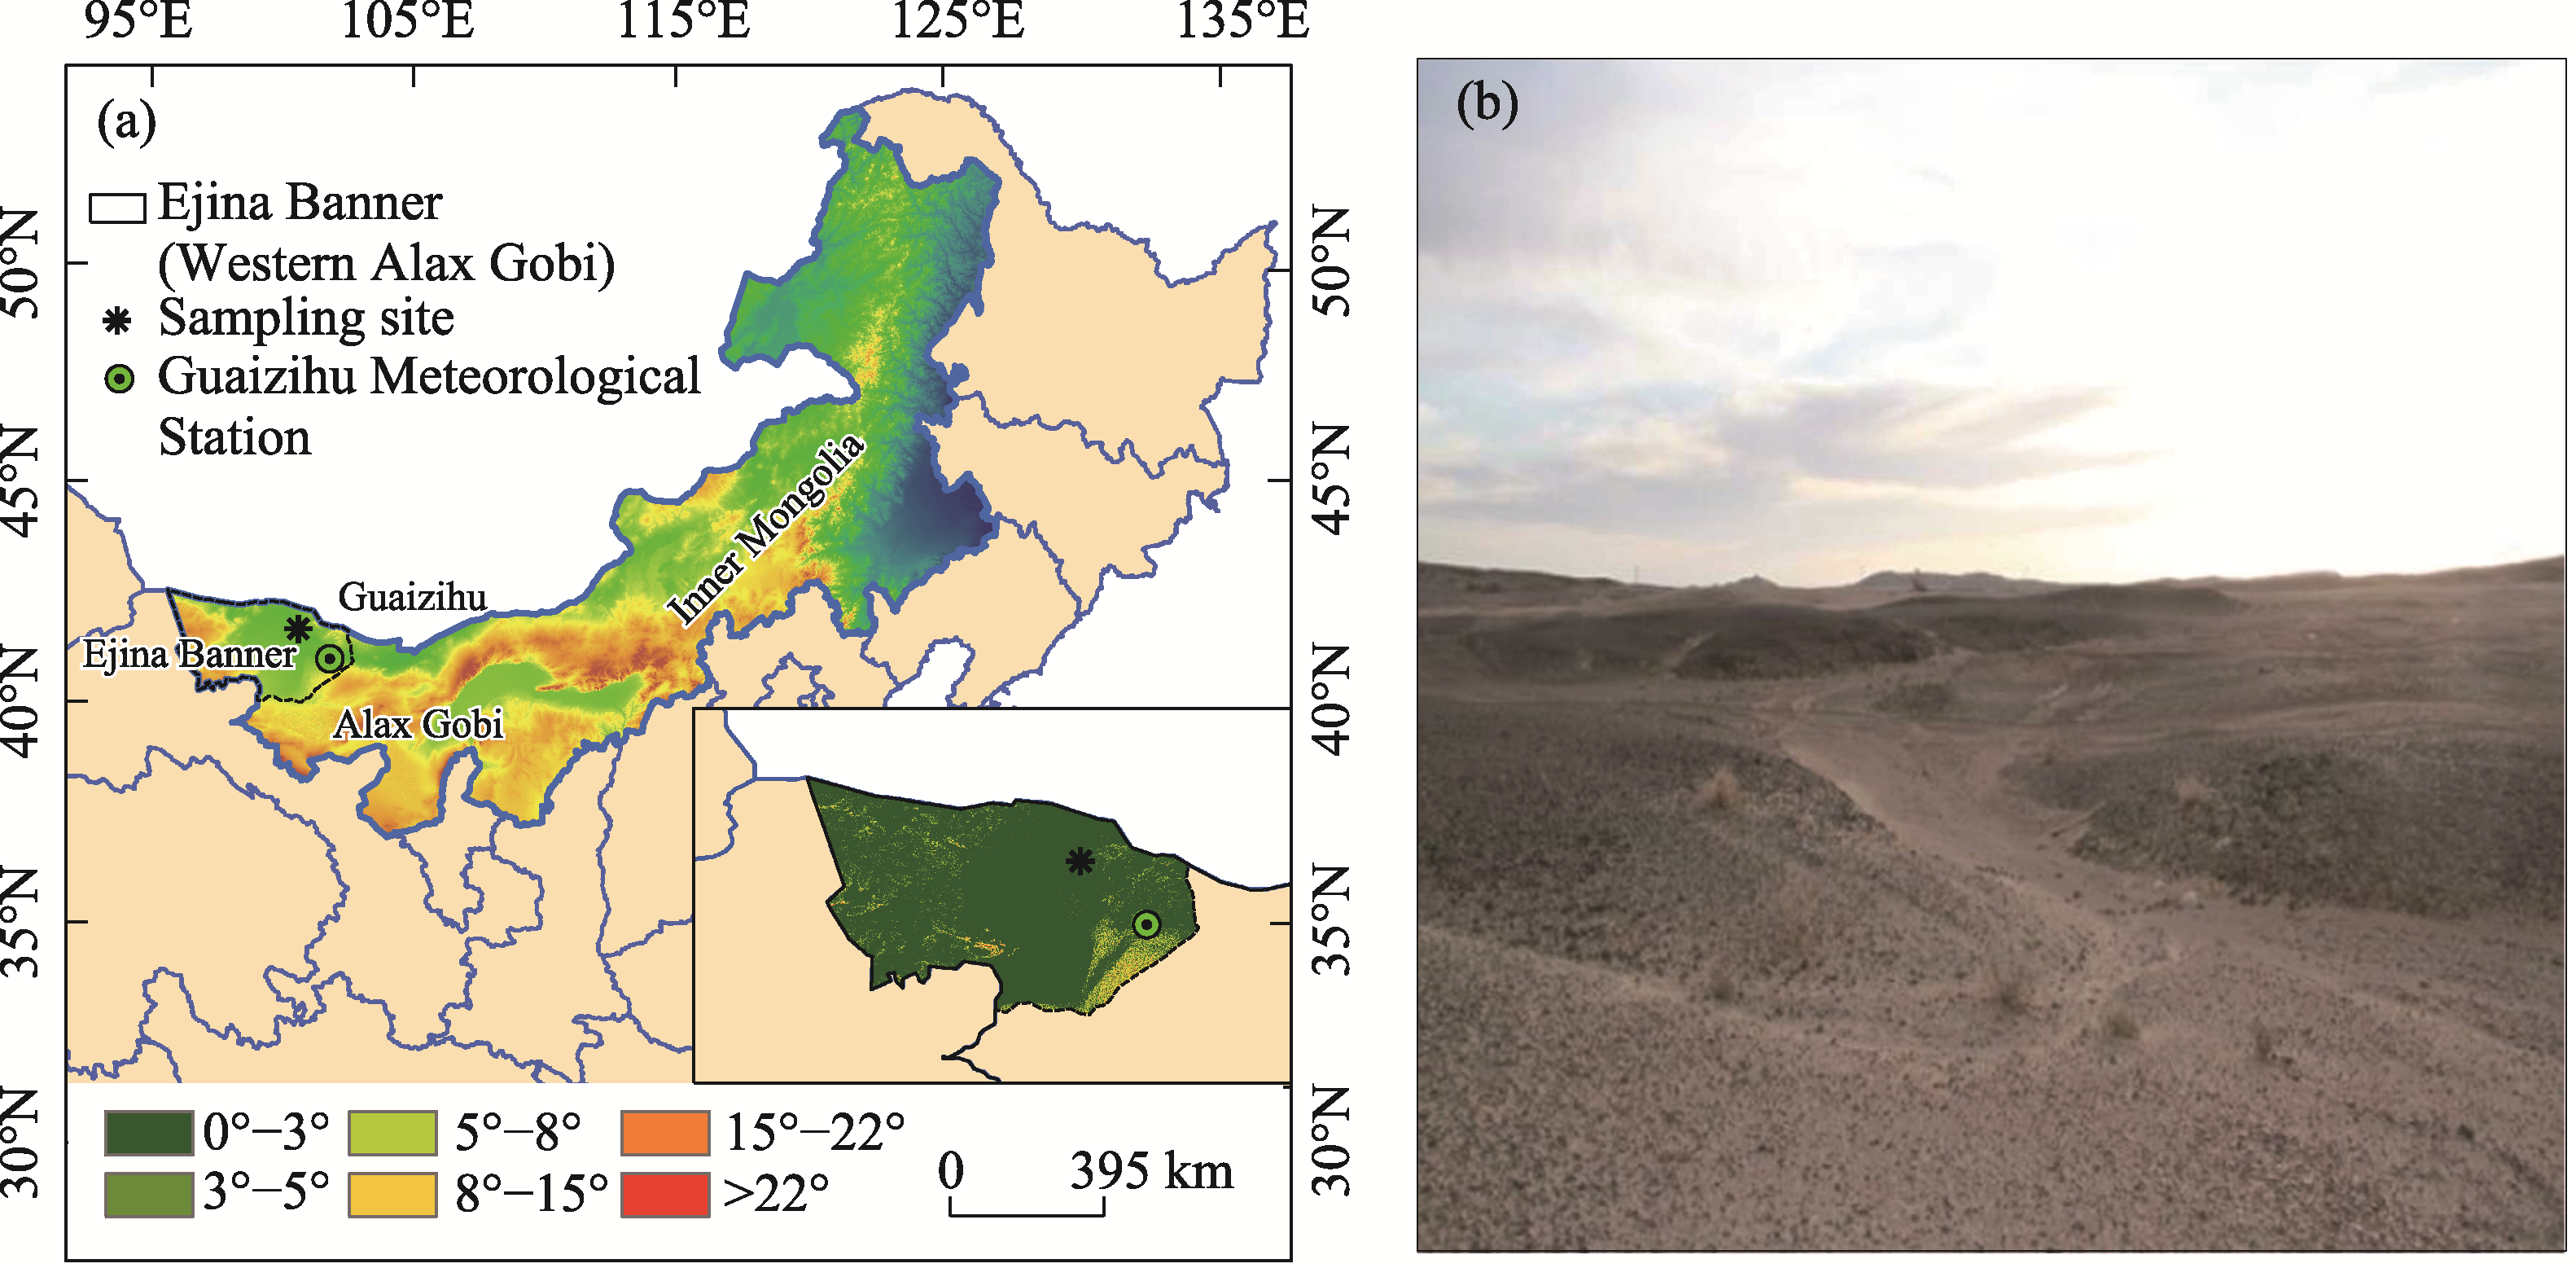
Figure 1
Location and typical landscape of the soil sampling site in Inner Mongolia, China: (a) location and (b) landscape
本文的其它图/表
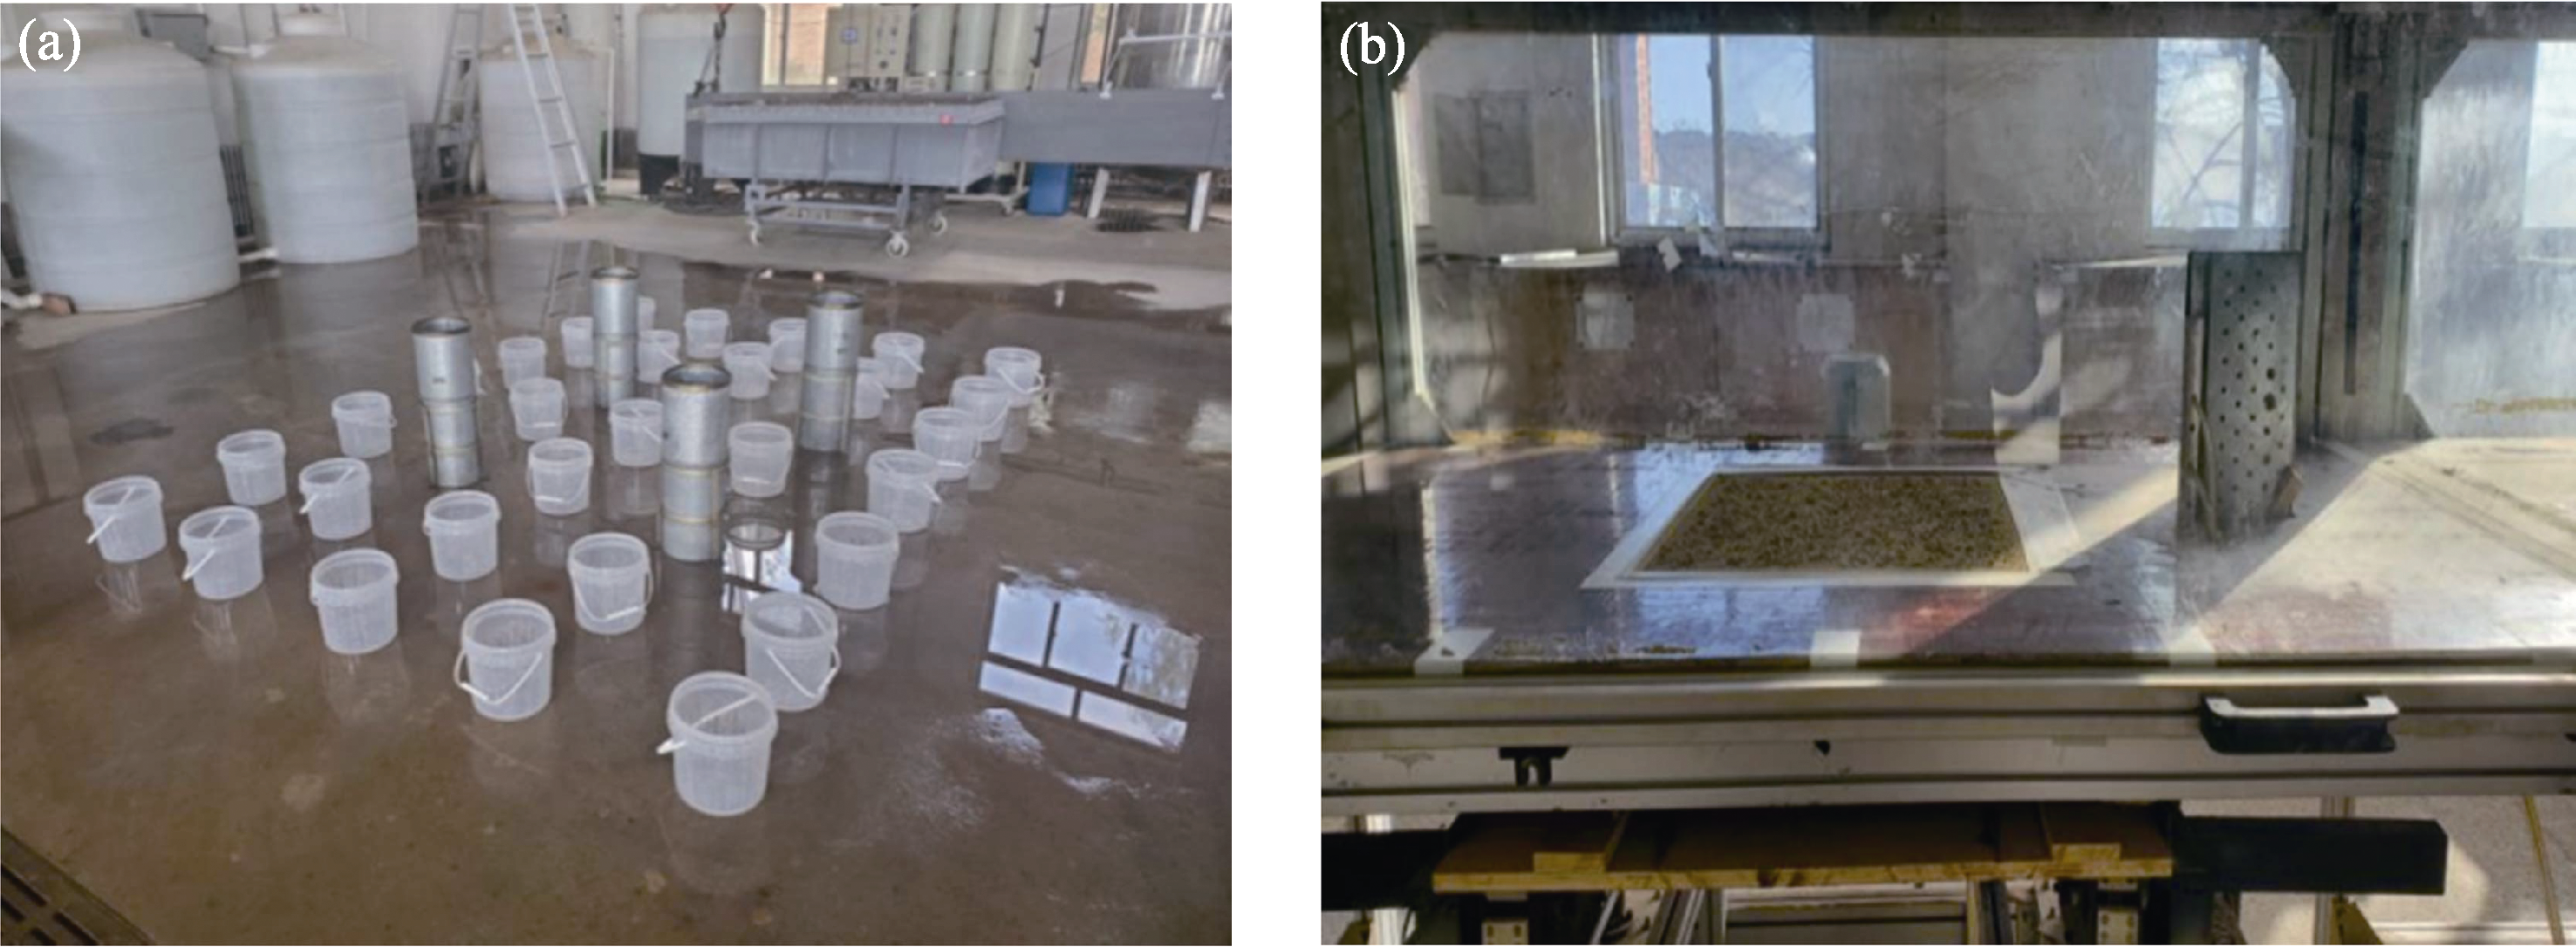
Figure 2
Images of the indoor artificial experiment: (a) calibration of the spatial homogeneity of the rainfall intensity and (b) wind tunnel experiment
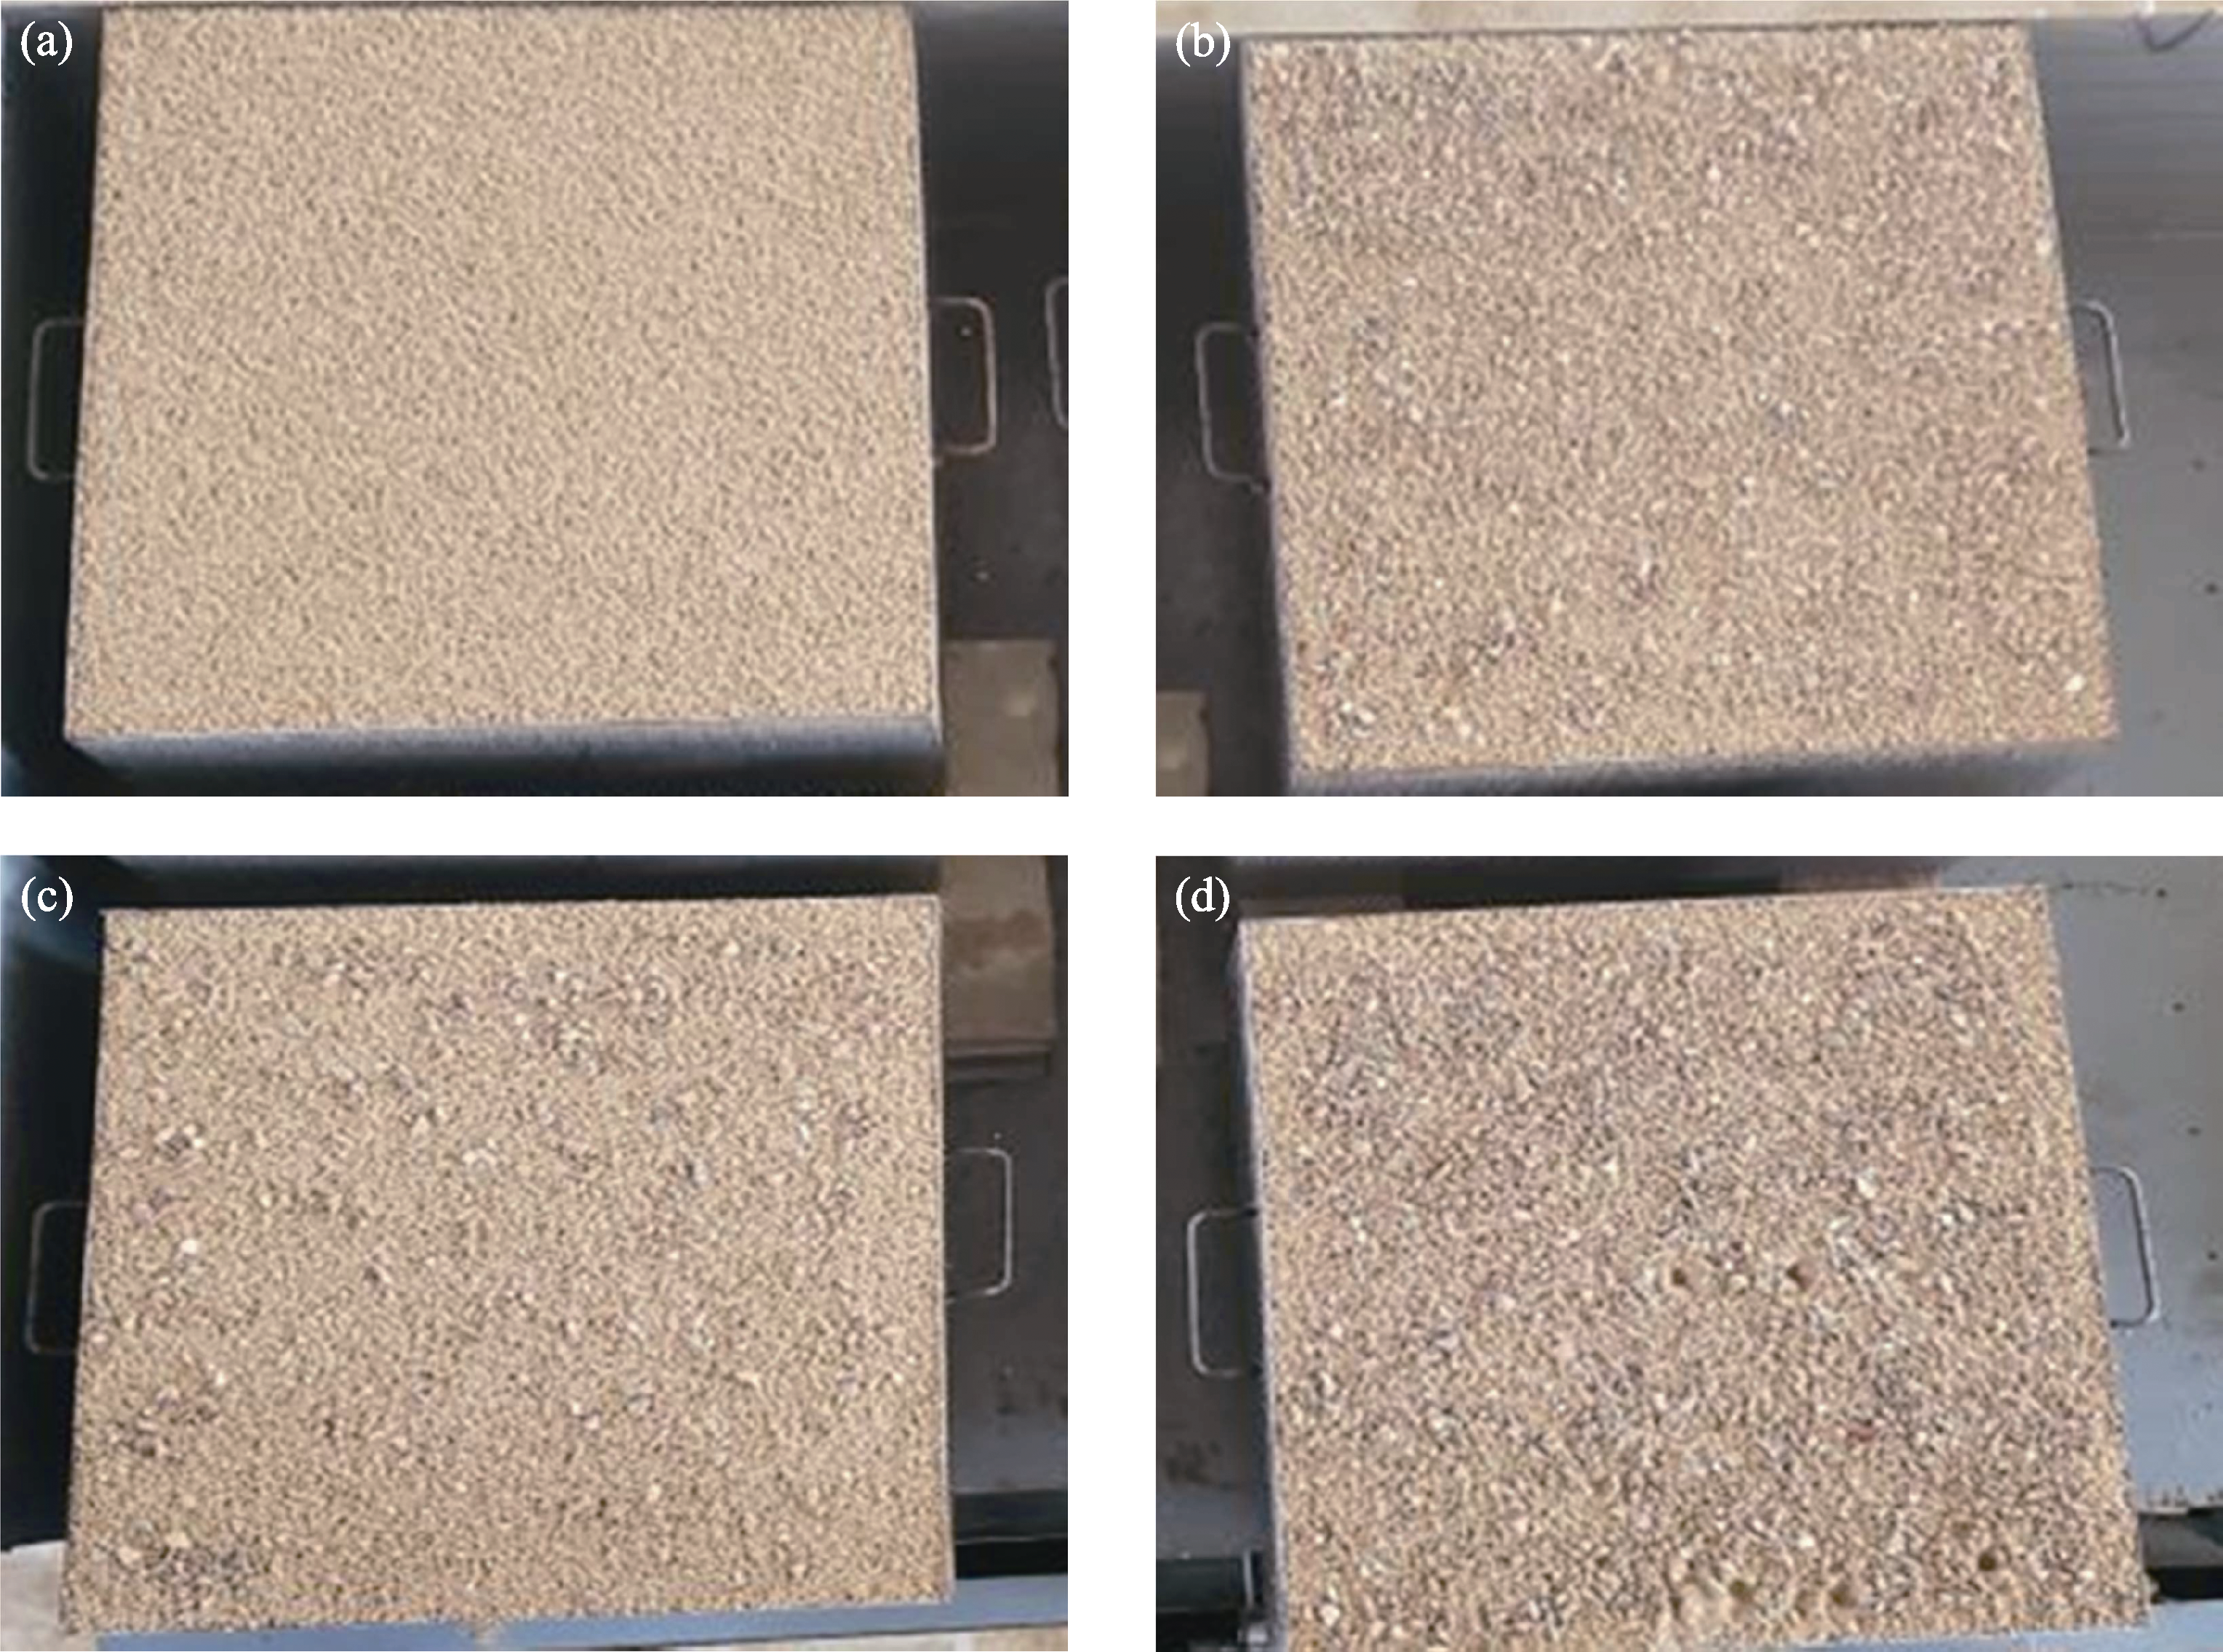
Figure 3
Simulated Gobi surfaces in the experiments with different gravel coverages: (a) 0%; (b) 20%; (c) 40%; and (d) 60%
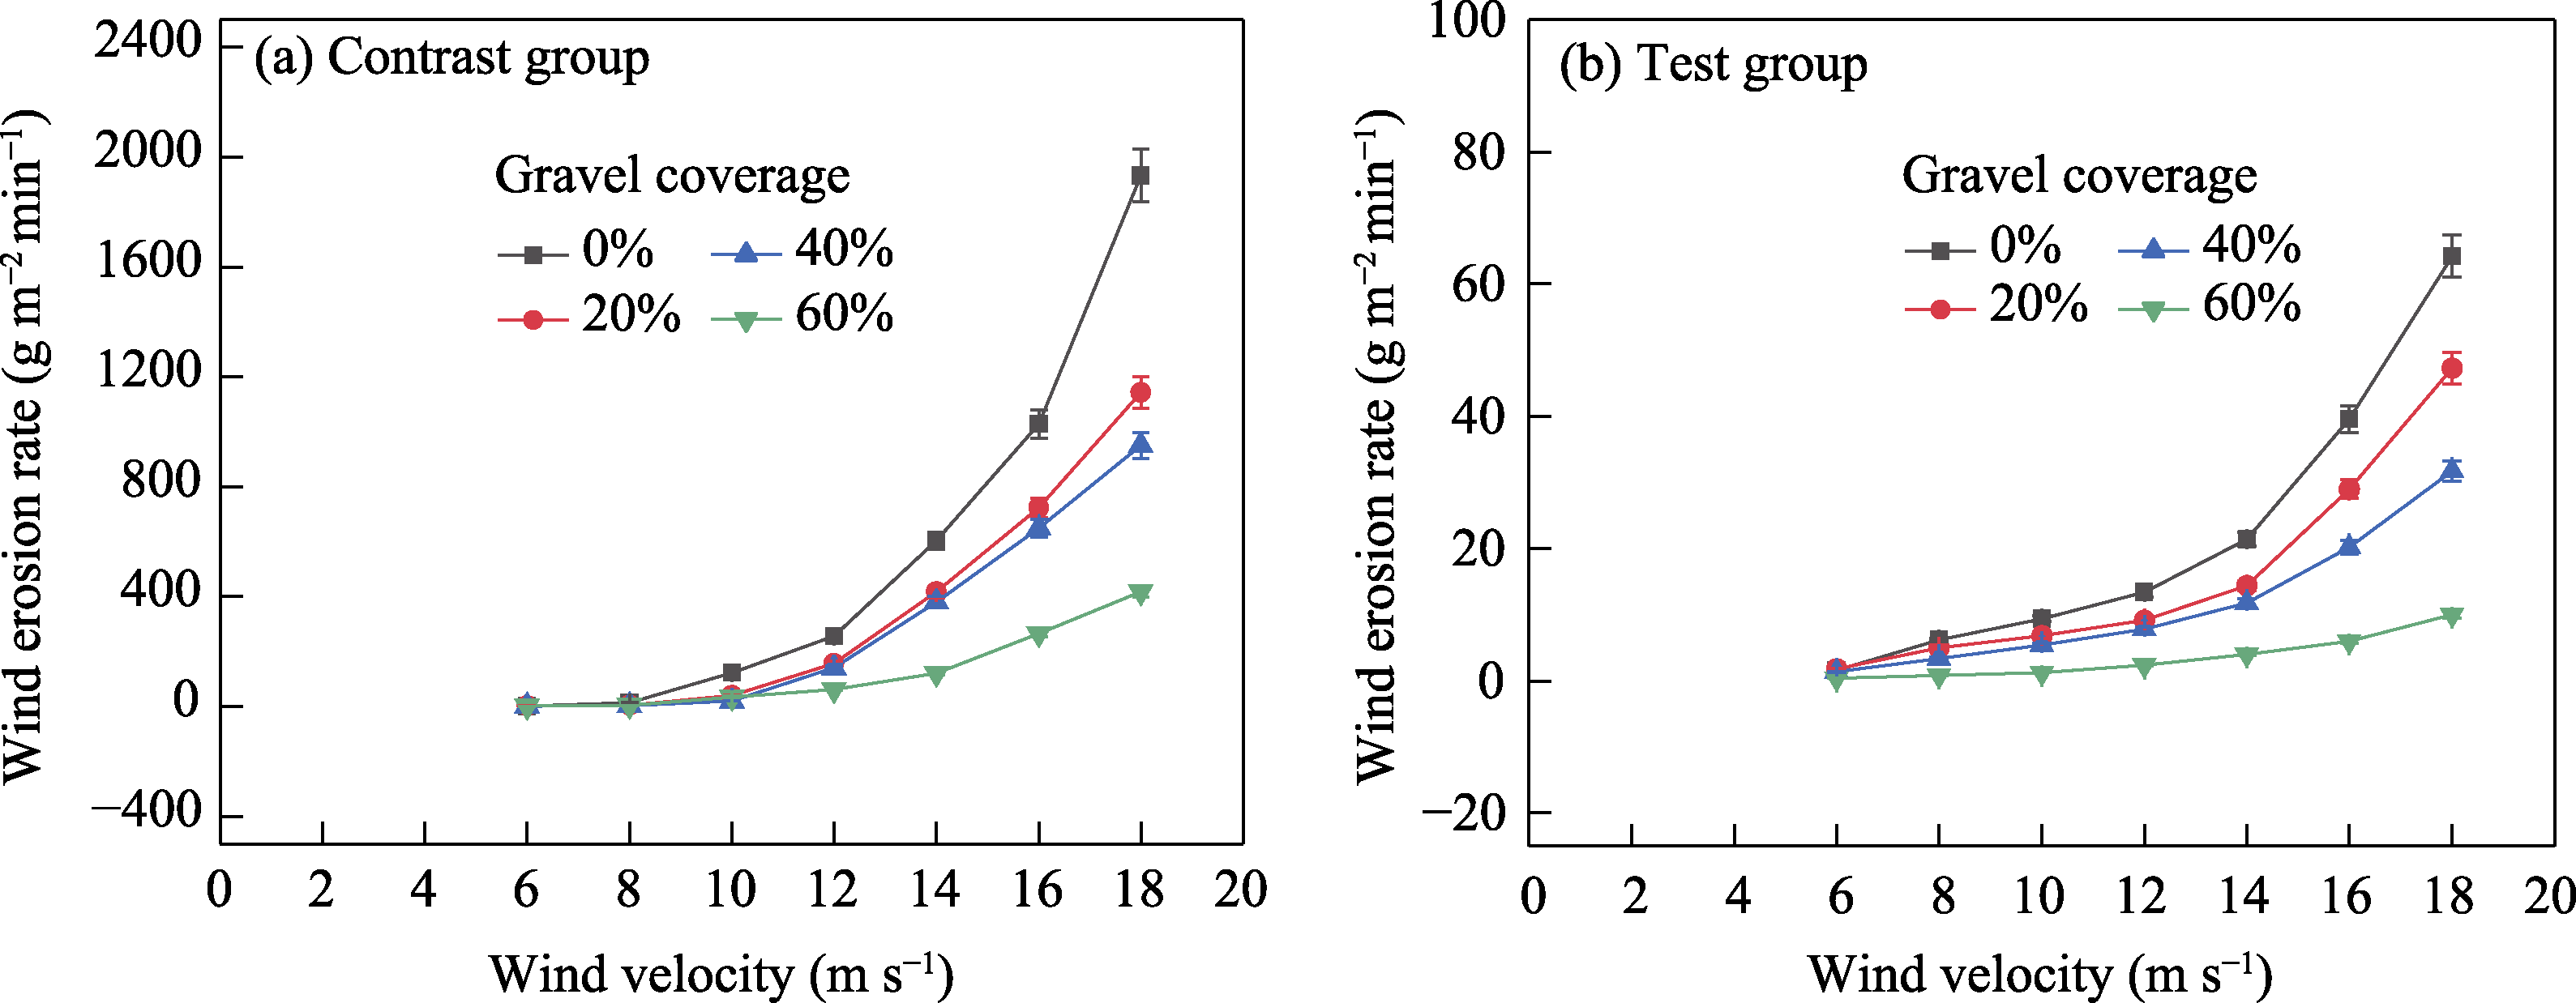
Figure 4
Wind erosion rate (WR) values under different experimental conditions: (a) contrast group and (b) test group
Table 1
Variations in wind erosion rate (WR) and its relationship with wind velocity
Figure 5
Sediment transportation rate (STR) under different experimental conditions: (a) contrast group under 0% gravel coverage; (b) contrast group under 20% gravel coverage; (c) contrast group under 40% gravel coverage; (d) contrast group under 60% gravel coverage; (e) test group under 0% gravel coverage; (f) test group under 20% gravel coverage; (g) test group under 40% gravel coverage; and (h) test group under 60% gravel coverage
Table 2
Variations in the sediment transportation rate (STR) and maximum height under different experimental conditions
Table 3
Relationship between sediment transportation rate (STR) and transportation height under different experimental conditions
Table 4
Contribution of rainfall events to the wind erosion rate (WR) and sediment transportation rate (STR).
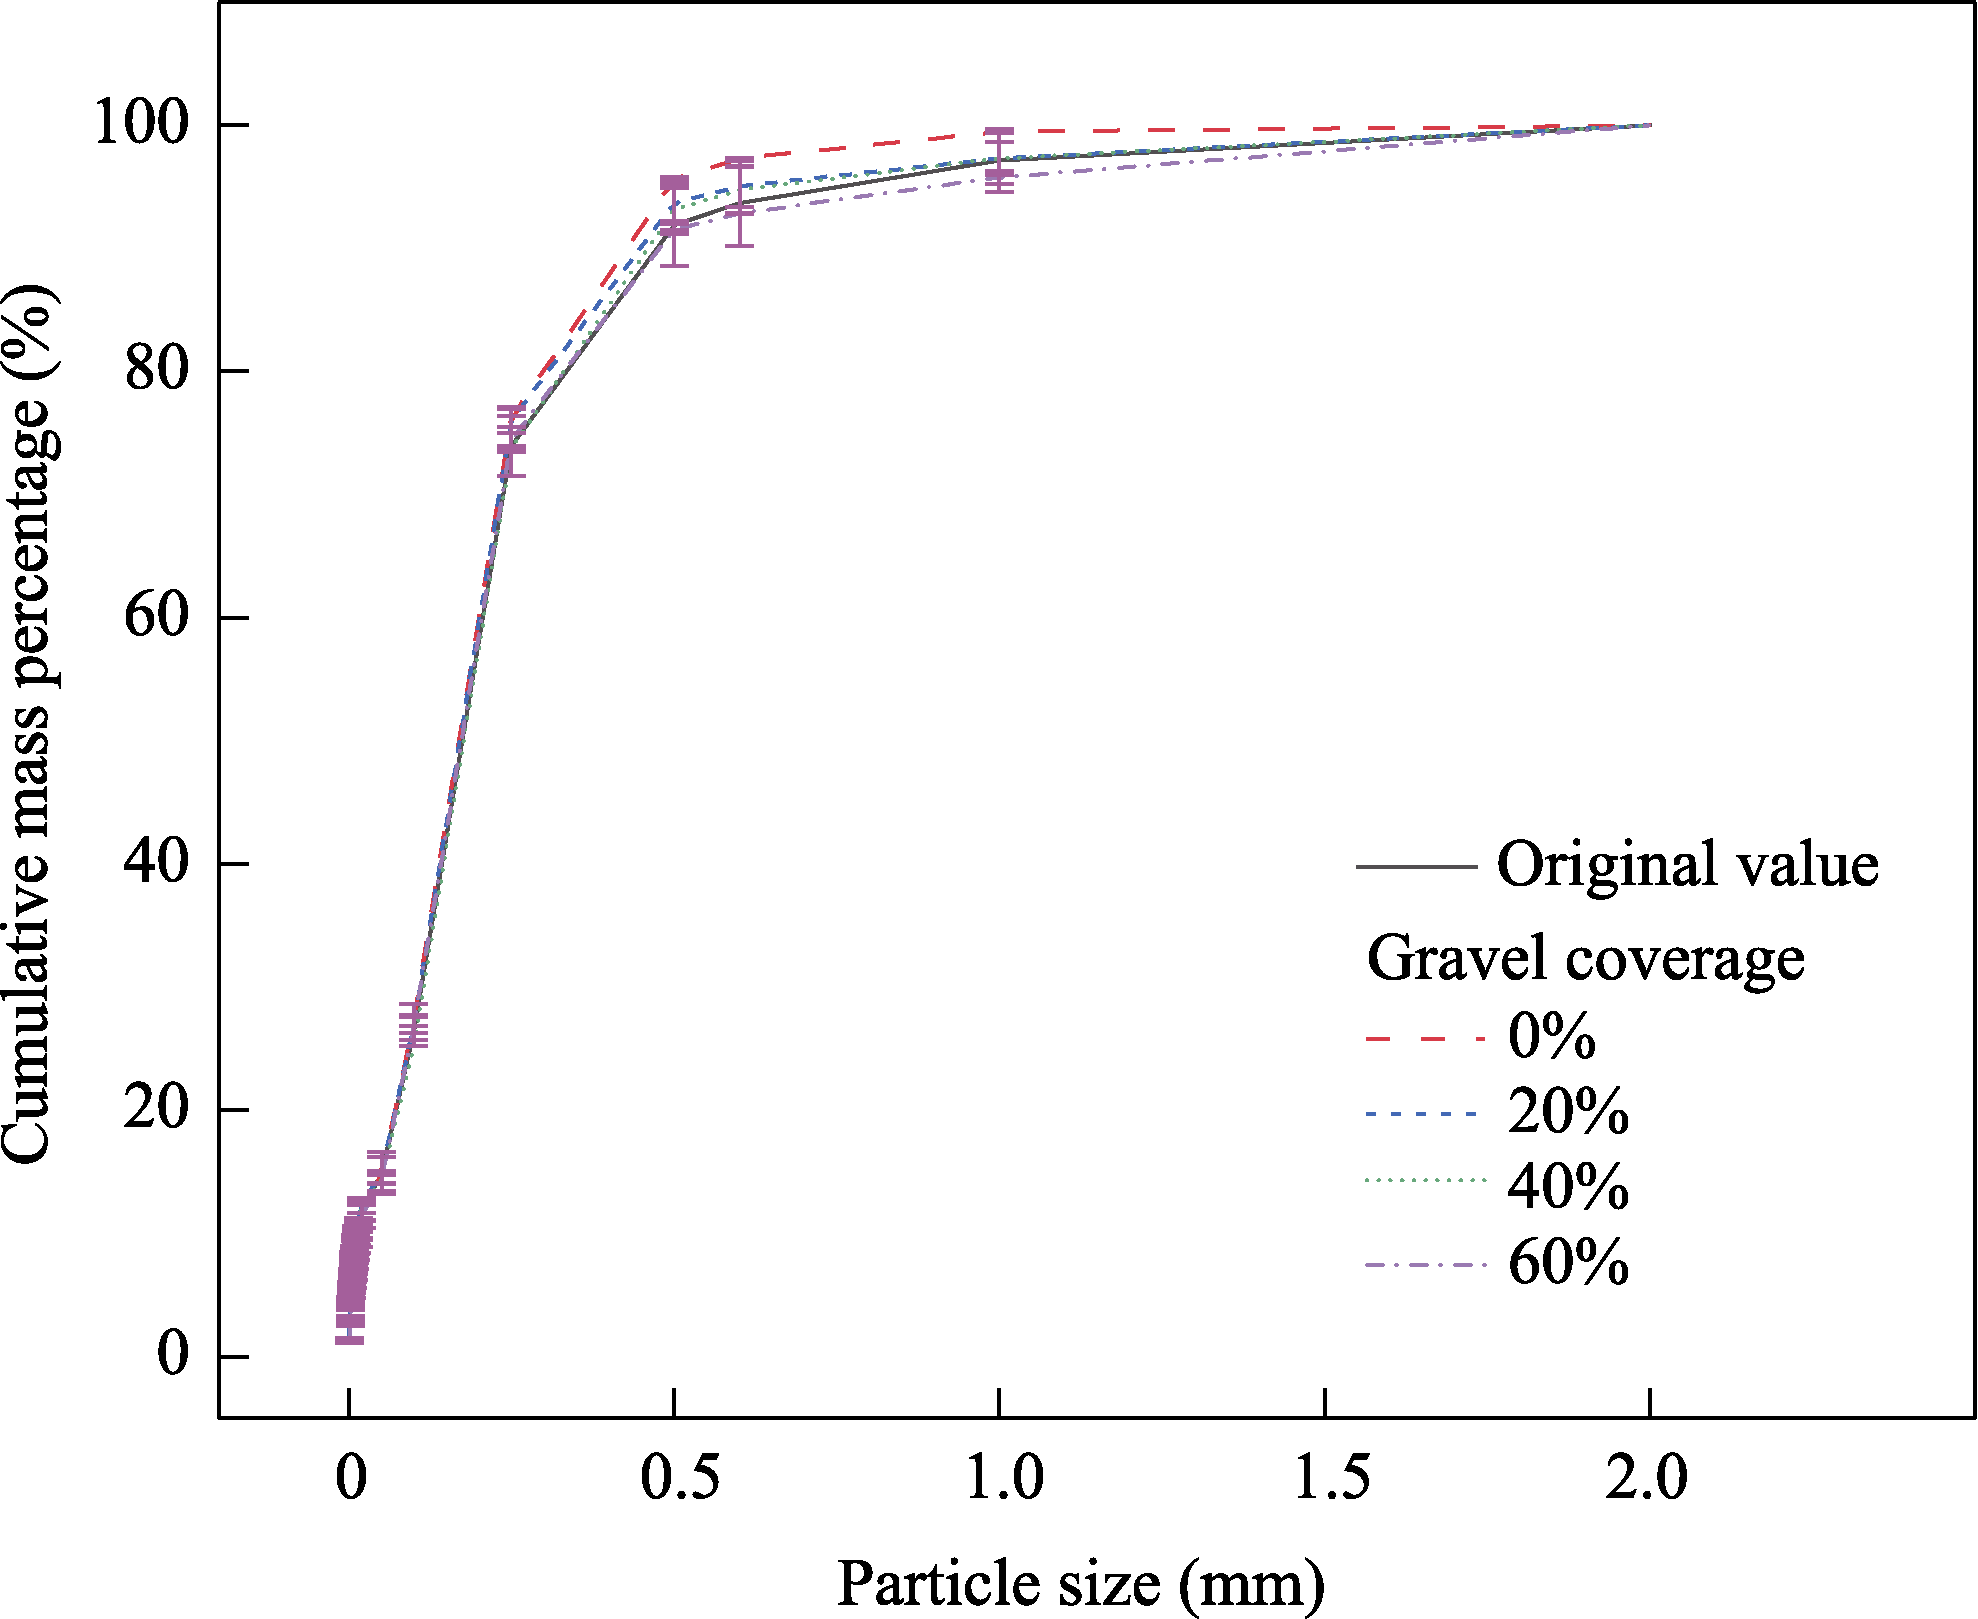
Figure 6
Cumulative mass percents of particles on-slope before (original value) and after rainfall event
Table 5
Particle size distribution (PSD) on-slope before (original value) and after rainfall events under different gravel coverages
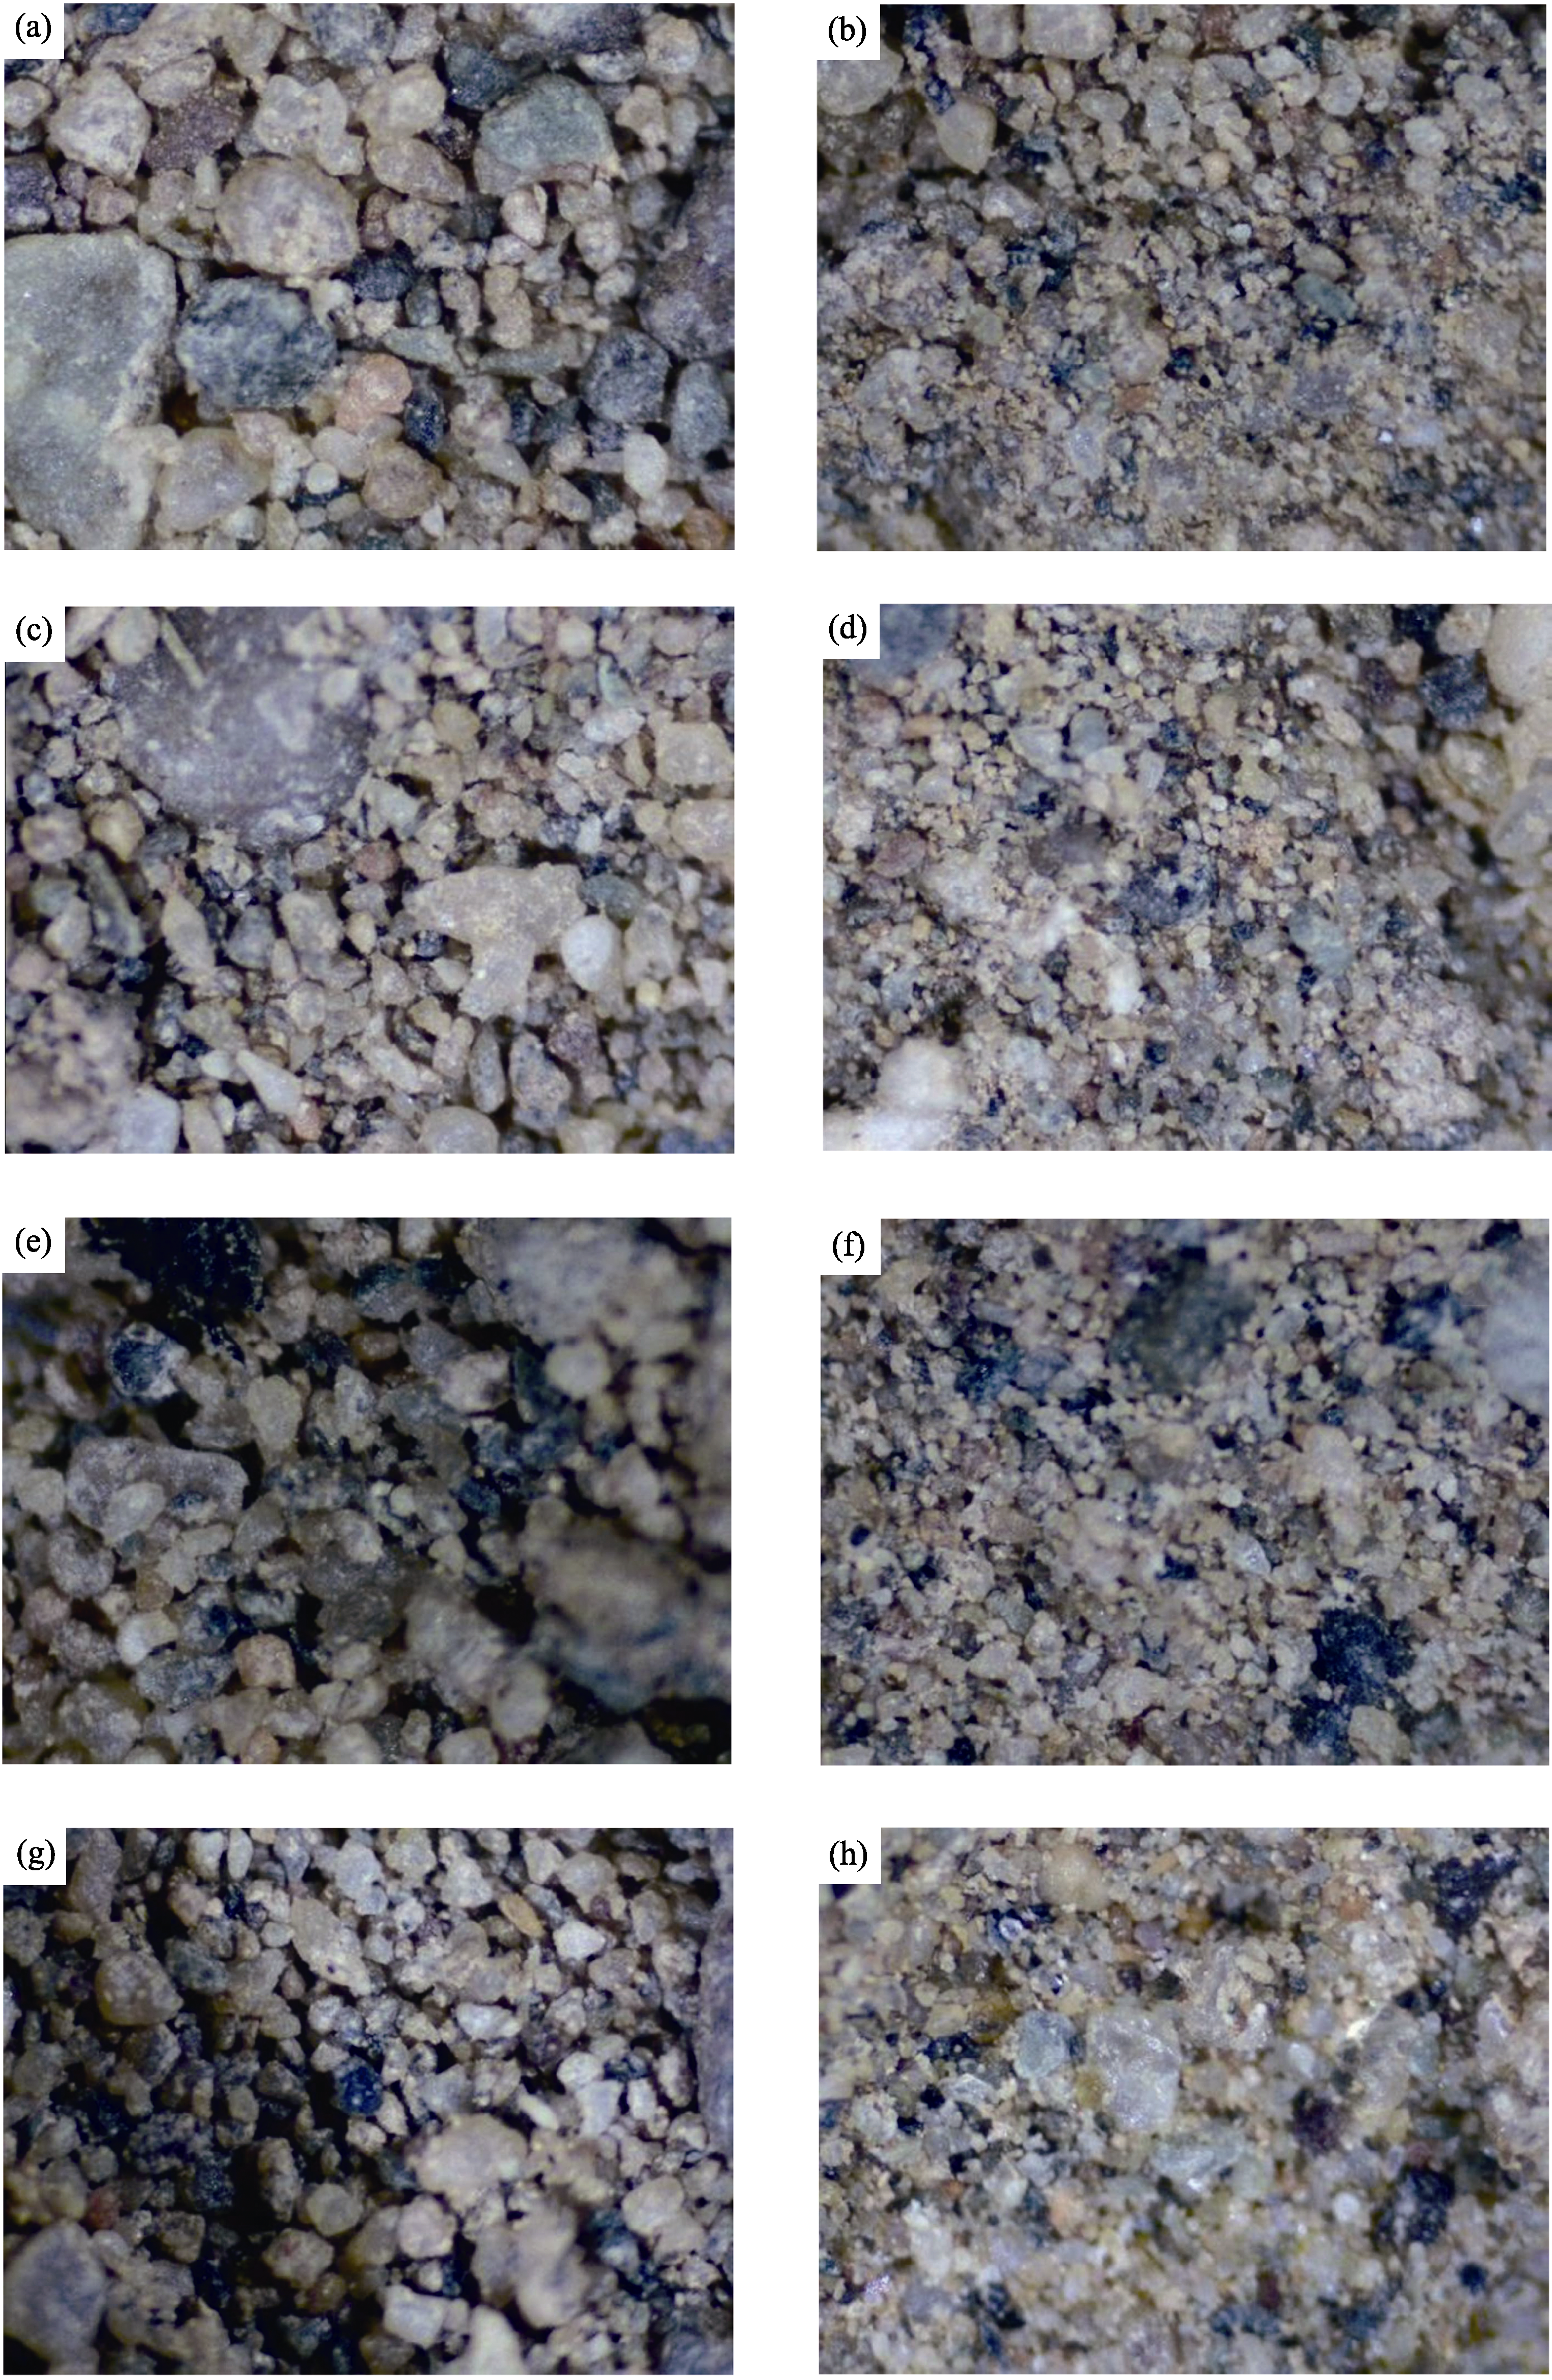
Figure 7
Images of the soil surface by stereomicroscopy: (a) 0% gravel coverage before a rainfall event; (b) 0% gravel coverage after a rainfall event; (c) 20% gravel coverage before a rainfall event; (d) 20% gravel coverage after a rainfall event; (e) 40% grave coverage before a rainfall event; (f) 40% gravel coverage after a rainfall event; (g) 60% gravel coverage before a rainfall event; and (h) 60% gravel coverage after a rainfall event
Figure 8
Changes in soil surface roughness (SSR) due to the rainfall event