×
模态框(Modal)标题
在这里添加一些文本
关闭
关闭
提交更改
取消
确定并提交
×
模态框(Modal)标题
×
期刊
文章
图表
检索
EN
中文
首页
关于期刊
期刊介绍
数据库收录
期刊荣誉
编委会
投稿指南
在线期刊
当期目录
优先出版
过刊浏览
推荐文章
专题
按栏目浏览
阅读排行
下载排行
引用排行
E-mail Alert
RSS
期刊订阅
广告合作
联系我们
EN
中文
图/表 详细信息
Polycentric urban development with state-led administrative division adjustment: A policy insight for urban spatial transformation
CHEN Youlin, YU Peiheng, WANG Lei, CHEN Yiyun, YUNG Hiu Kwan Esther
地理学报(英文版), 2023, 33(
12
): 2400-2424. DOI:
10.1007/s11442-023-2182-y
Year
Moran’s I
Z-score
P-value
Year
Moran’s I
Z-score
P-value
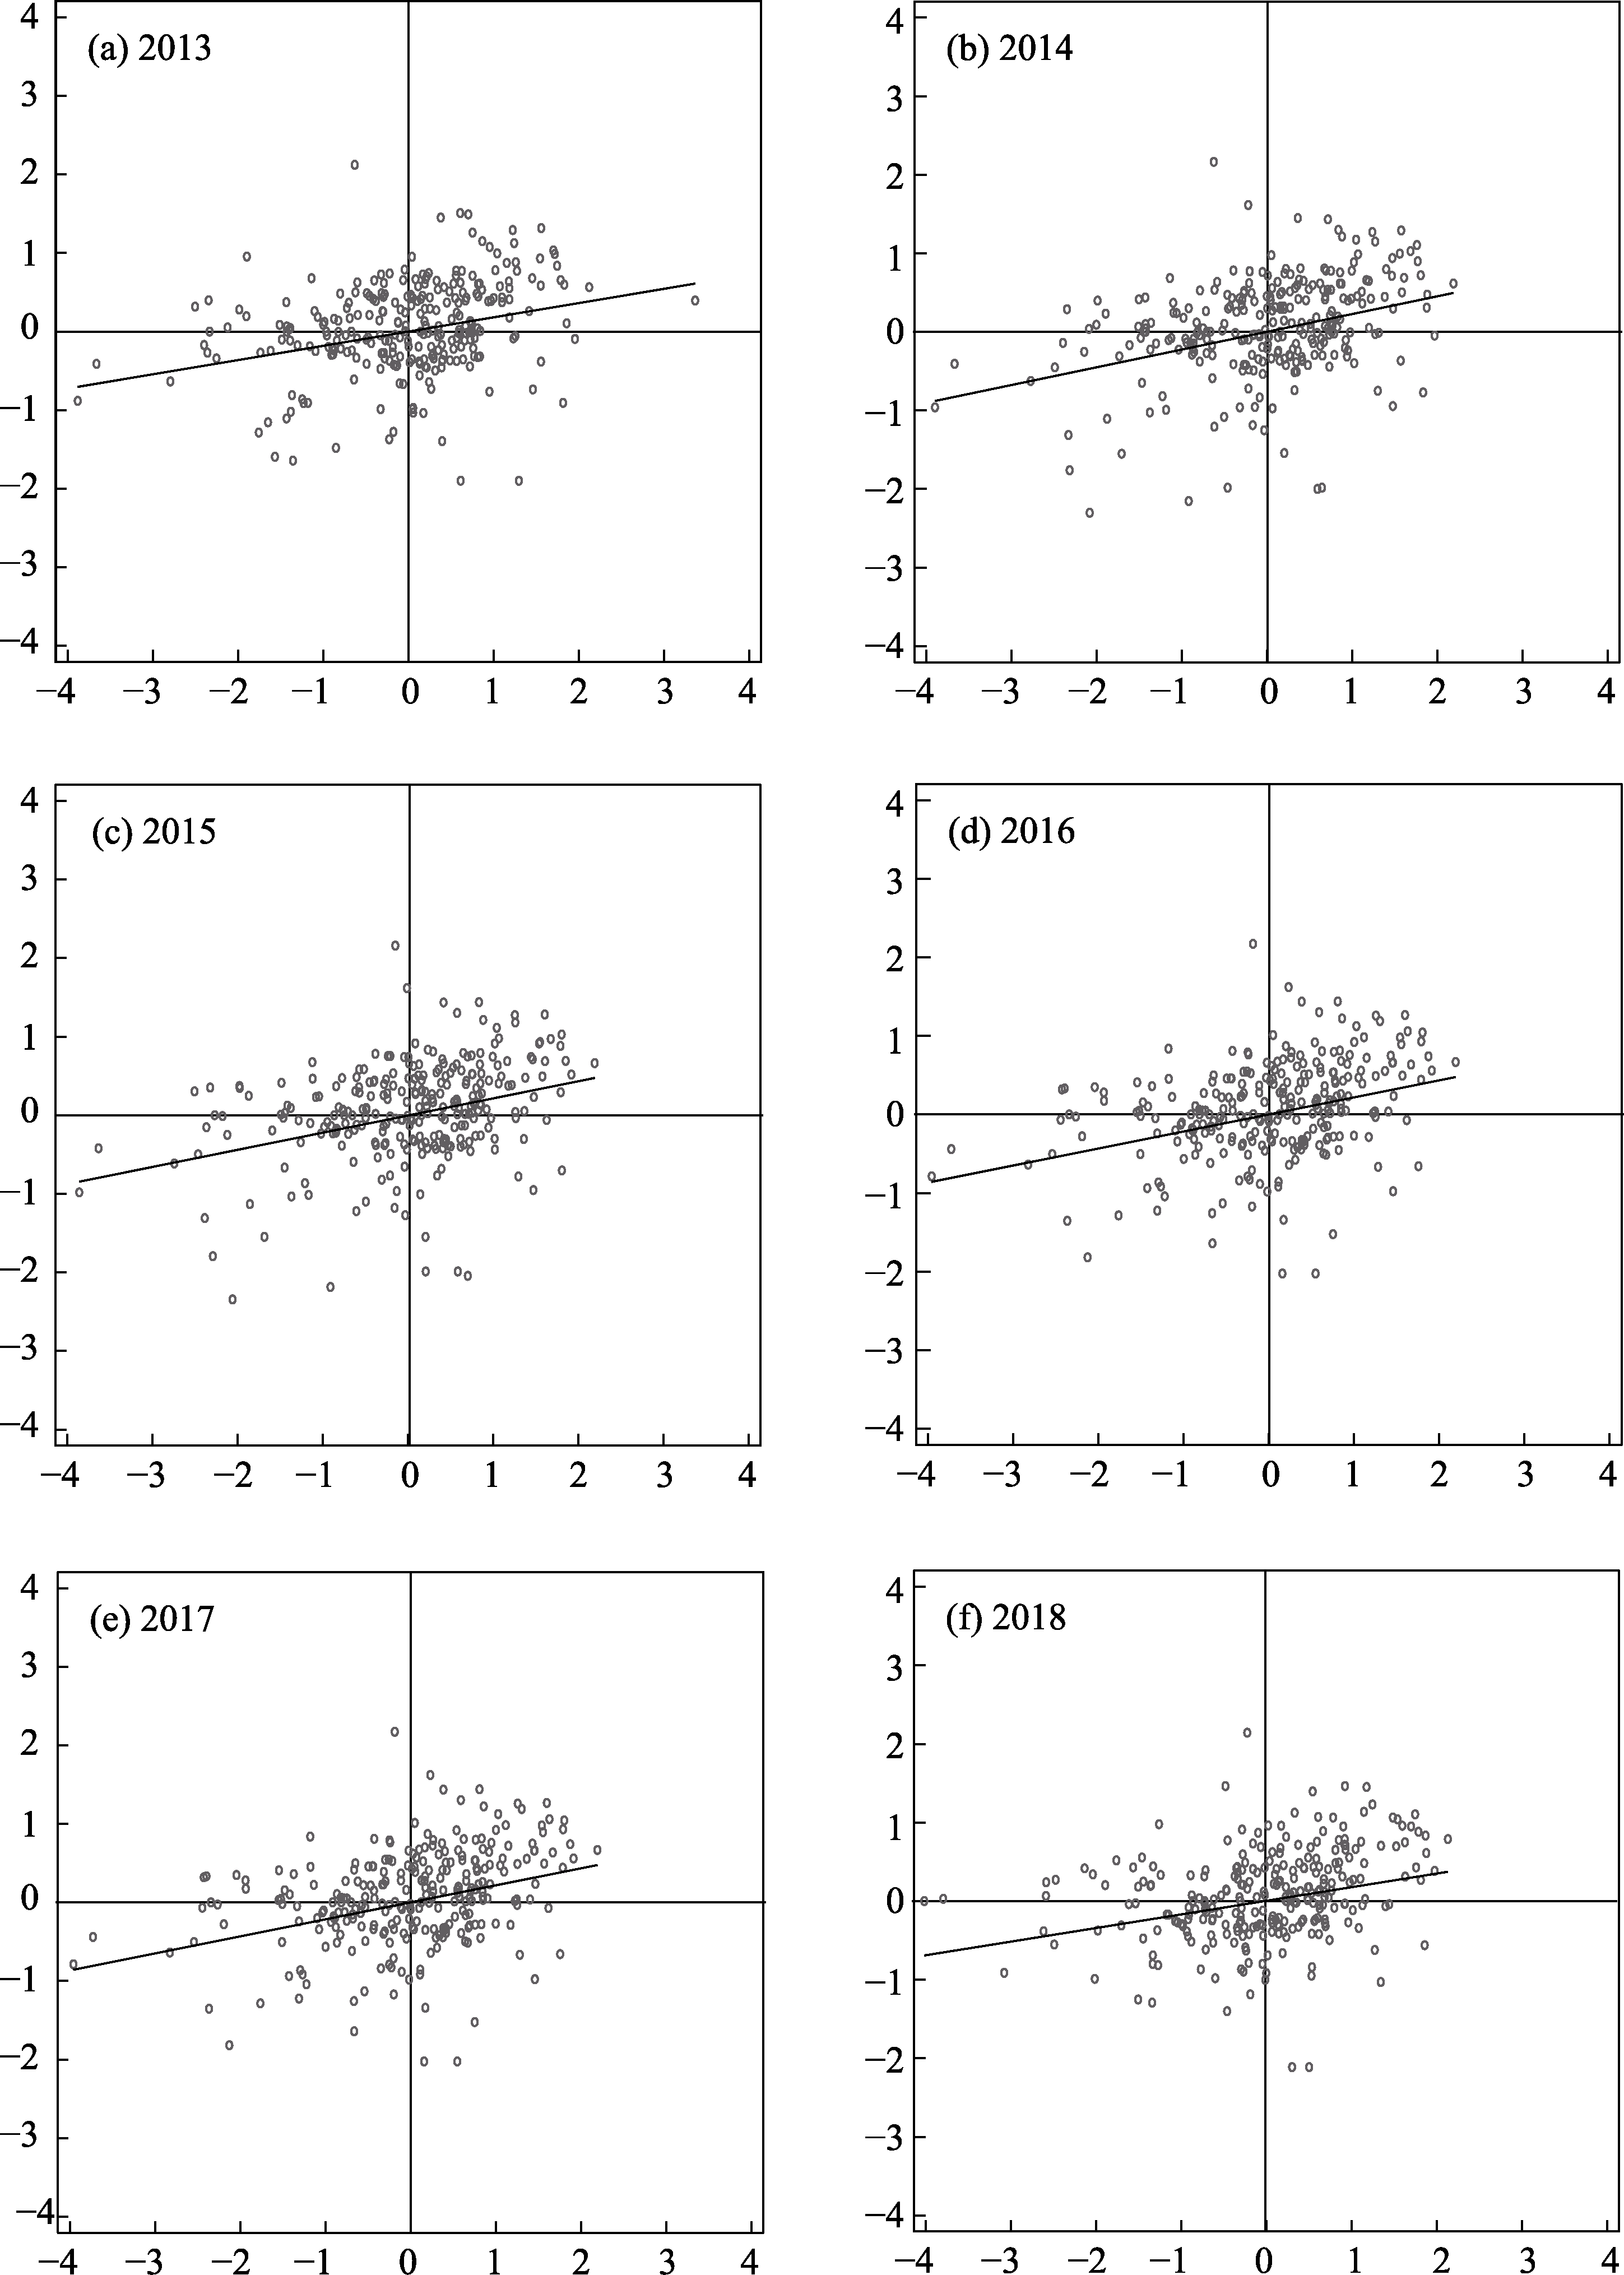
2013
0.1853
4.5504
0.001***
2014
0.2306
5.7033
0.001***
2015
0.2233
5.5953
0.001***
2016
0.2229
5.5471
0.001***
2017
0.1831
4.6207
0.001***
2018
0.1822
4.5747
0.001***
Table 2
The global Moran’s I index of polycentric urban structure
本文的其它图/表
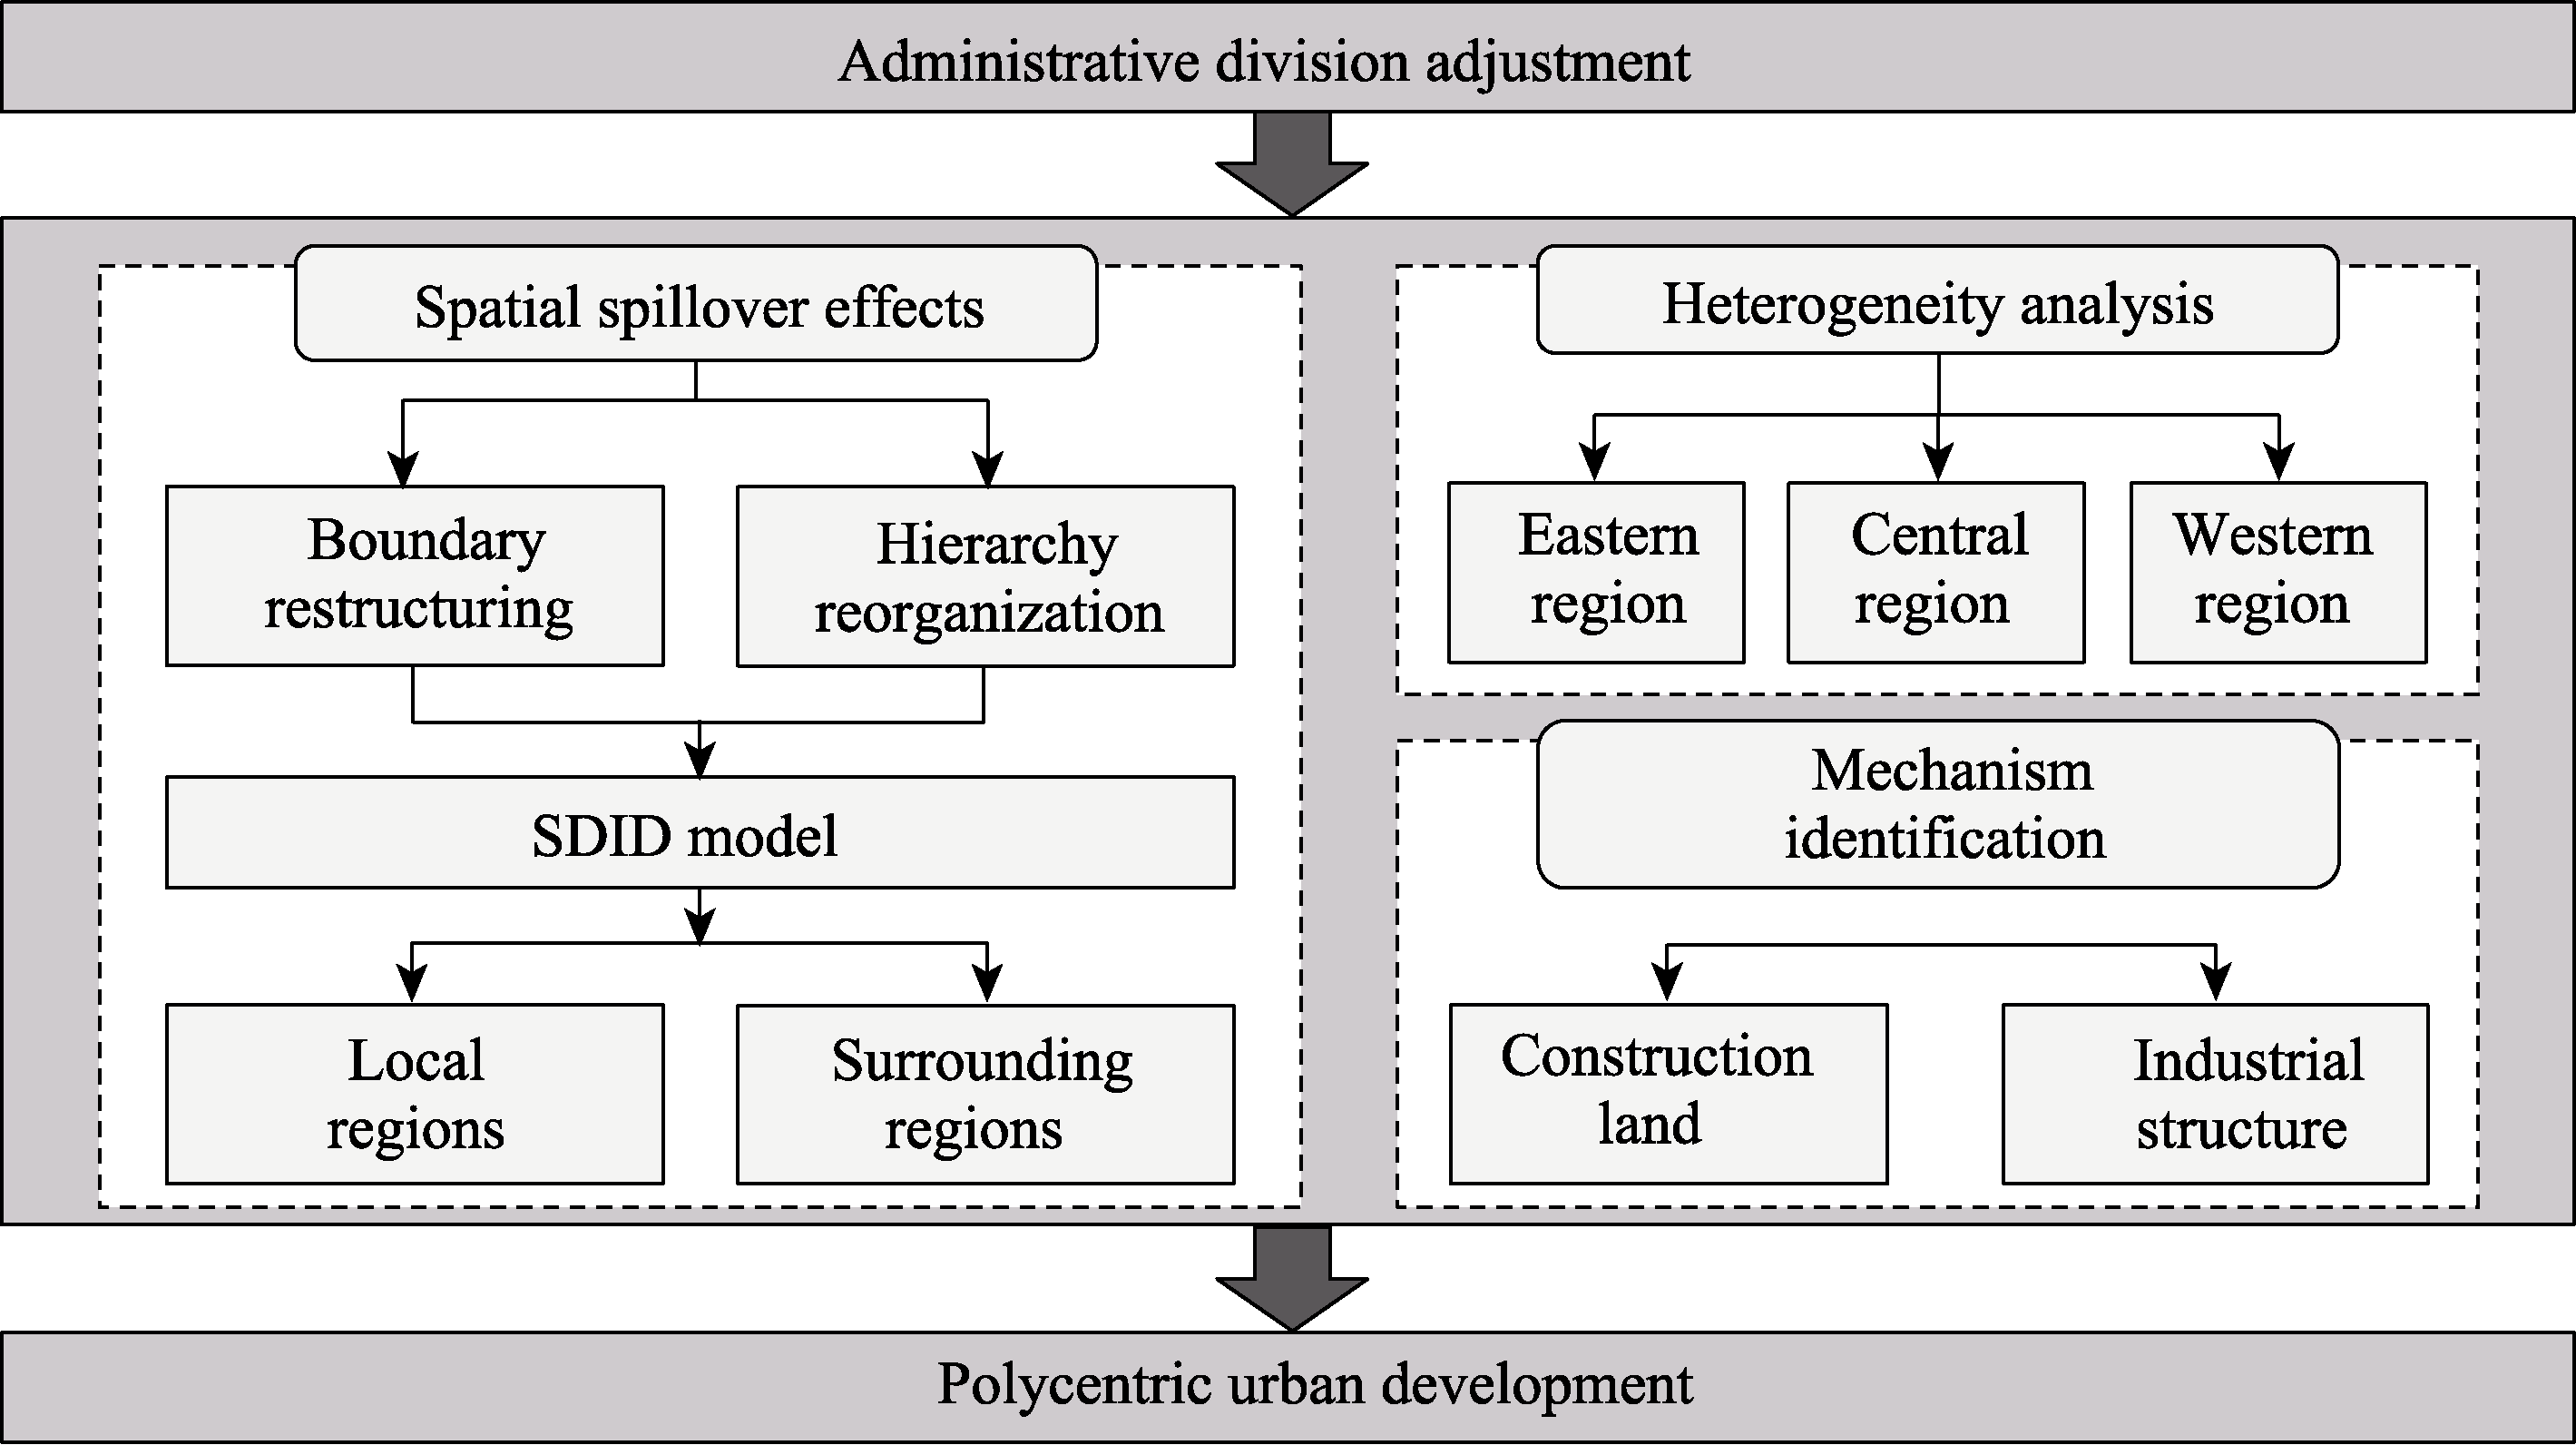
Figure 1
Conceptual framework of polycentric urban development with administrative division adjustment
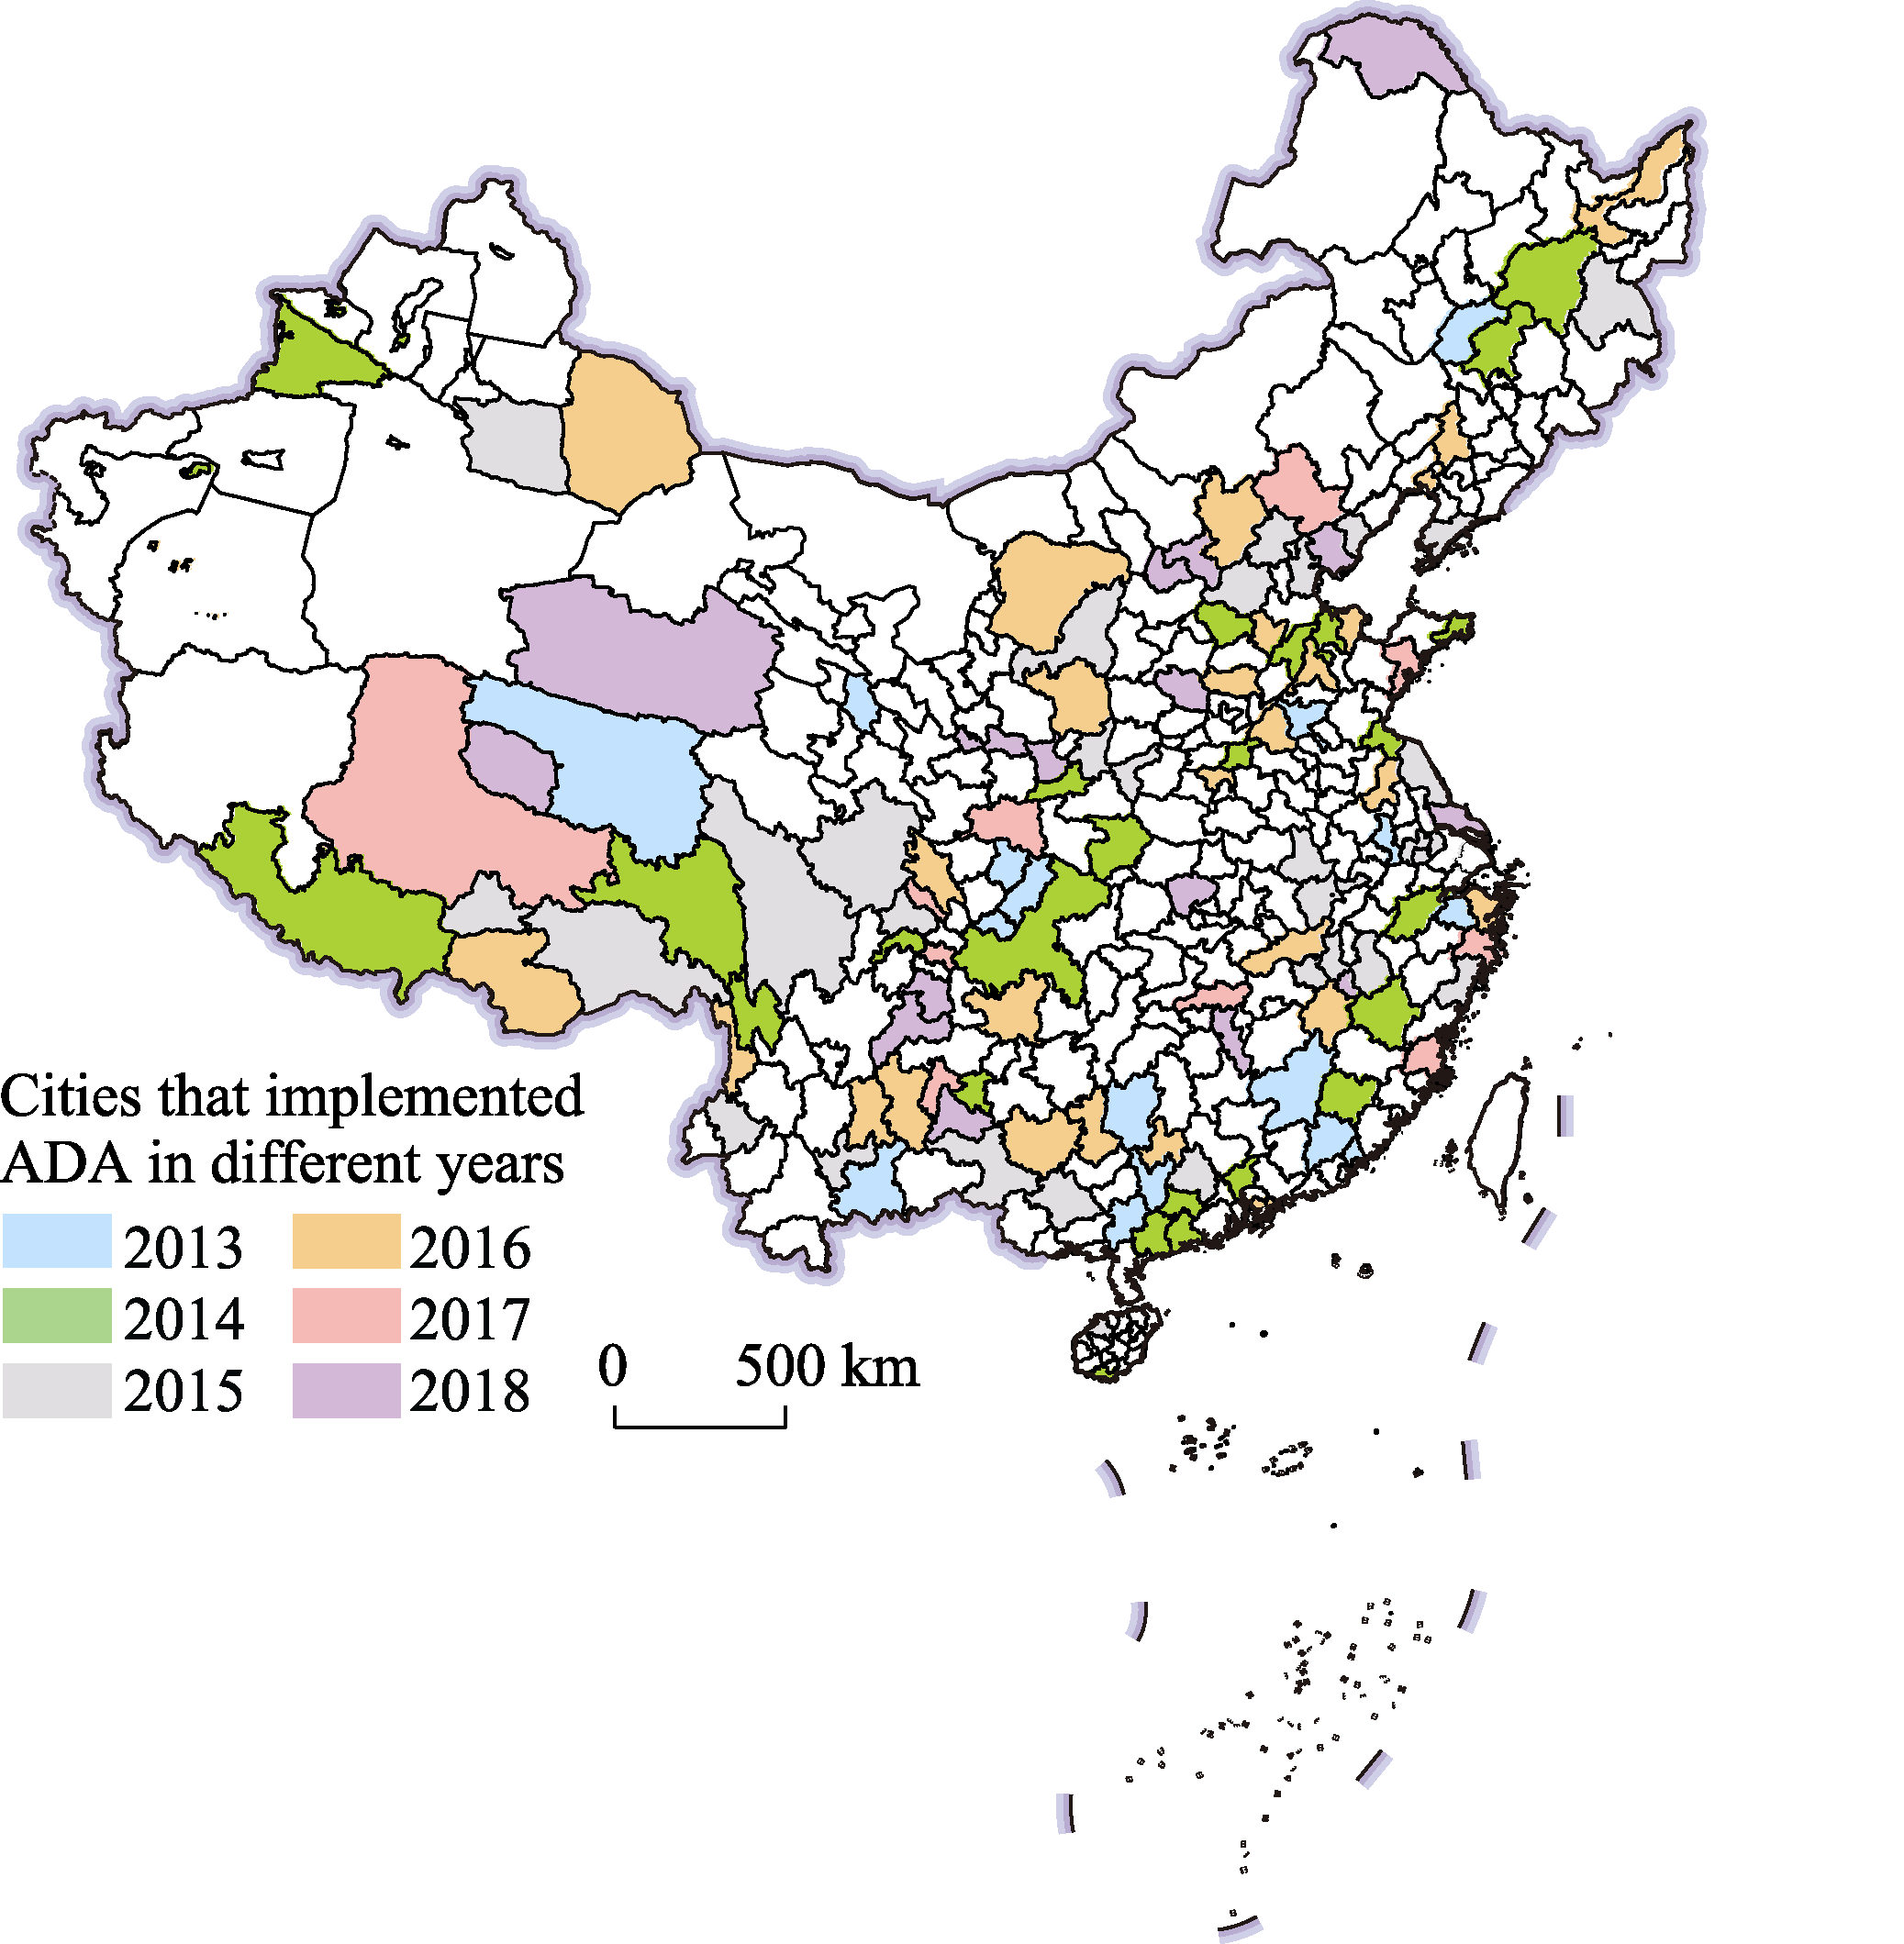
Figure 2
The geographic location of cities that implemented administrative division adjustment between 2013 and 2018
Note: This map is based on the standard map with approval number GS(2020)4619 downloaded from the standard map service website of the National Bureau of Surveying, Mapping, and Geographic Information, and the base map has not been modified.
Table 1
Definition and statistical description of the variables
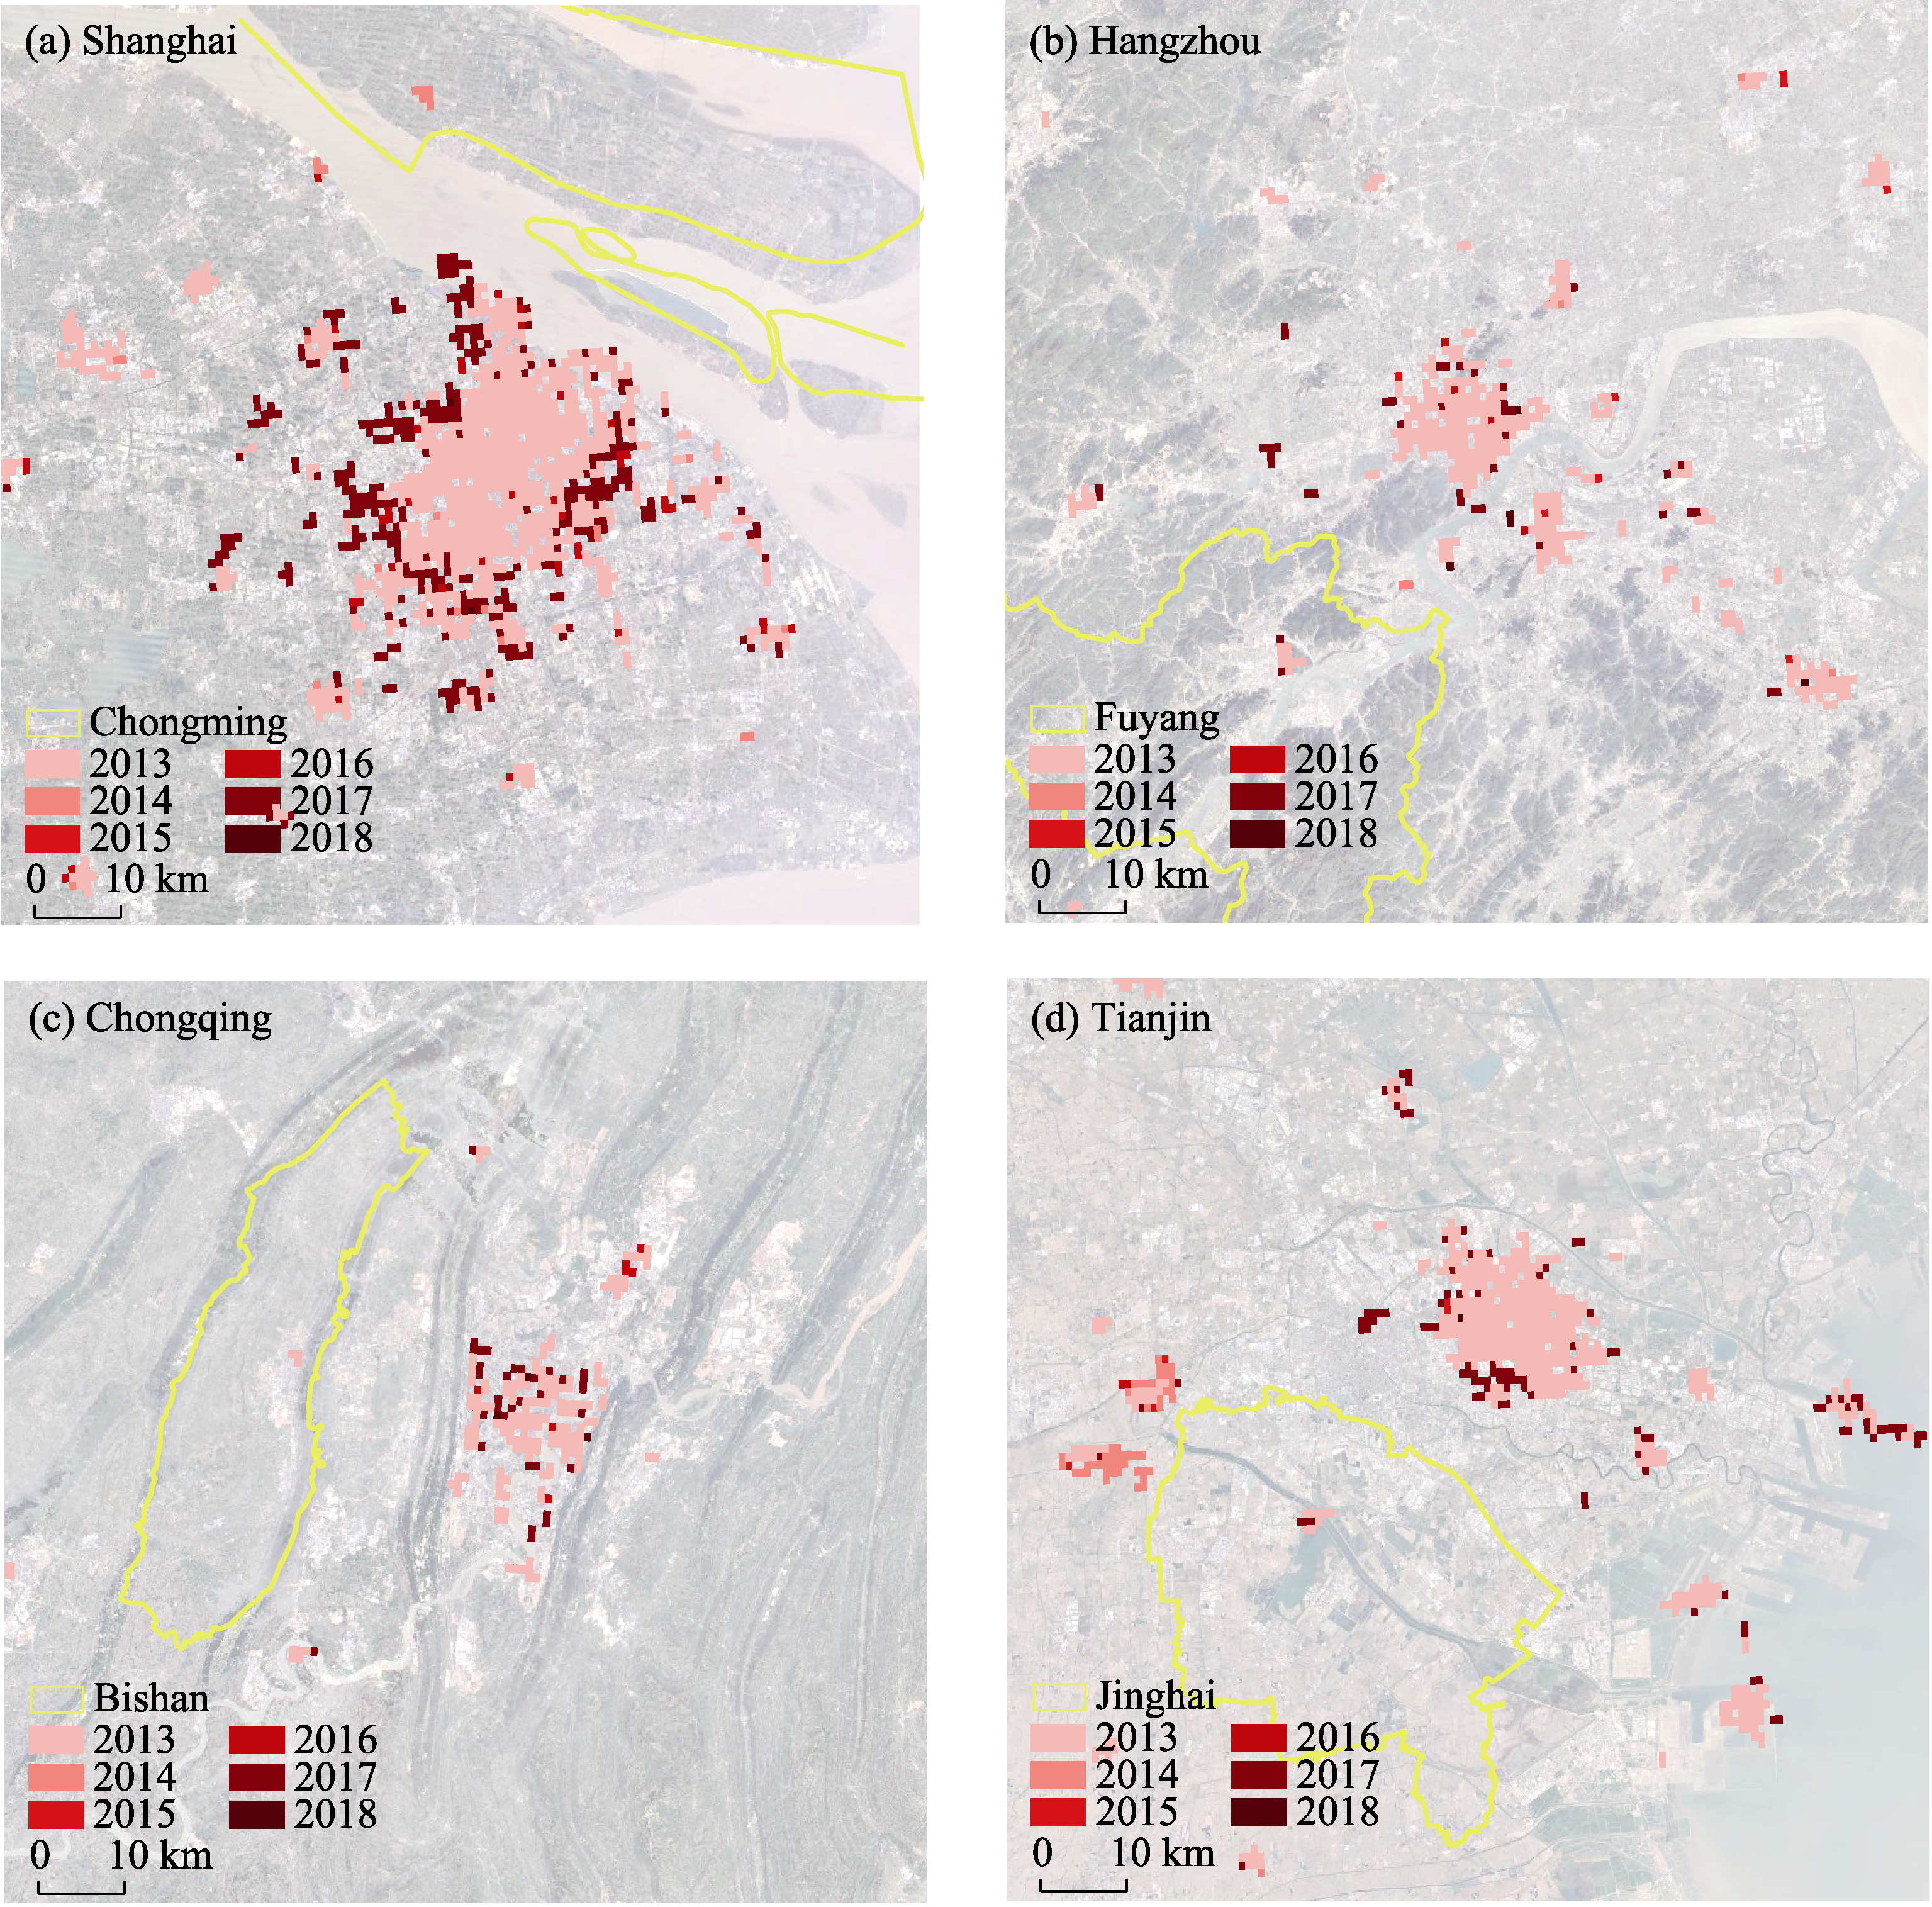
Figure 3
Regions with administrative division adjustment and population centers of four cities in China from 2013 to 2018. (a) Shanghai, (b) Hangzhou, (c) Chongqing and (d) Tianjin
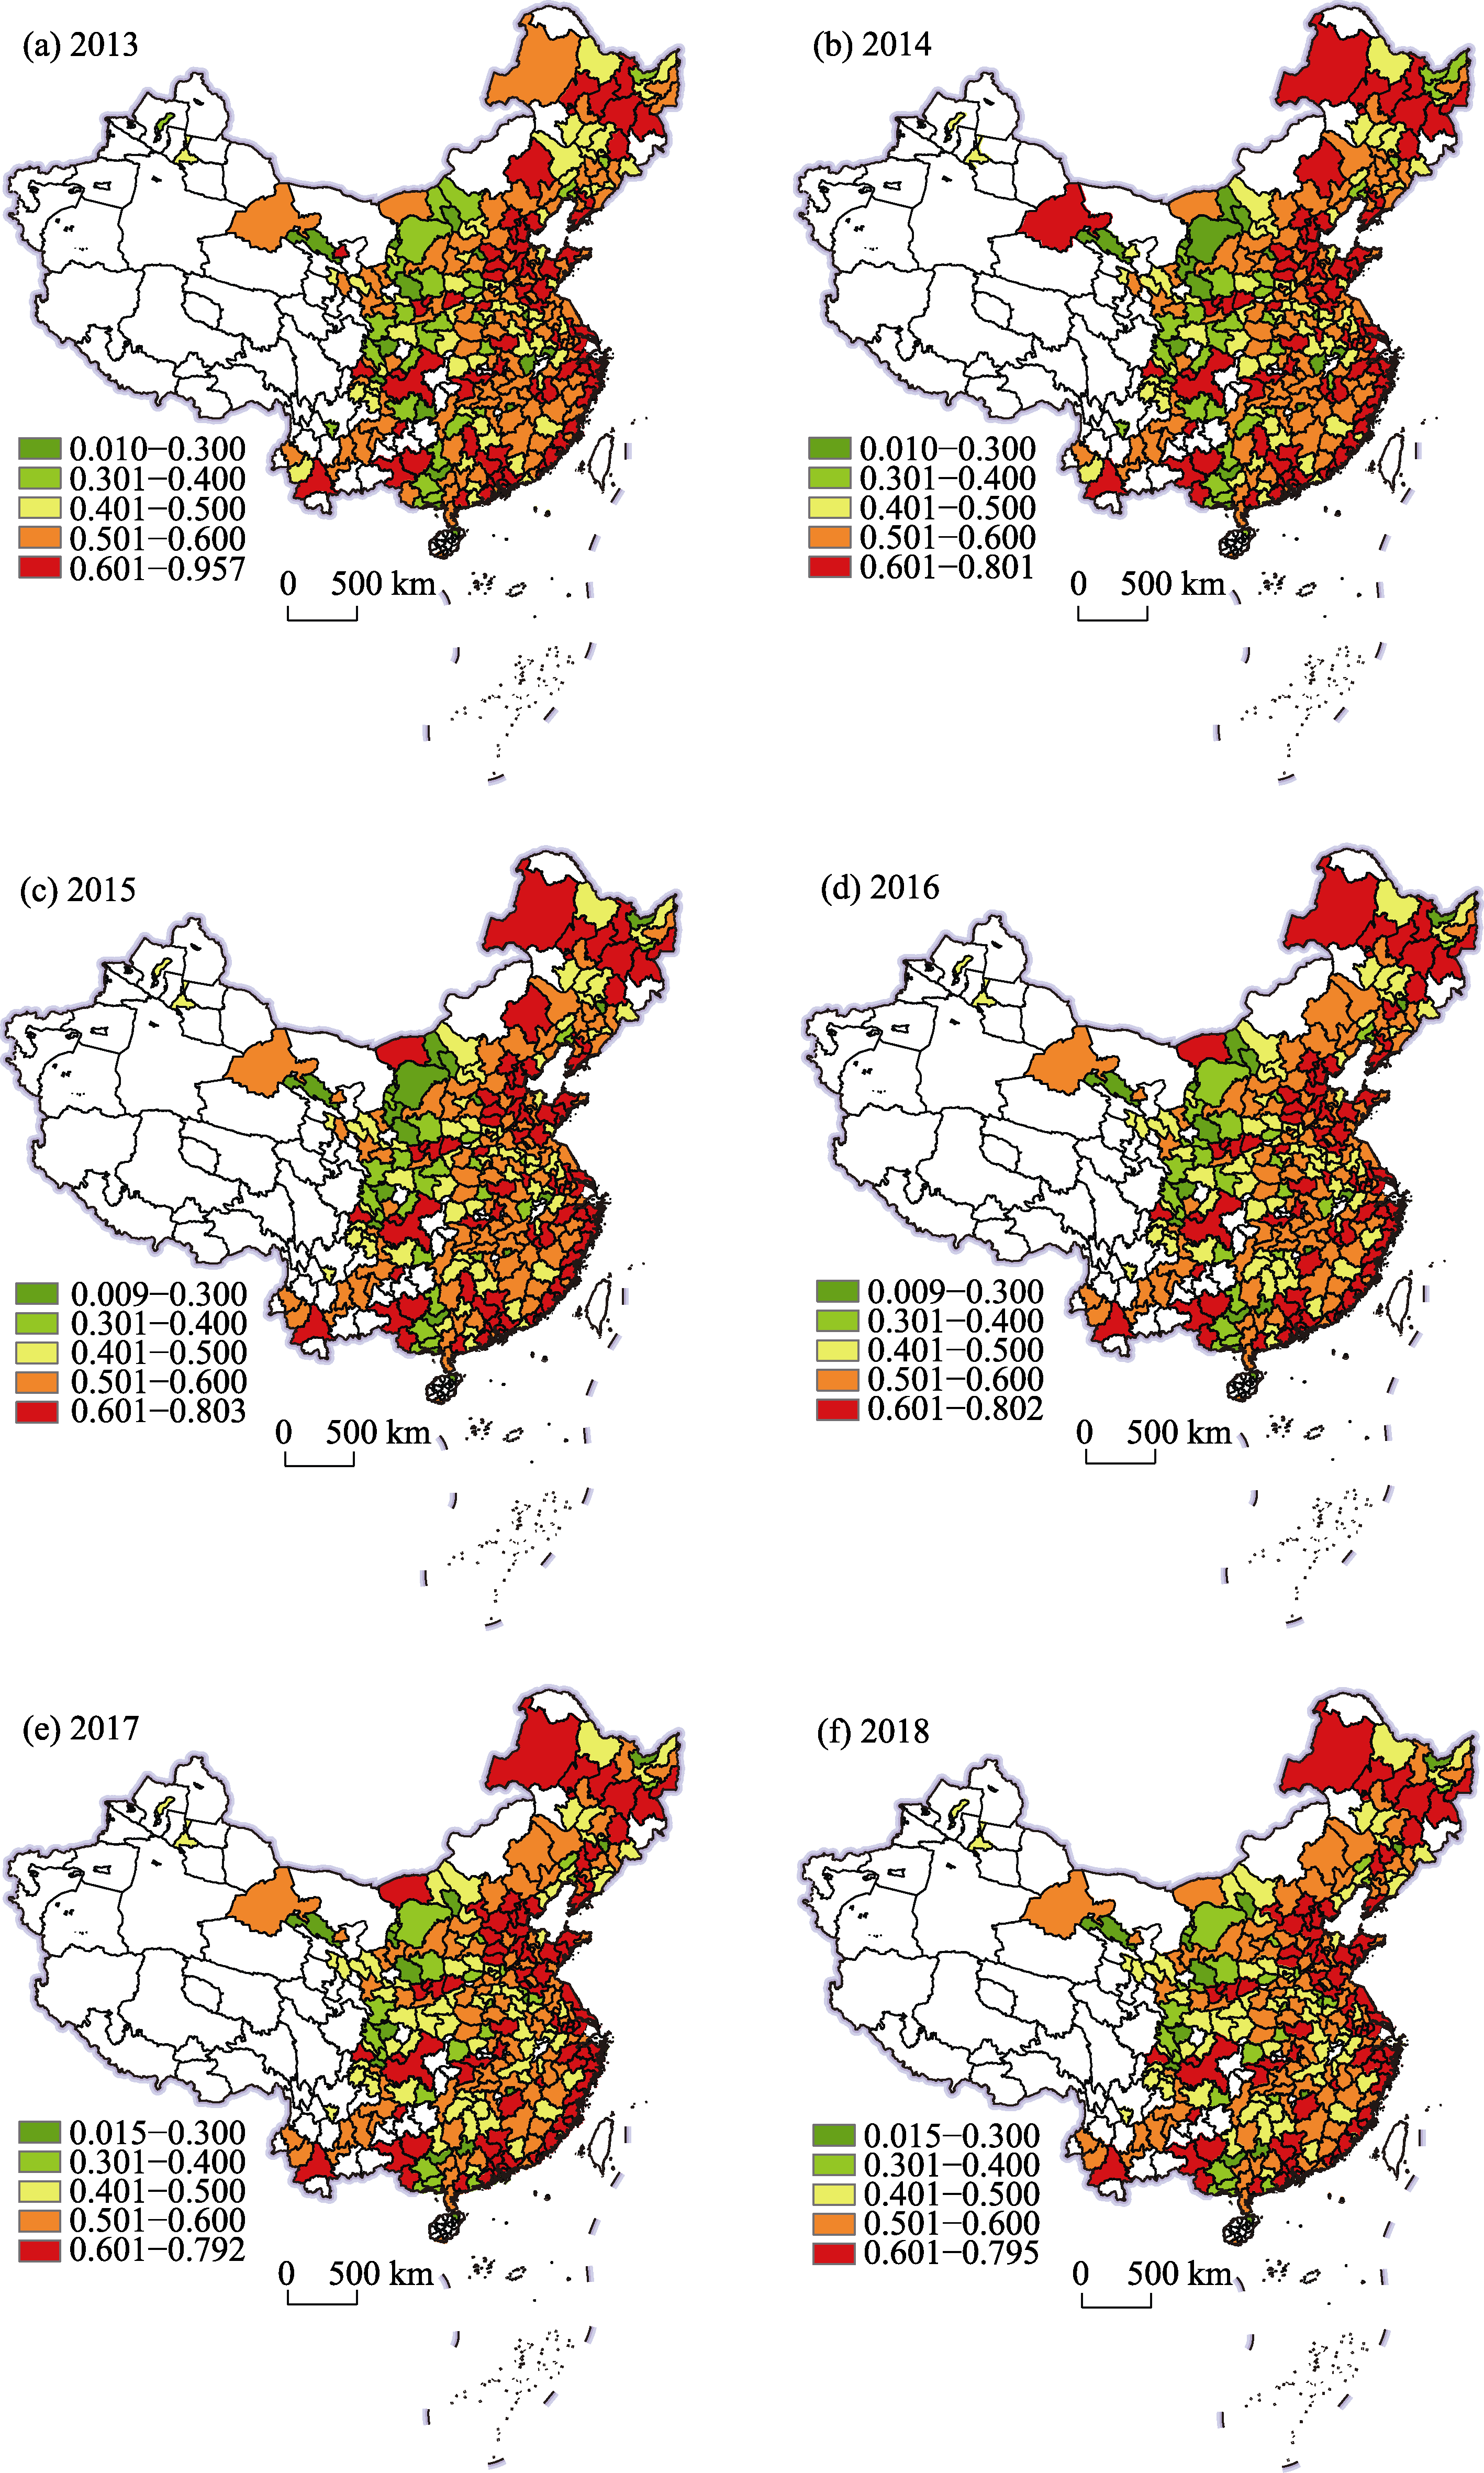
Figure 4
The spatiotemporal evolution of urban polycentricity in China in different years: (a) 2013, (b) 2014, (c) 2015, (d) 2016, (e) 2017 and (f) 2018
Note: This map is based on the standard map with approval number GS(2020)4619 downloaded from the standard map service website of the National Bureau of Surveying, Mapping, and Geographic Information, and the base map has not been modified.
Figure 5
The scatter plots of global Moran’s I index in different years: (a) 2013, (b) 2014, (c) 2015, (d) 2016, (e) 2017 and (f) 2018
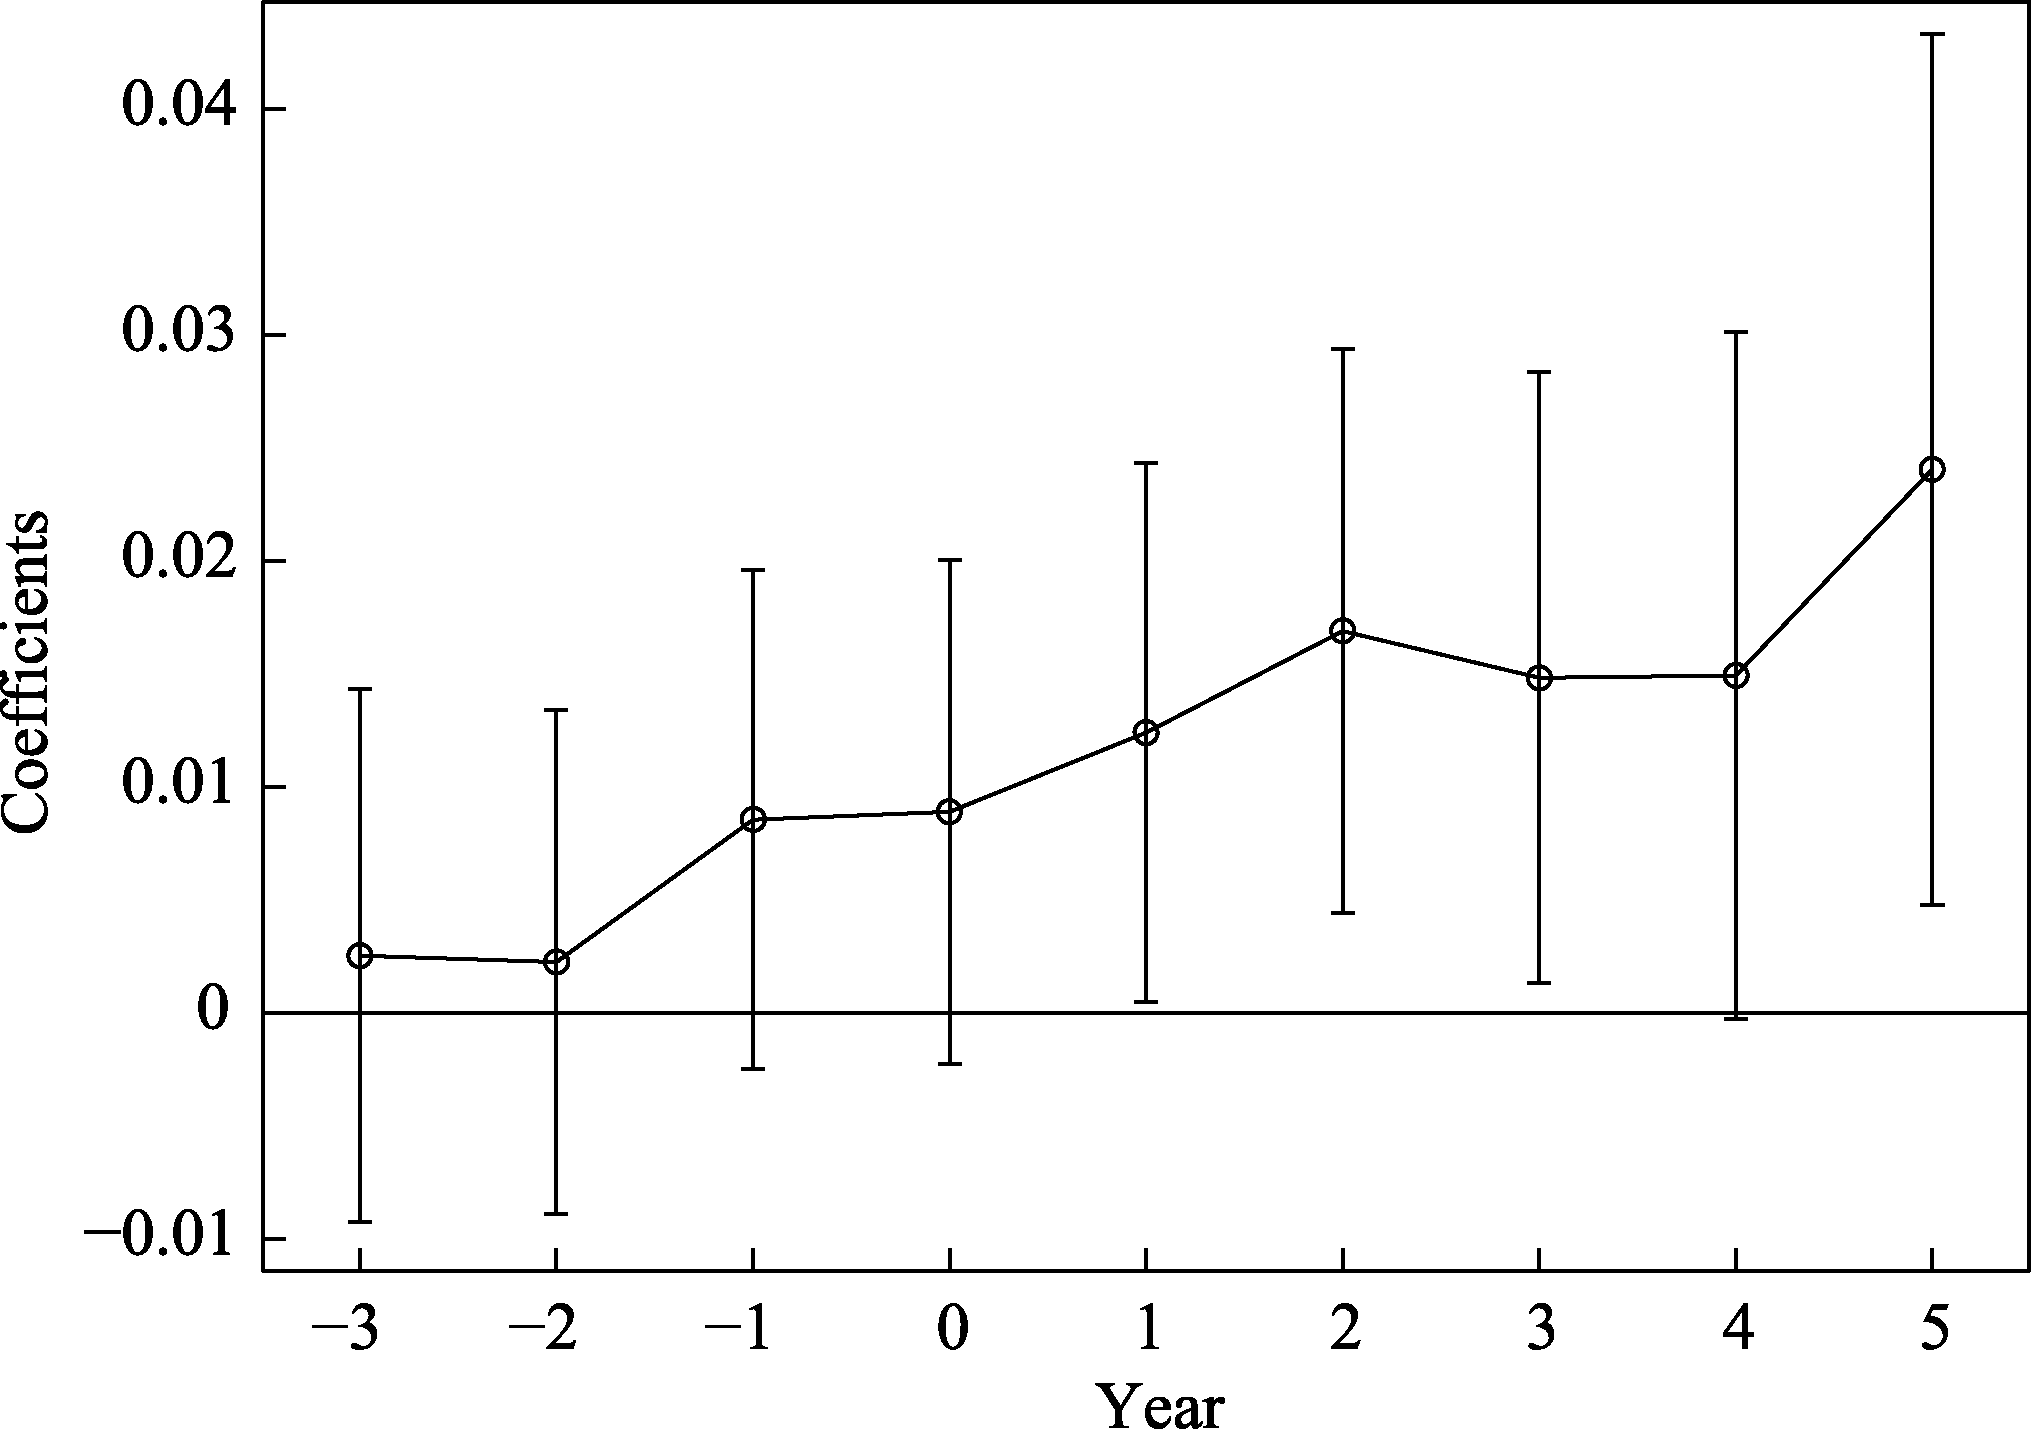
Figure 6
The parallel trend test results of the SDID model
Table 3
The selection test of the SDID model
Table 4
Benchmark regression results of the OLS and SDID models
Table 5
The direct, indirect and total effects of SDID model in columns (4), (5) and (6) of
Table 4
Table 6
The heterogeneity analysis of administrative division adjustment on urban polycentricity
Table 7
The mechanism analysis of administrative division adjustment on urban polycentricity
Table 8
The robustness test of administrative division adjustment on urban polycentricity
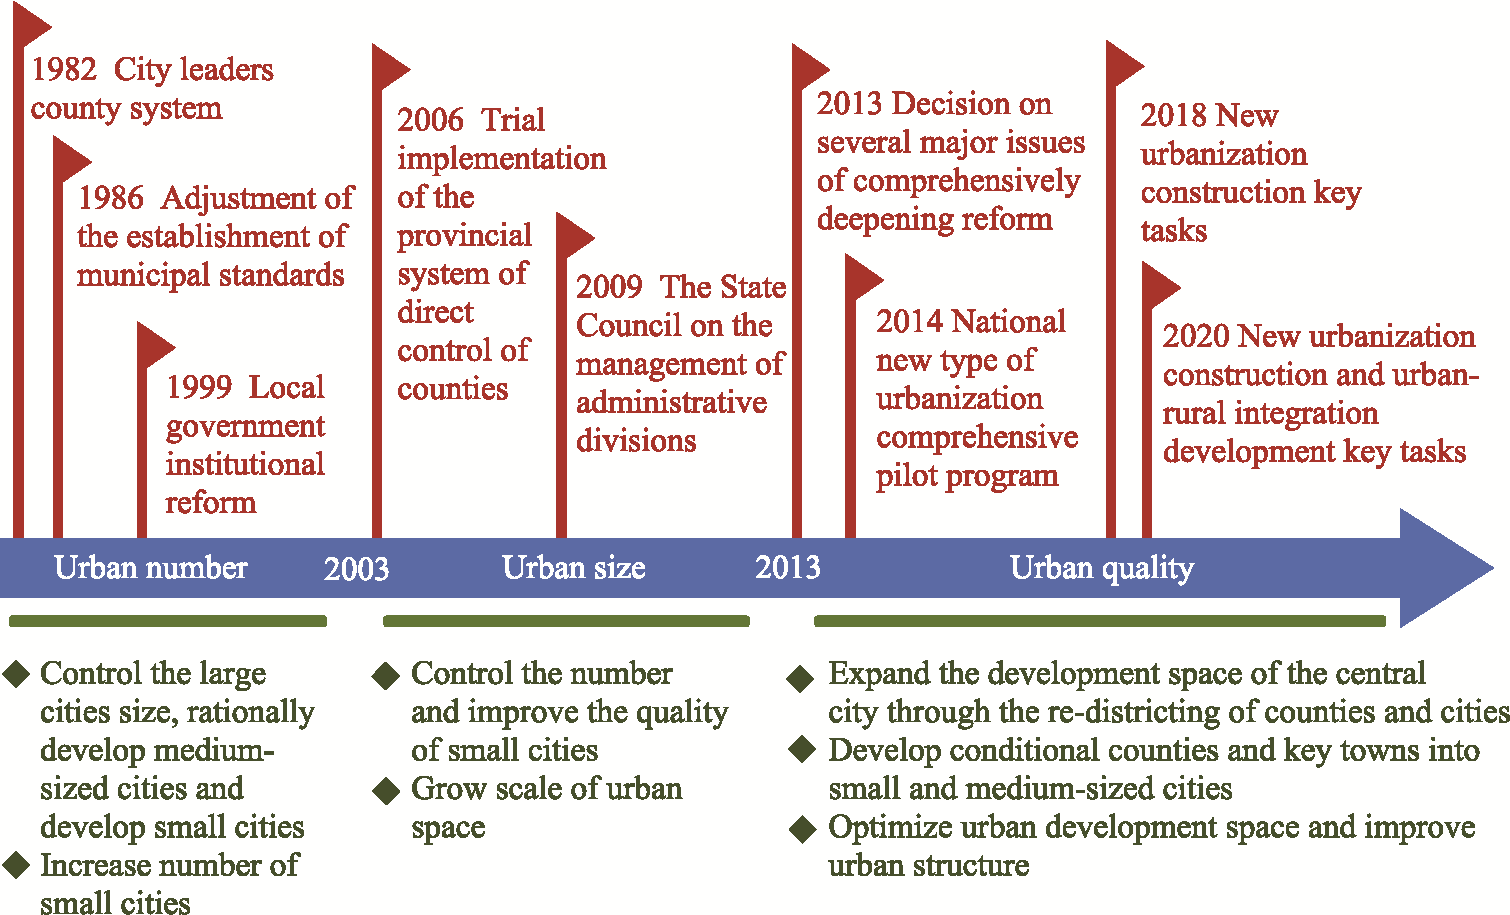
Figure 7
Policy related to administrative division adjustment and urbanization