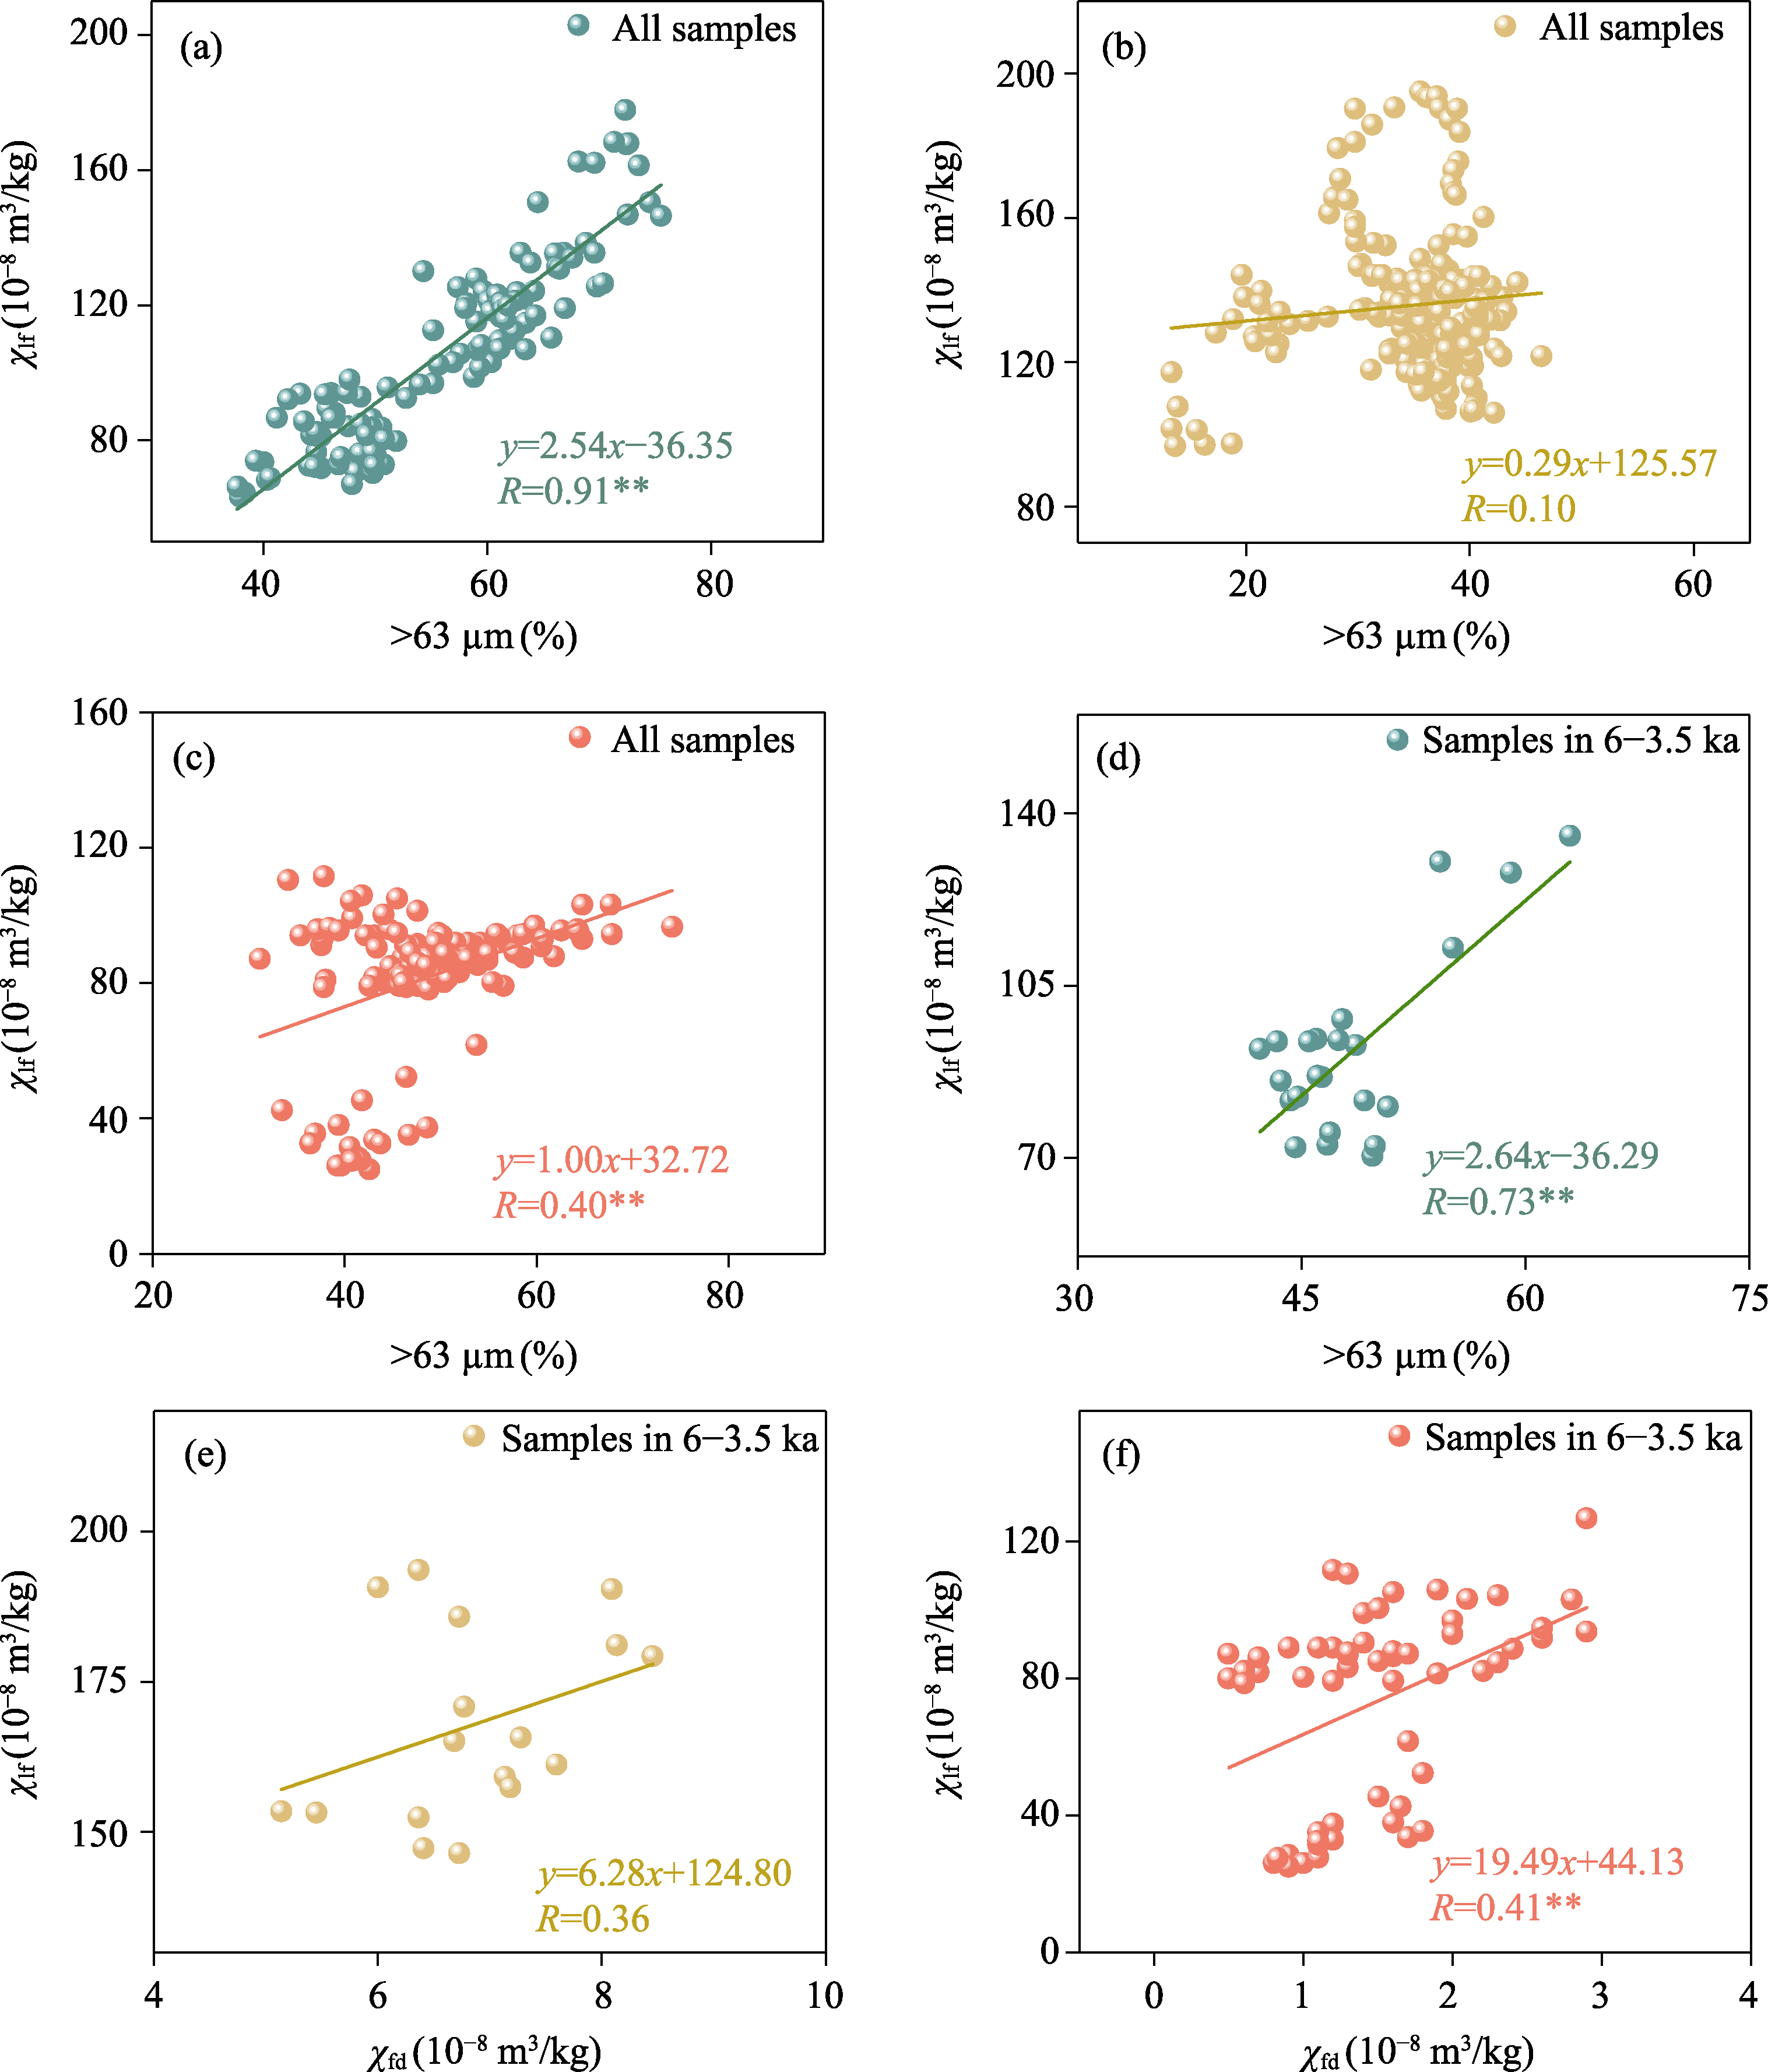
Figure 1 Geographical and climatic context of the study area. (a) Locations of the investigated sections (SGX, HZ, MR sections, green pluses) and referenced aeolian sections from the Ili basin (green dots), Chinese Loess Plateau (blue dots), and desert peripheries (orange dots). Major atmospheric circulation systems are also shown: Indian summer monsoon (ISM), mid-latitude westerlies (MLW), East Asian summer monsoon (EASM), and East Asian winter monsoon (EAWM). (b-d) Mean monthly temperature and precipitation data for the three investigated sections, sourced from WorldClim (
Figure 3 Magnetic properties of representative samples (SGX-50, HZ-300, and MR-240) from the SGX, HZ, and MR sections. (a-c) Temperature-dependent magnetic susceptibility curves. Heating, cooling, and first- derivative heating curves are shown in magenta, blue, and grey, respectively. (d-f) Hysteresis loops. Red curves are corrected for the paramagnetic component; cyan curves represent uncorrected data. (g-i) FORC diagrams.
Figure 5 Correlation plots of magnetic parameters for the SGX, HZ, and MR sections. (a) Correlation between χlf and SIRM across the SGX, HZ, and MR sections. (b) Correlation between χlf and χfd, and (c) between χlf and χARM in the paleosol and other layers of the HZ section. (d) Correlation between χlf and χfd, and (e) between χlf and χARM in paleosol I and paleosol II of the MR section. (f) Correlation between χlf and χfd in the other layers of the MR section. All panels include correlation coefficients (R2), regression equations, and significance levels (p-values). Solid lines represent linear regressions.
Figure 6 Composite lithostratigraphic and multiproxy records for the SGX, HZ, and MR sections, plotted on a common age scale. The cyan bar corresponds to the 6.0-3.5 ka interval. (a) Variations in magnetic parameters and the >63 μm fraction of the SGX section. (b) Variations in magnetic parameters, element ratios, and the >63 µm fraction of the HZ section. (c) Records of magnetic parameters and >63 µm fraction of the MR section, along with the stalagmite δ18O record from Dongge Cave as a proxy for reflecting ISM intensity (Wang et al.,
Figure S1 Lithology and geomorphological context of the study sections. (a-c) Lithologies of the (A) SGX, (b) HZ, and (c) MR sections in the Yarlung Zangbo River basin on the southern Tibetan Plateau, showing the optically stimulated luminescence (OSL) sampling locations (cyan dots) and their corresponding ages (Yang et al.,
Figure S2 Additional temperature-dependent magnetic susceptibility curves for samples from the (a) SGX, (b-d) HZ, and (e-i) MR sections. These data supplement the representative samples in
Figure S6 Magnetic grain size characteristics of aeolian deposits from the SGX, HZ, and MR sections. (a) Dearing plots of magnetic parameters for all samples from the SGX, HZ, and MR sections, showing the distribution of magnetic grain sizes and domain states. The fields for multi-domain (MD), stable single domain (SSD), pseudo-single-domain (PSD), and superparamagnetic (SP) grains are shown for reference. (b) Enlargement of the area outlined by the rectangle in (a).
Figure S9 Variations of representative aeolian sections and climatic indices from (a-d) the Ili basin and (e-g) Yarlung Zangbo River basin on the southern Tibetan Plateau of mountain-basin system. a: ZKT section (Jia et al.,
Figure S10 Variations of representative aeolian sections and climatic indices from (a-f) the Chinese Loess Plateau and (g-i) desert periphery of non-mountain-basin system. a: YC section (Liu et al.,