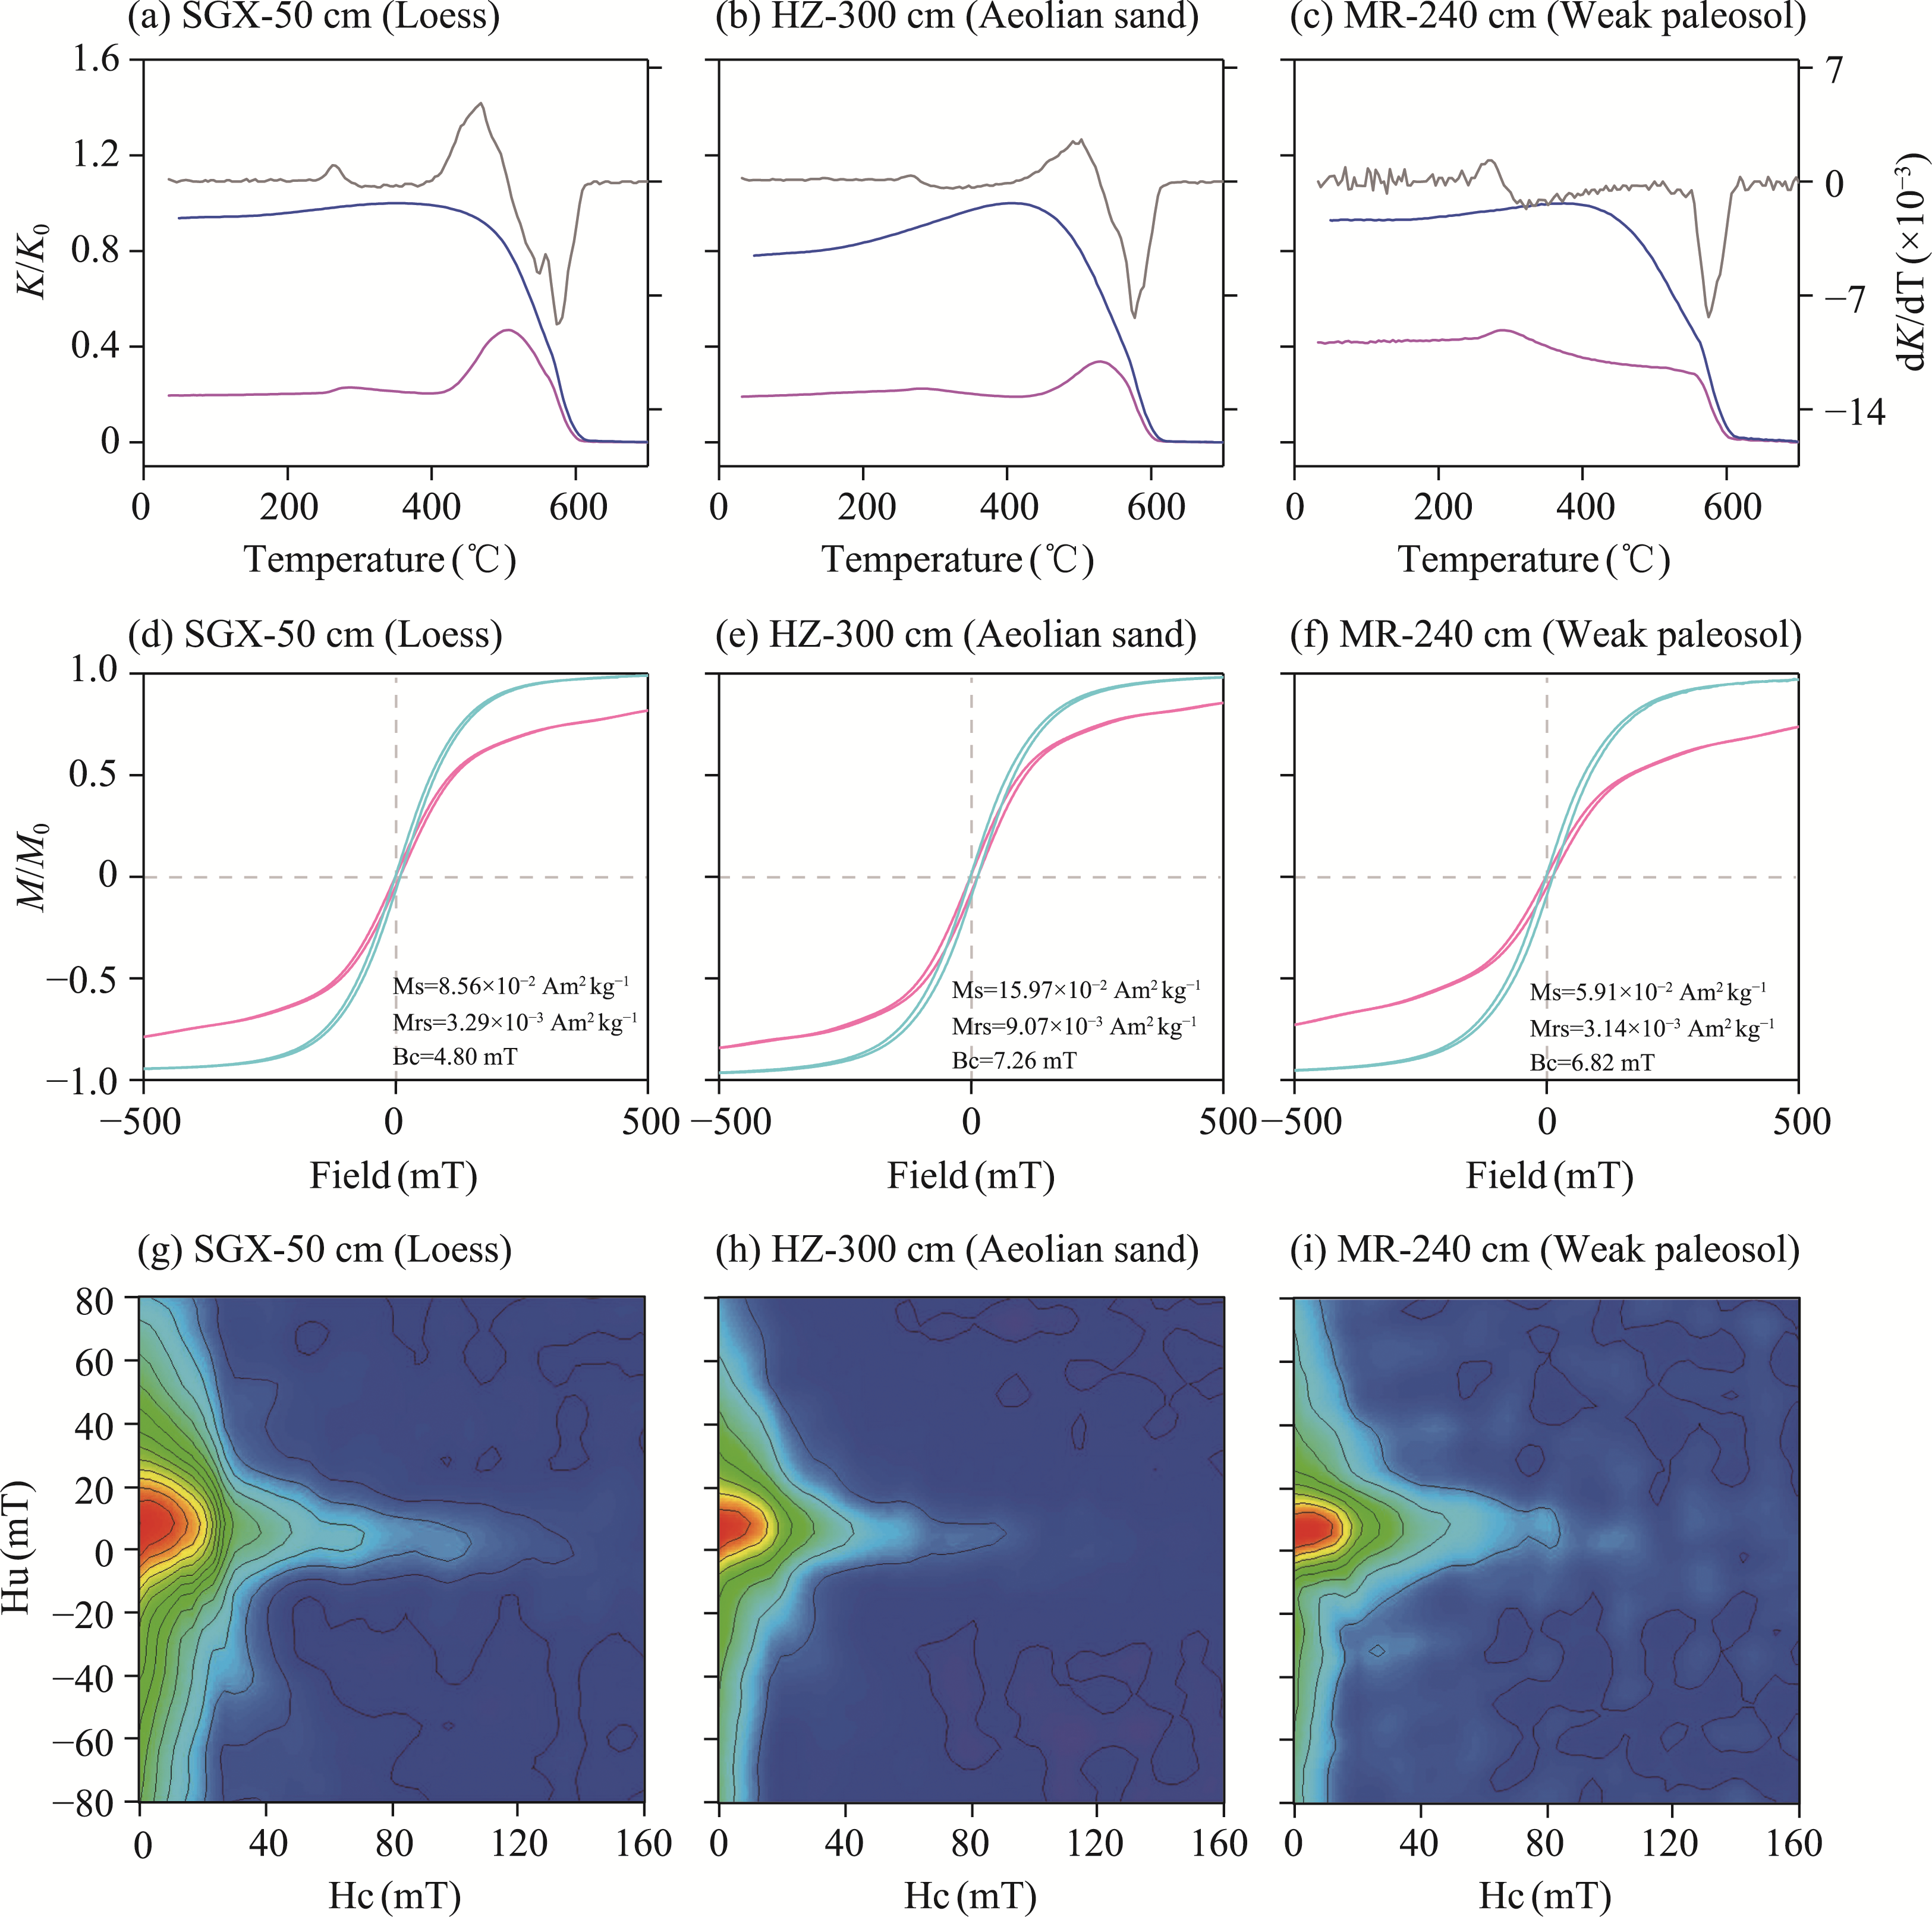
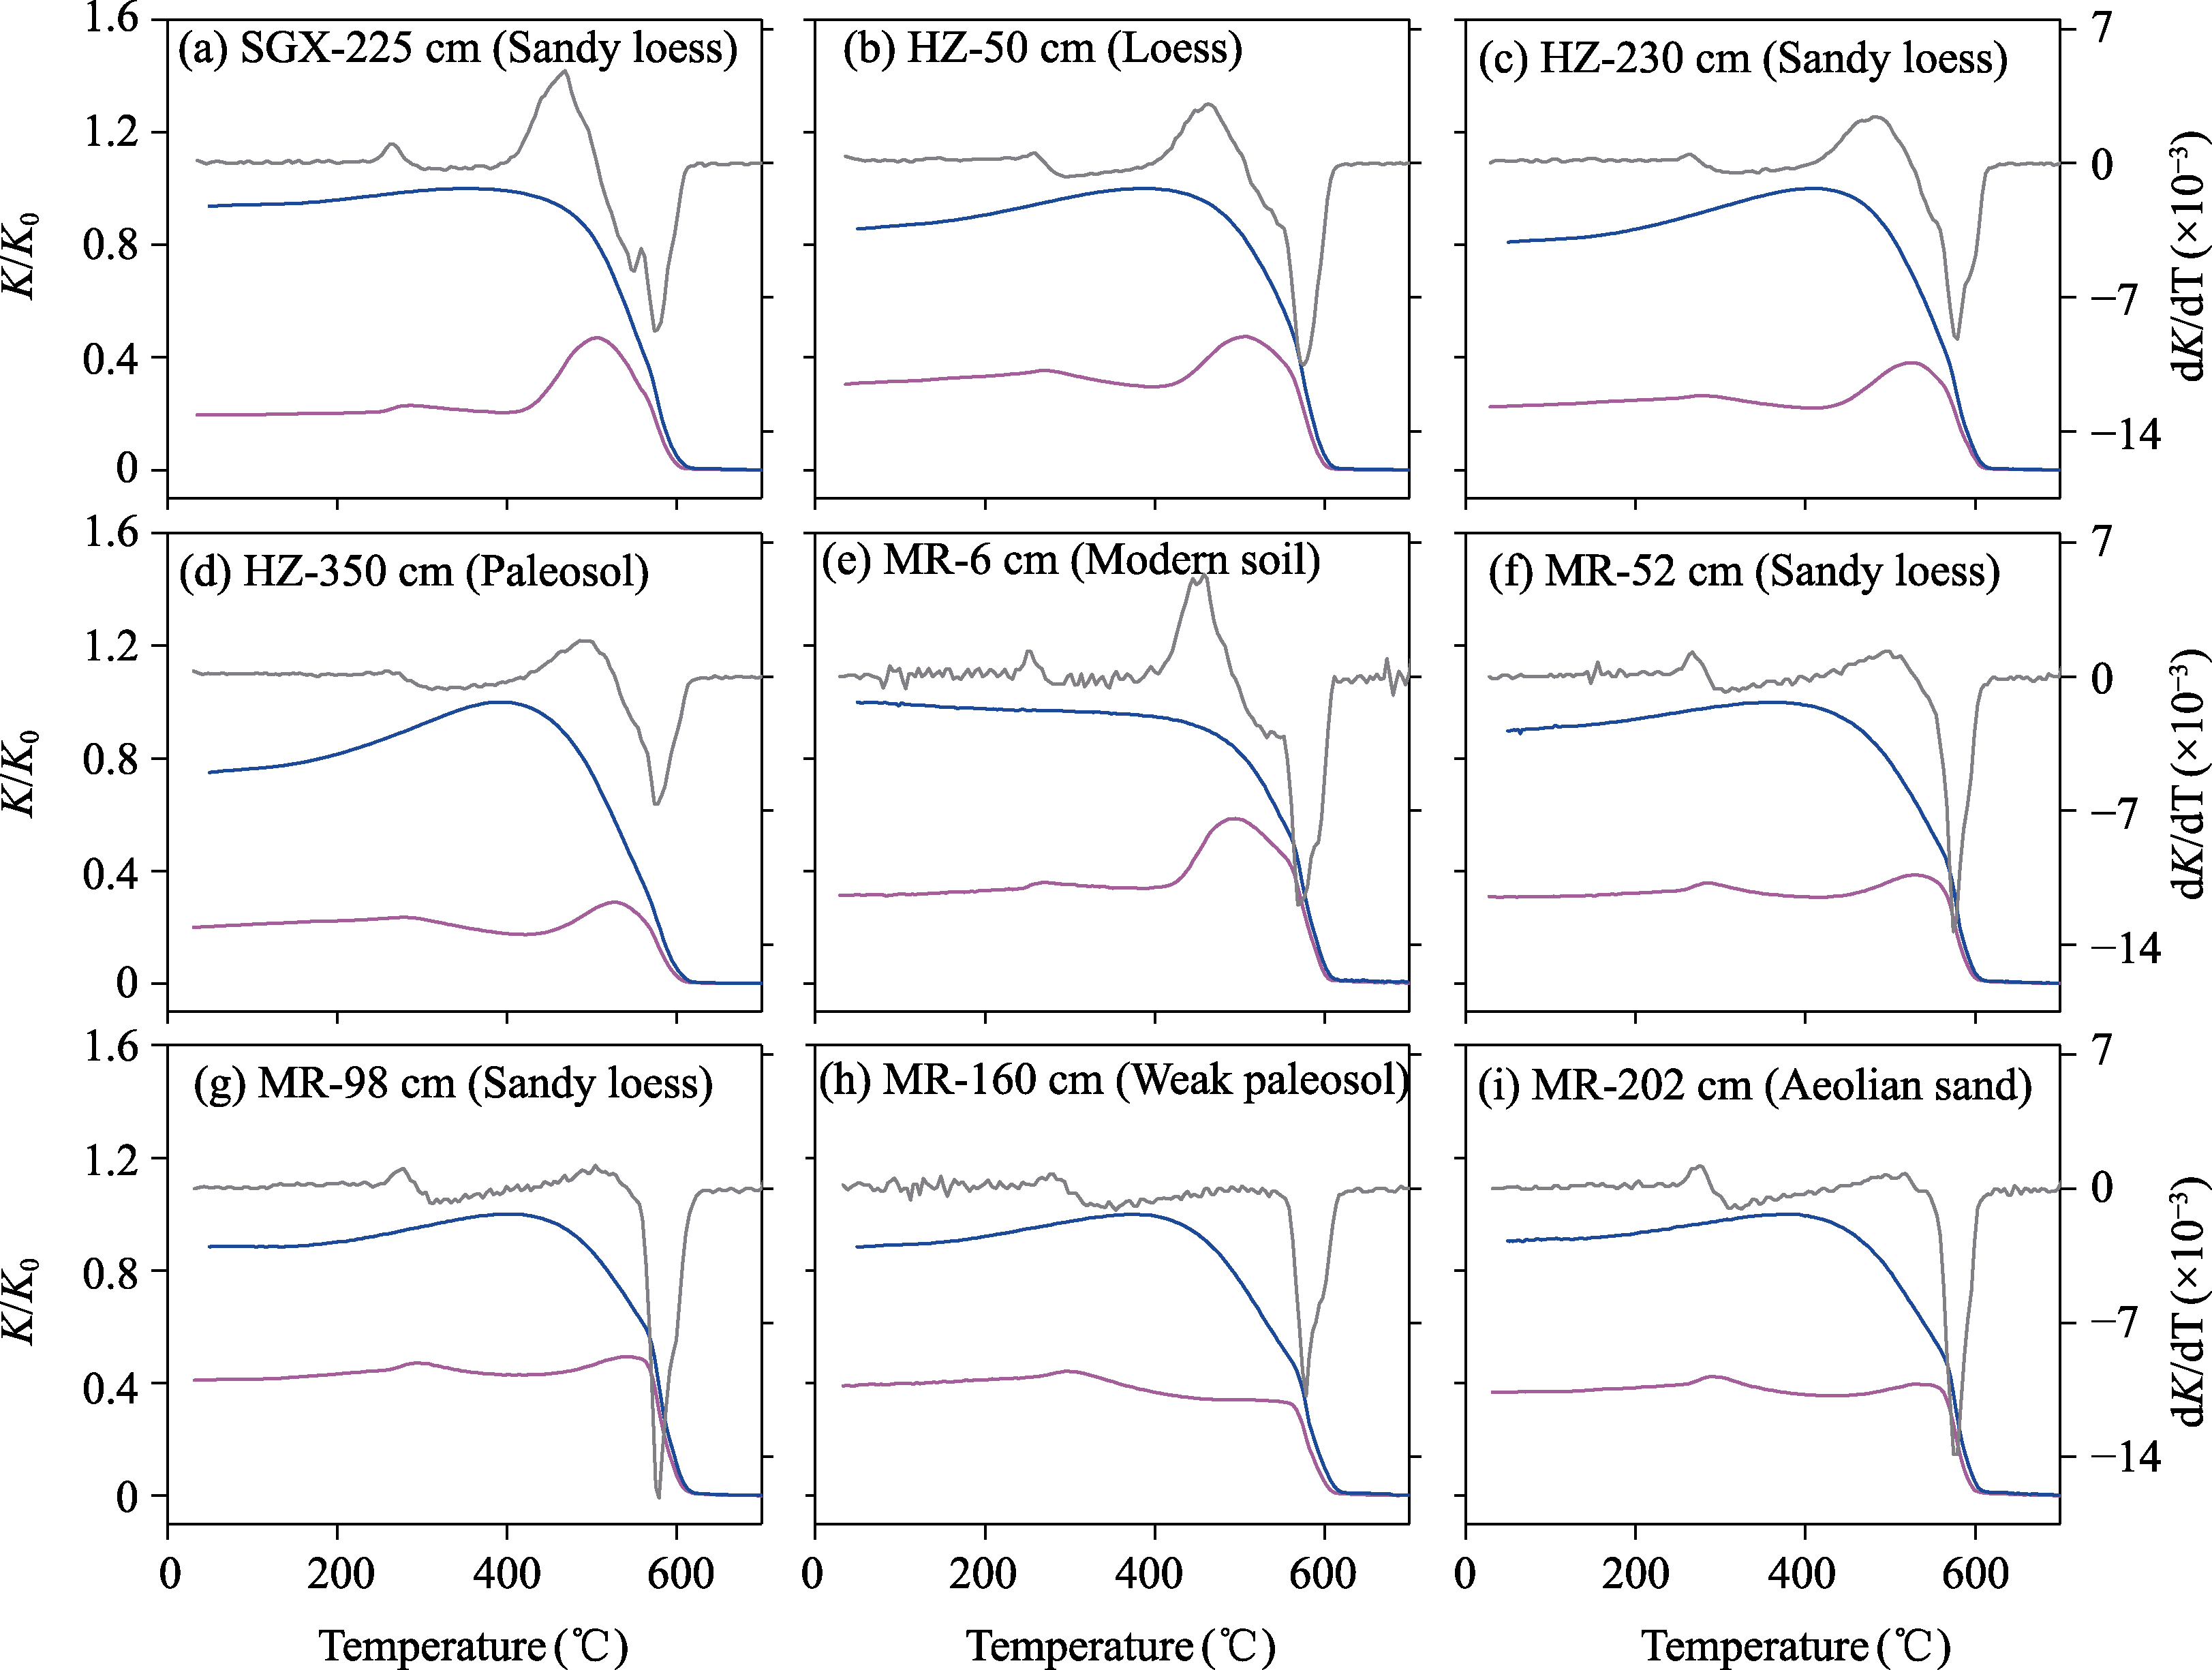
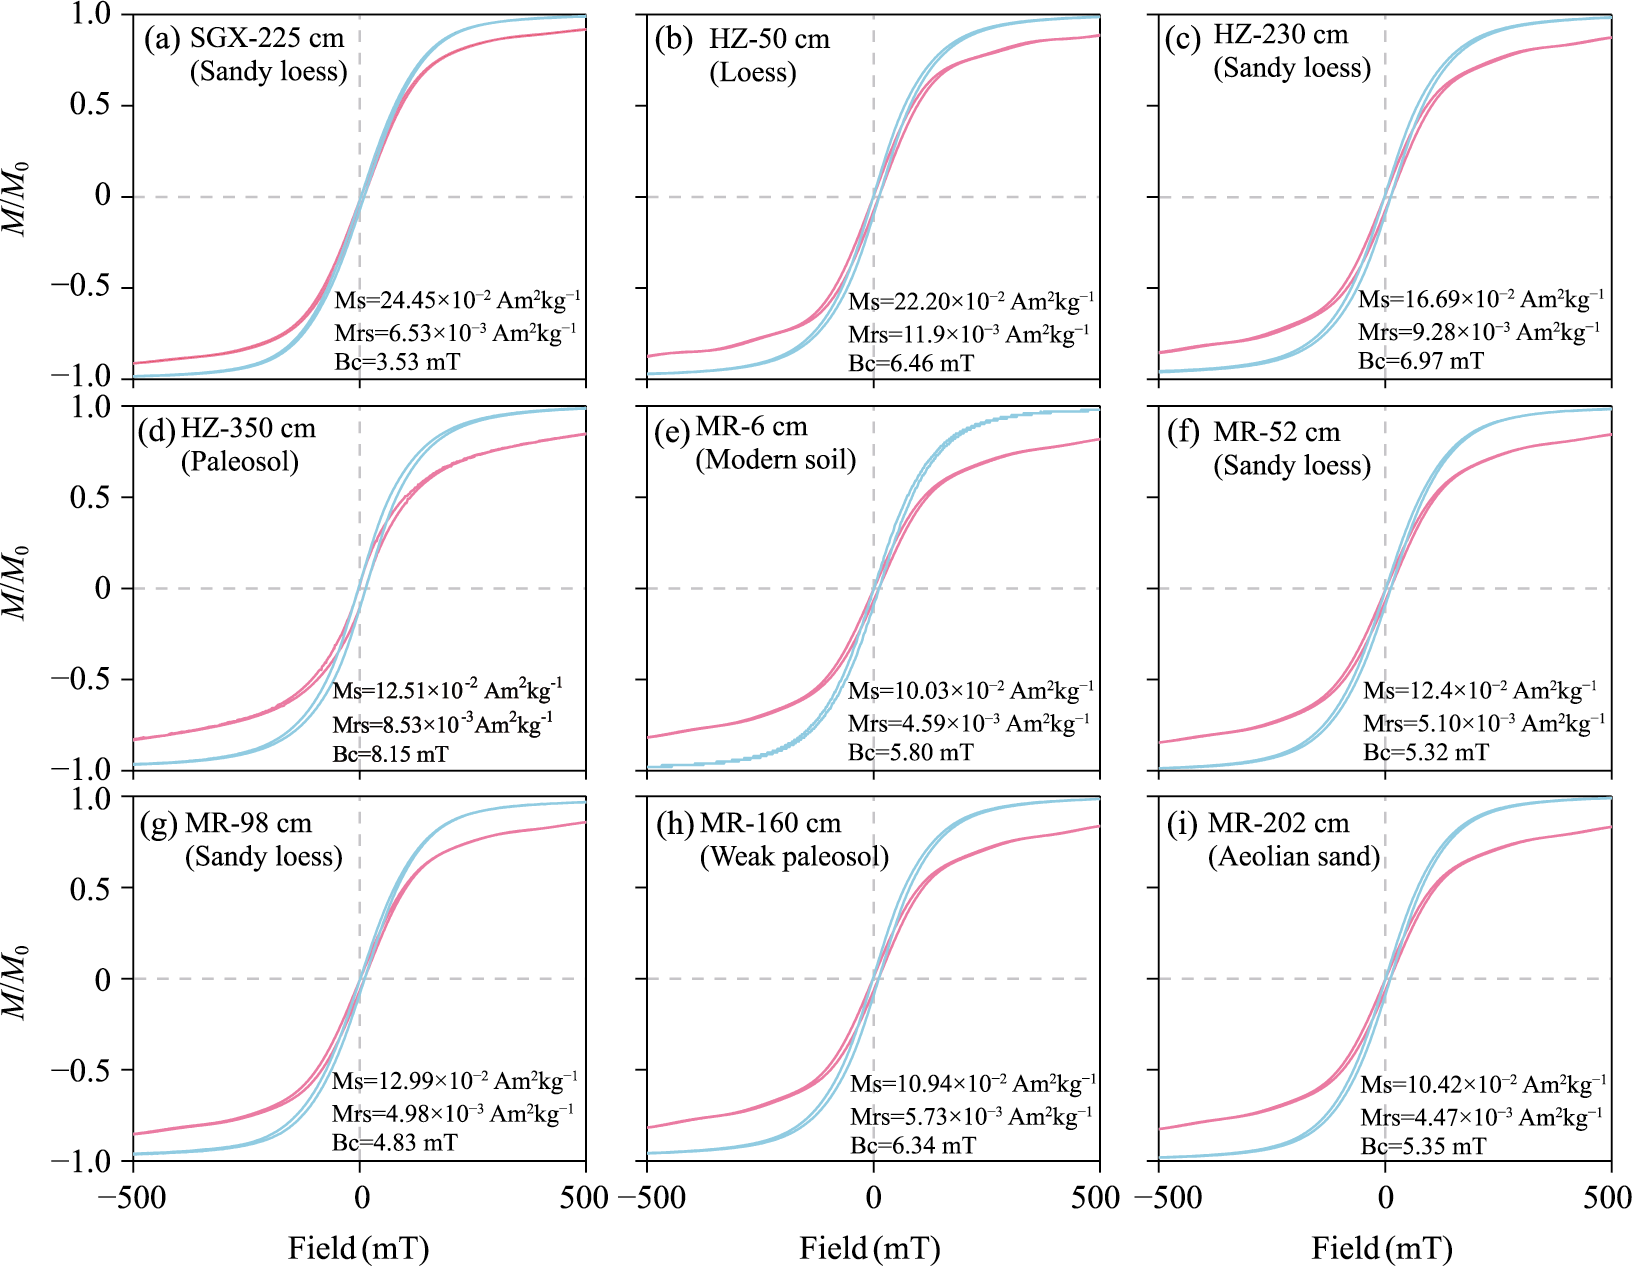
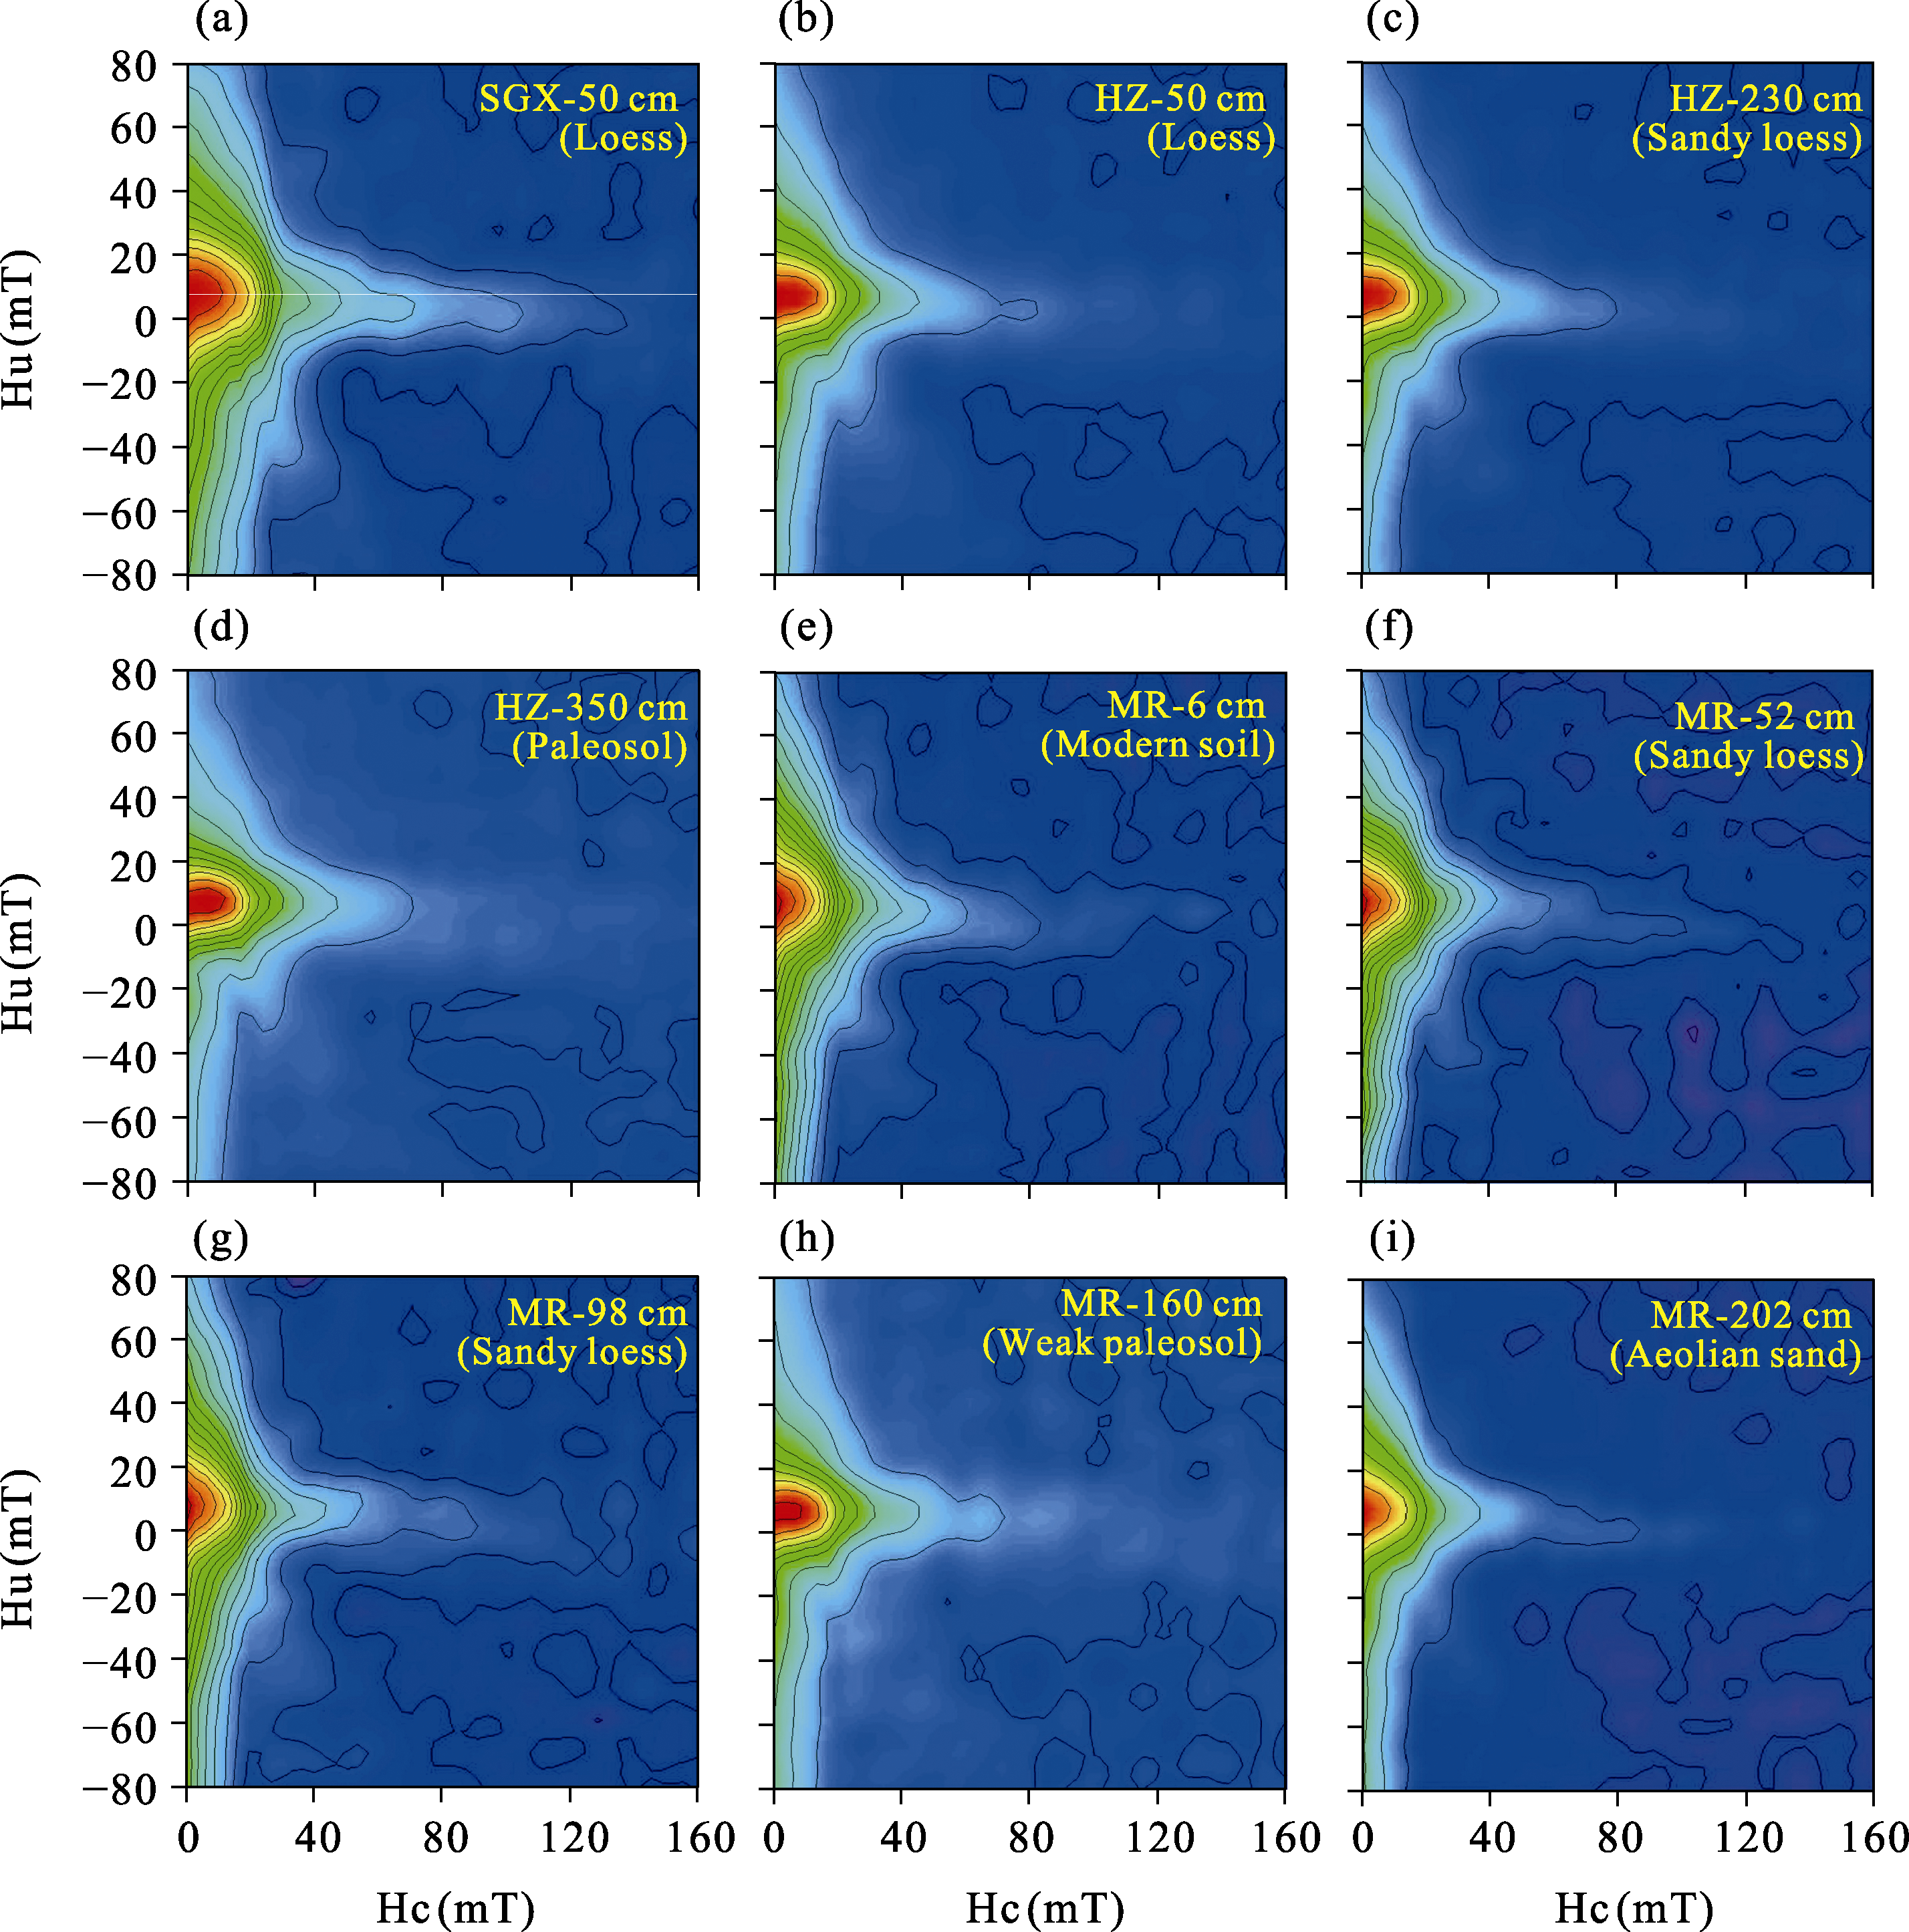
Figure 3 Magnetic properties of representative samples (SGX-50, HZ-300, and MR-240) from the SGX, HZ, and MR sections. (a-c) Temperature-dependent magnetic susceptibility curves. Heating, cooling, and first- derivative heating curves are shown in magenta, blue, and grey, respectively. (d-f) Hysteresis loops. Red curves are corrected for the paramagnetic component; cyan curves represent uncorrected data. (g-i) FORC diagrams.
Other figure/table from this article