Figure/Table detail

Spatiotemporal heterogeneity of magnetic enhancement mechanisms in aeolian deposits on the southern Tibetan Plateau: Implications for paleoclimatic reconstruction in mountain- basin systems
WANG Haoyu, YANG Junhuai, QU Wenxi, WANG Linkai, ZHANG Canyi, LIU Xin, TANG Jinmeng, GAO Fuyuan, CHEN Zixuan, WANG Shuyuan, FAN Yijiao, WU Duo
Journal of Geographical Sciences, 2026, 36(1): 177-198.   DOI: 10.1007/s11442-026-2443-7

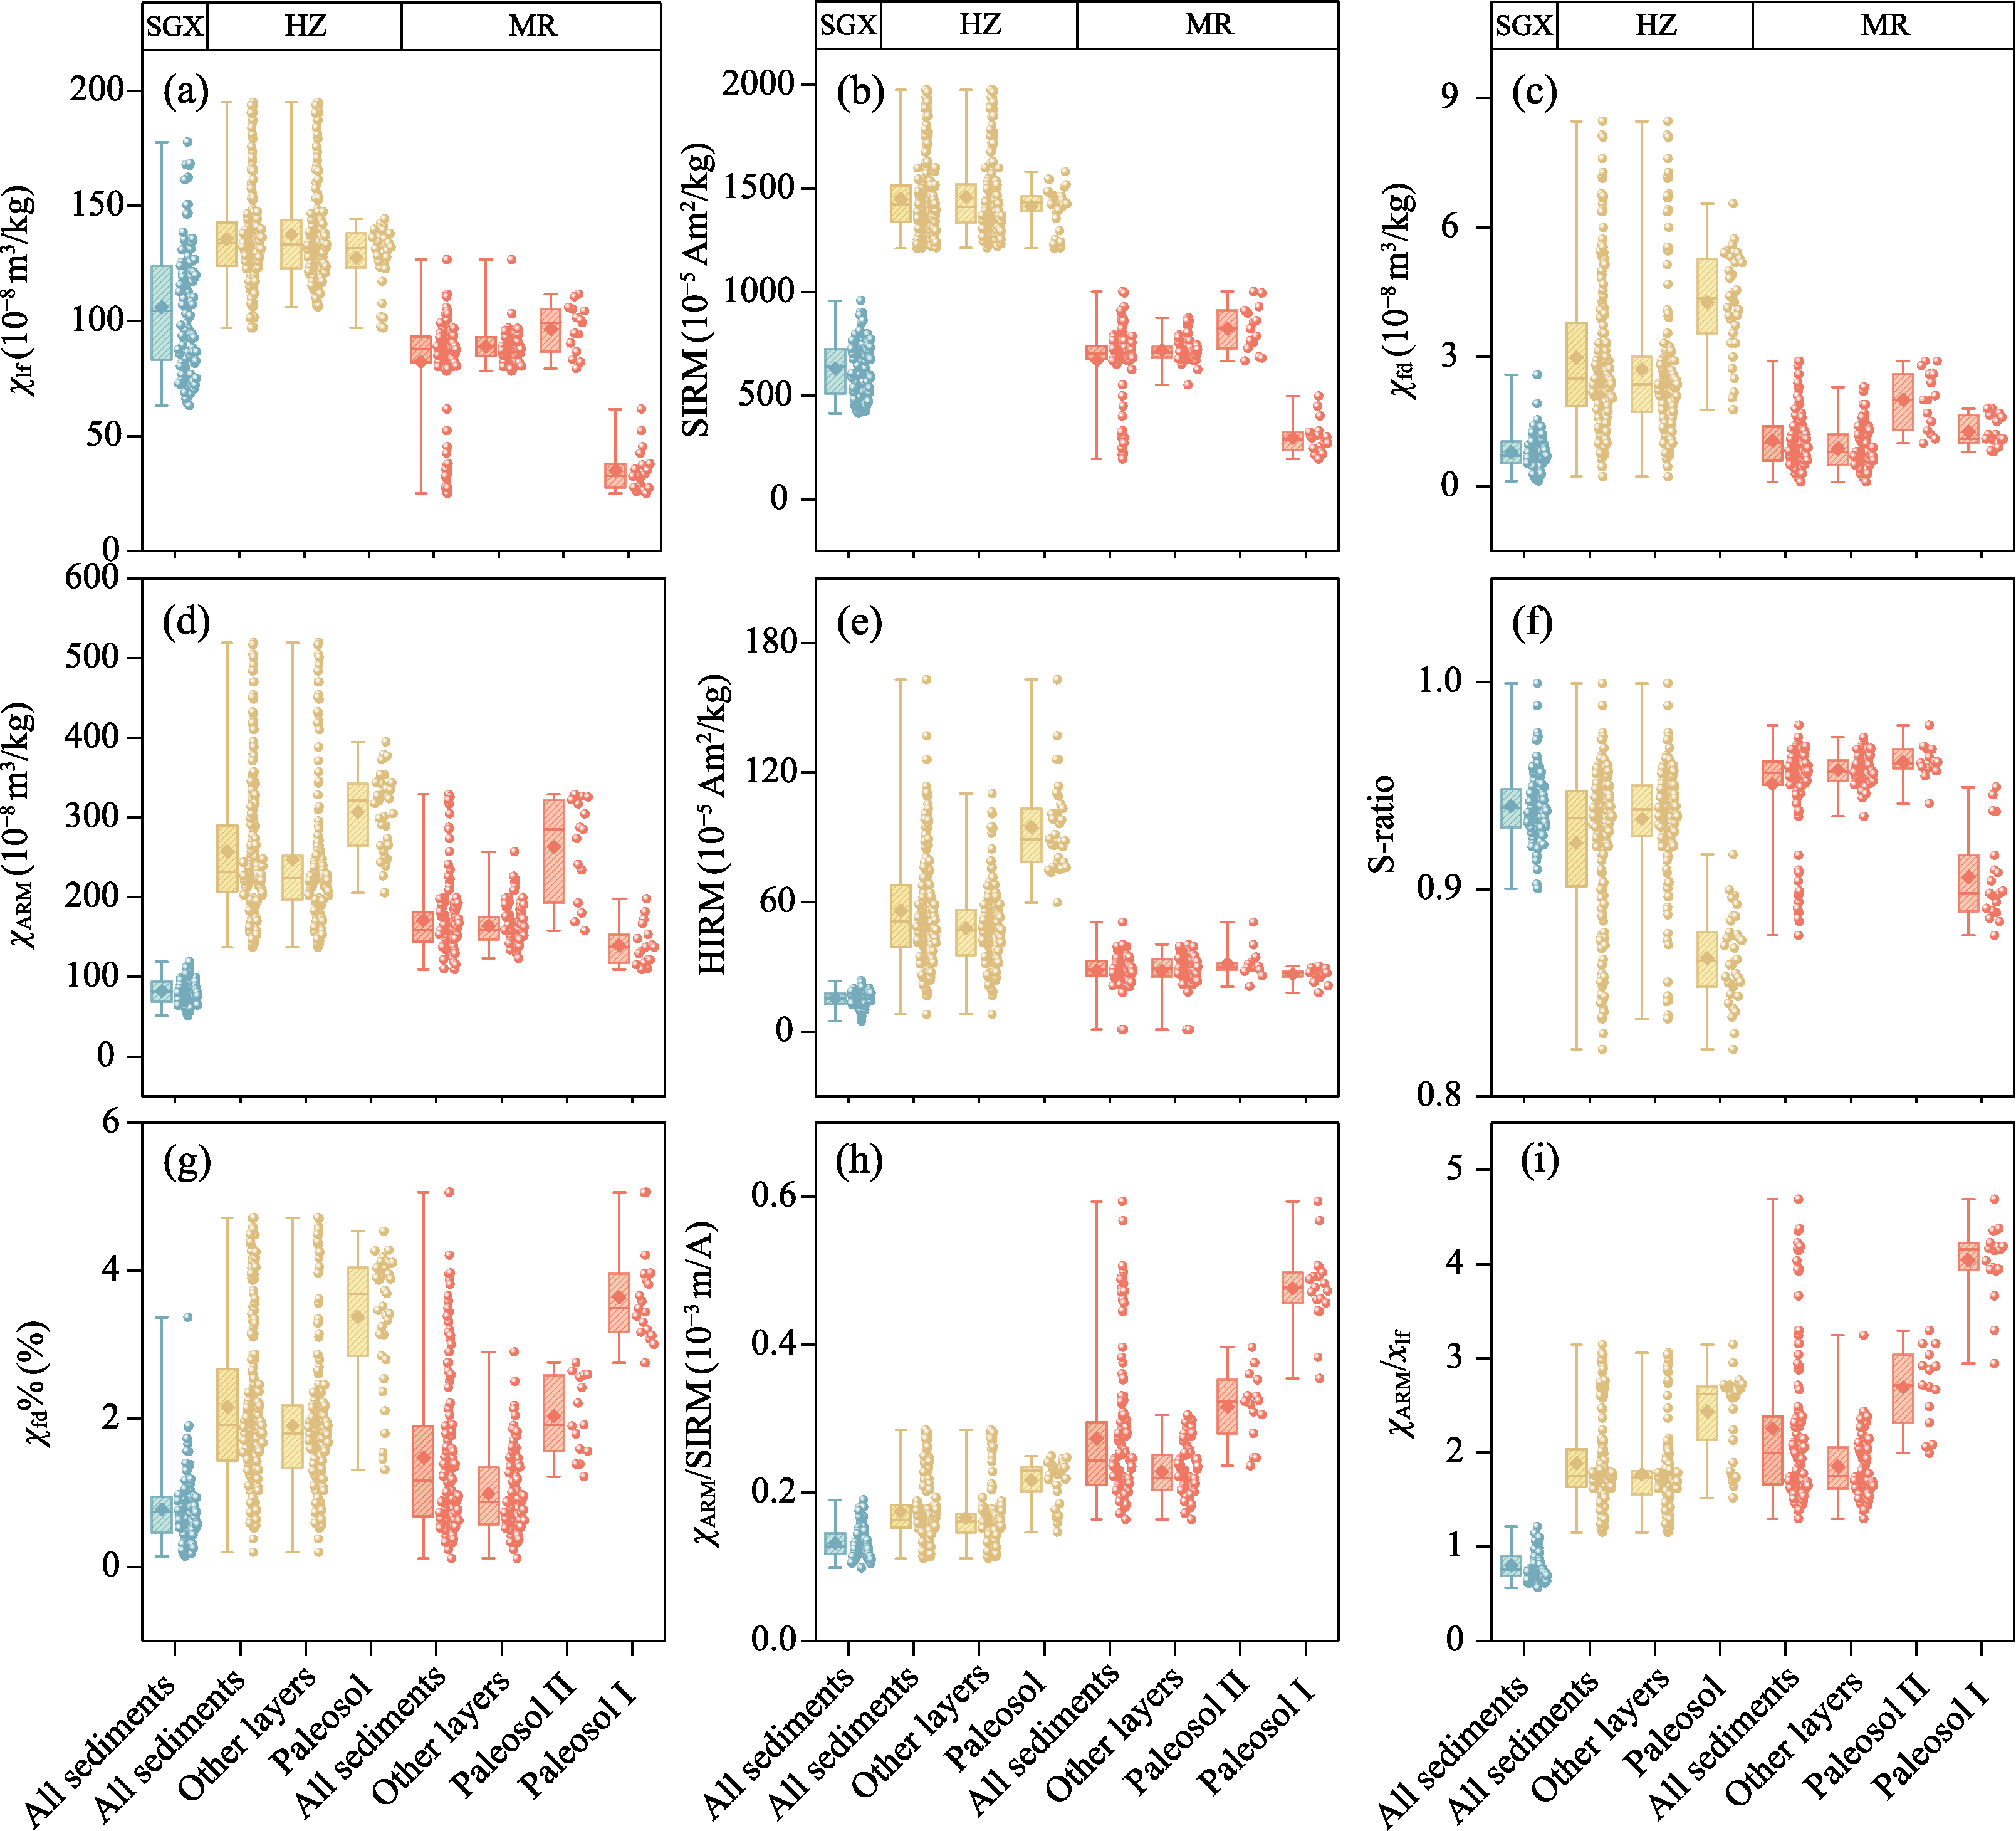
Figure 4 Box-and-whisker plots of magnetic parameters of the SGX, HZ, and MR sections. The box plots show the median (internal line), mean (rhombus), interquartile range (25th-75th percentile; box), and min-max range (whiskers).
Other figure/table from this article