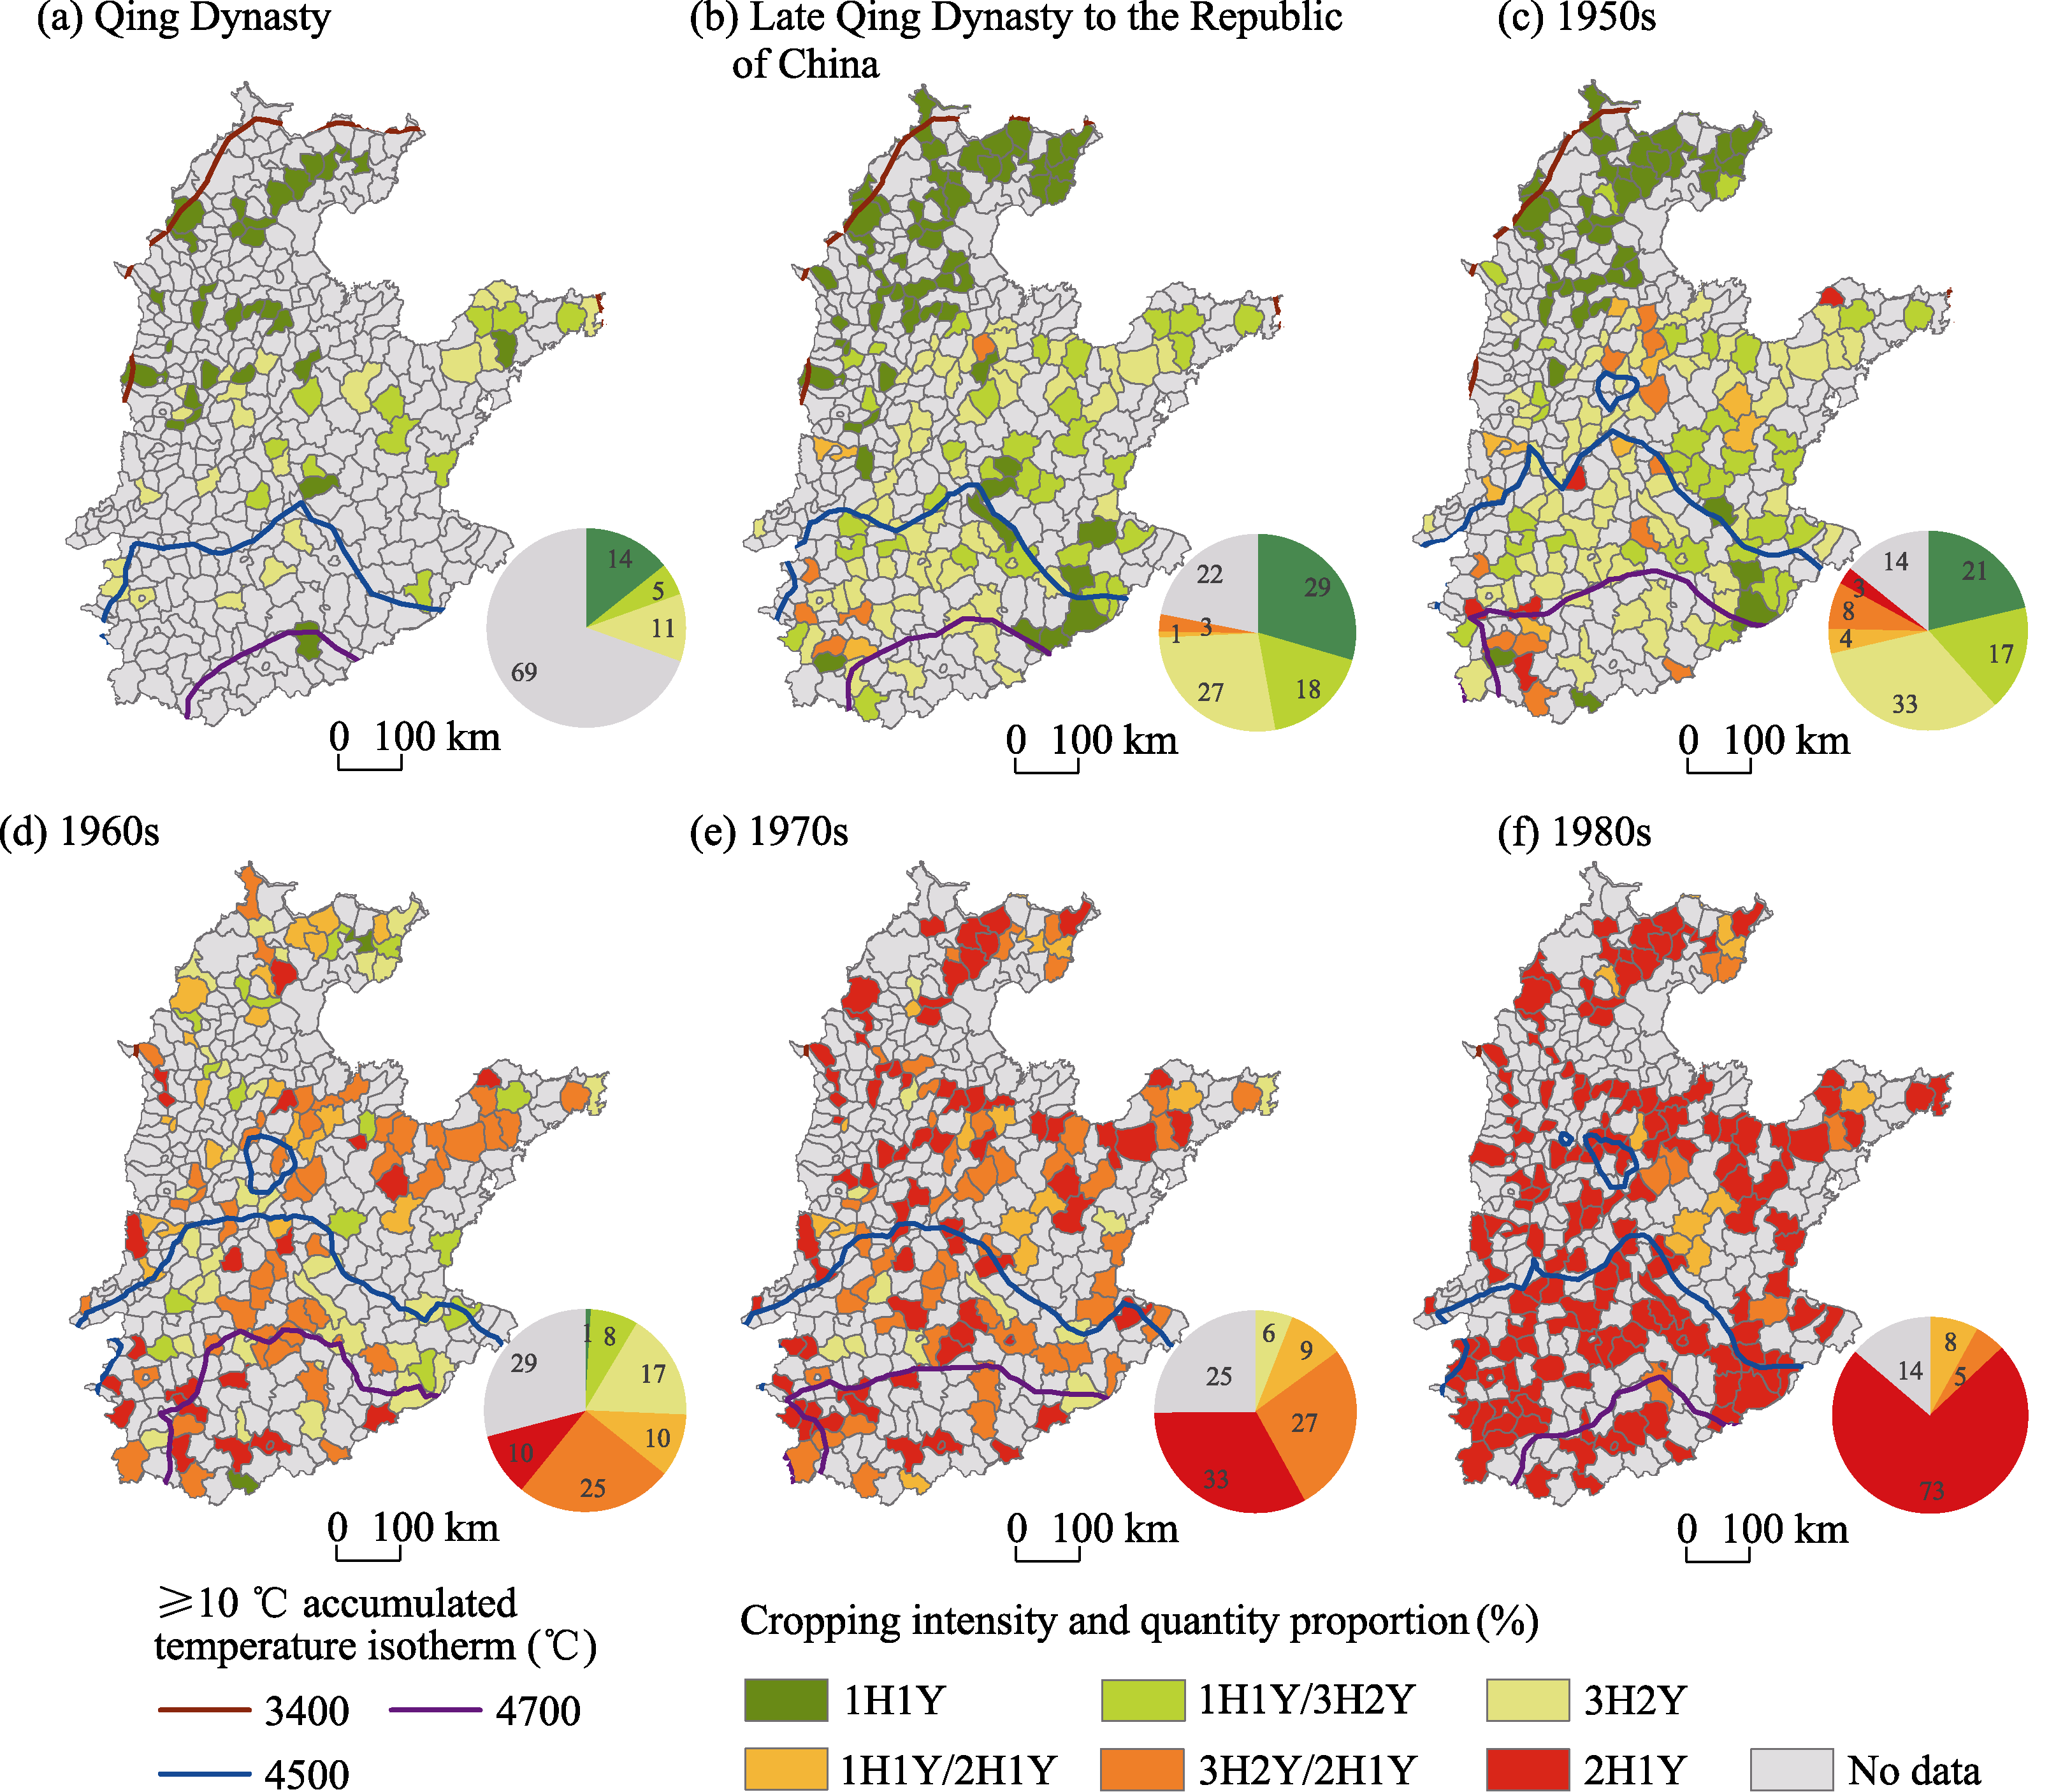
Figure 2 Spatial distribution and proportion of each cropping intensity in the North China Plain for six sub-periods (a−f) since the Qing Dynasty and the accumulated temperature. 1H1Y = one harvest per year, 3H2Y = three harvests in two years, 2H1Y = two harvests per year.
Other figure/table from this article