×
模态框(Modal)标题
在这里添加一些文本
Close
Close
Submit
Cancel
Confirm
×
模态框(Modal)标题
×
Journal
Article
Figure
Search
EN
中文
Home
About Journal
About Journal
Indexed in
Awards
Editorial Board
Guide for Authors
Browse
Current Issue
Online First
Archive
Highlights
Topic
Archive by Subject
Most Viewed
Most Download
Most Cited
E-mail Alert
RSS
Subscribe
Advertisement
Contact us
EN
中文
Figure/Table detail
Mapping cropping patterns in the North China Plain over the past 300 years and an analysis of the drivers of change
LI Shicheng, LIU Yating, LI Jianrui, ZHANG Xuezhen
Journal of Geographical Sciences
, 2024, 34(
10
): 2074-2088. DOI:
10.1007/s11442-024-2283-2
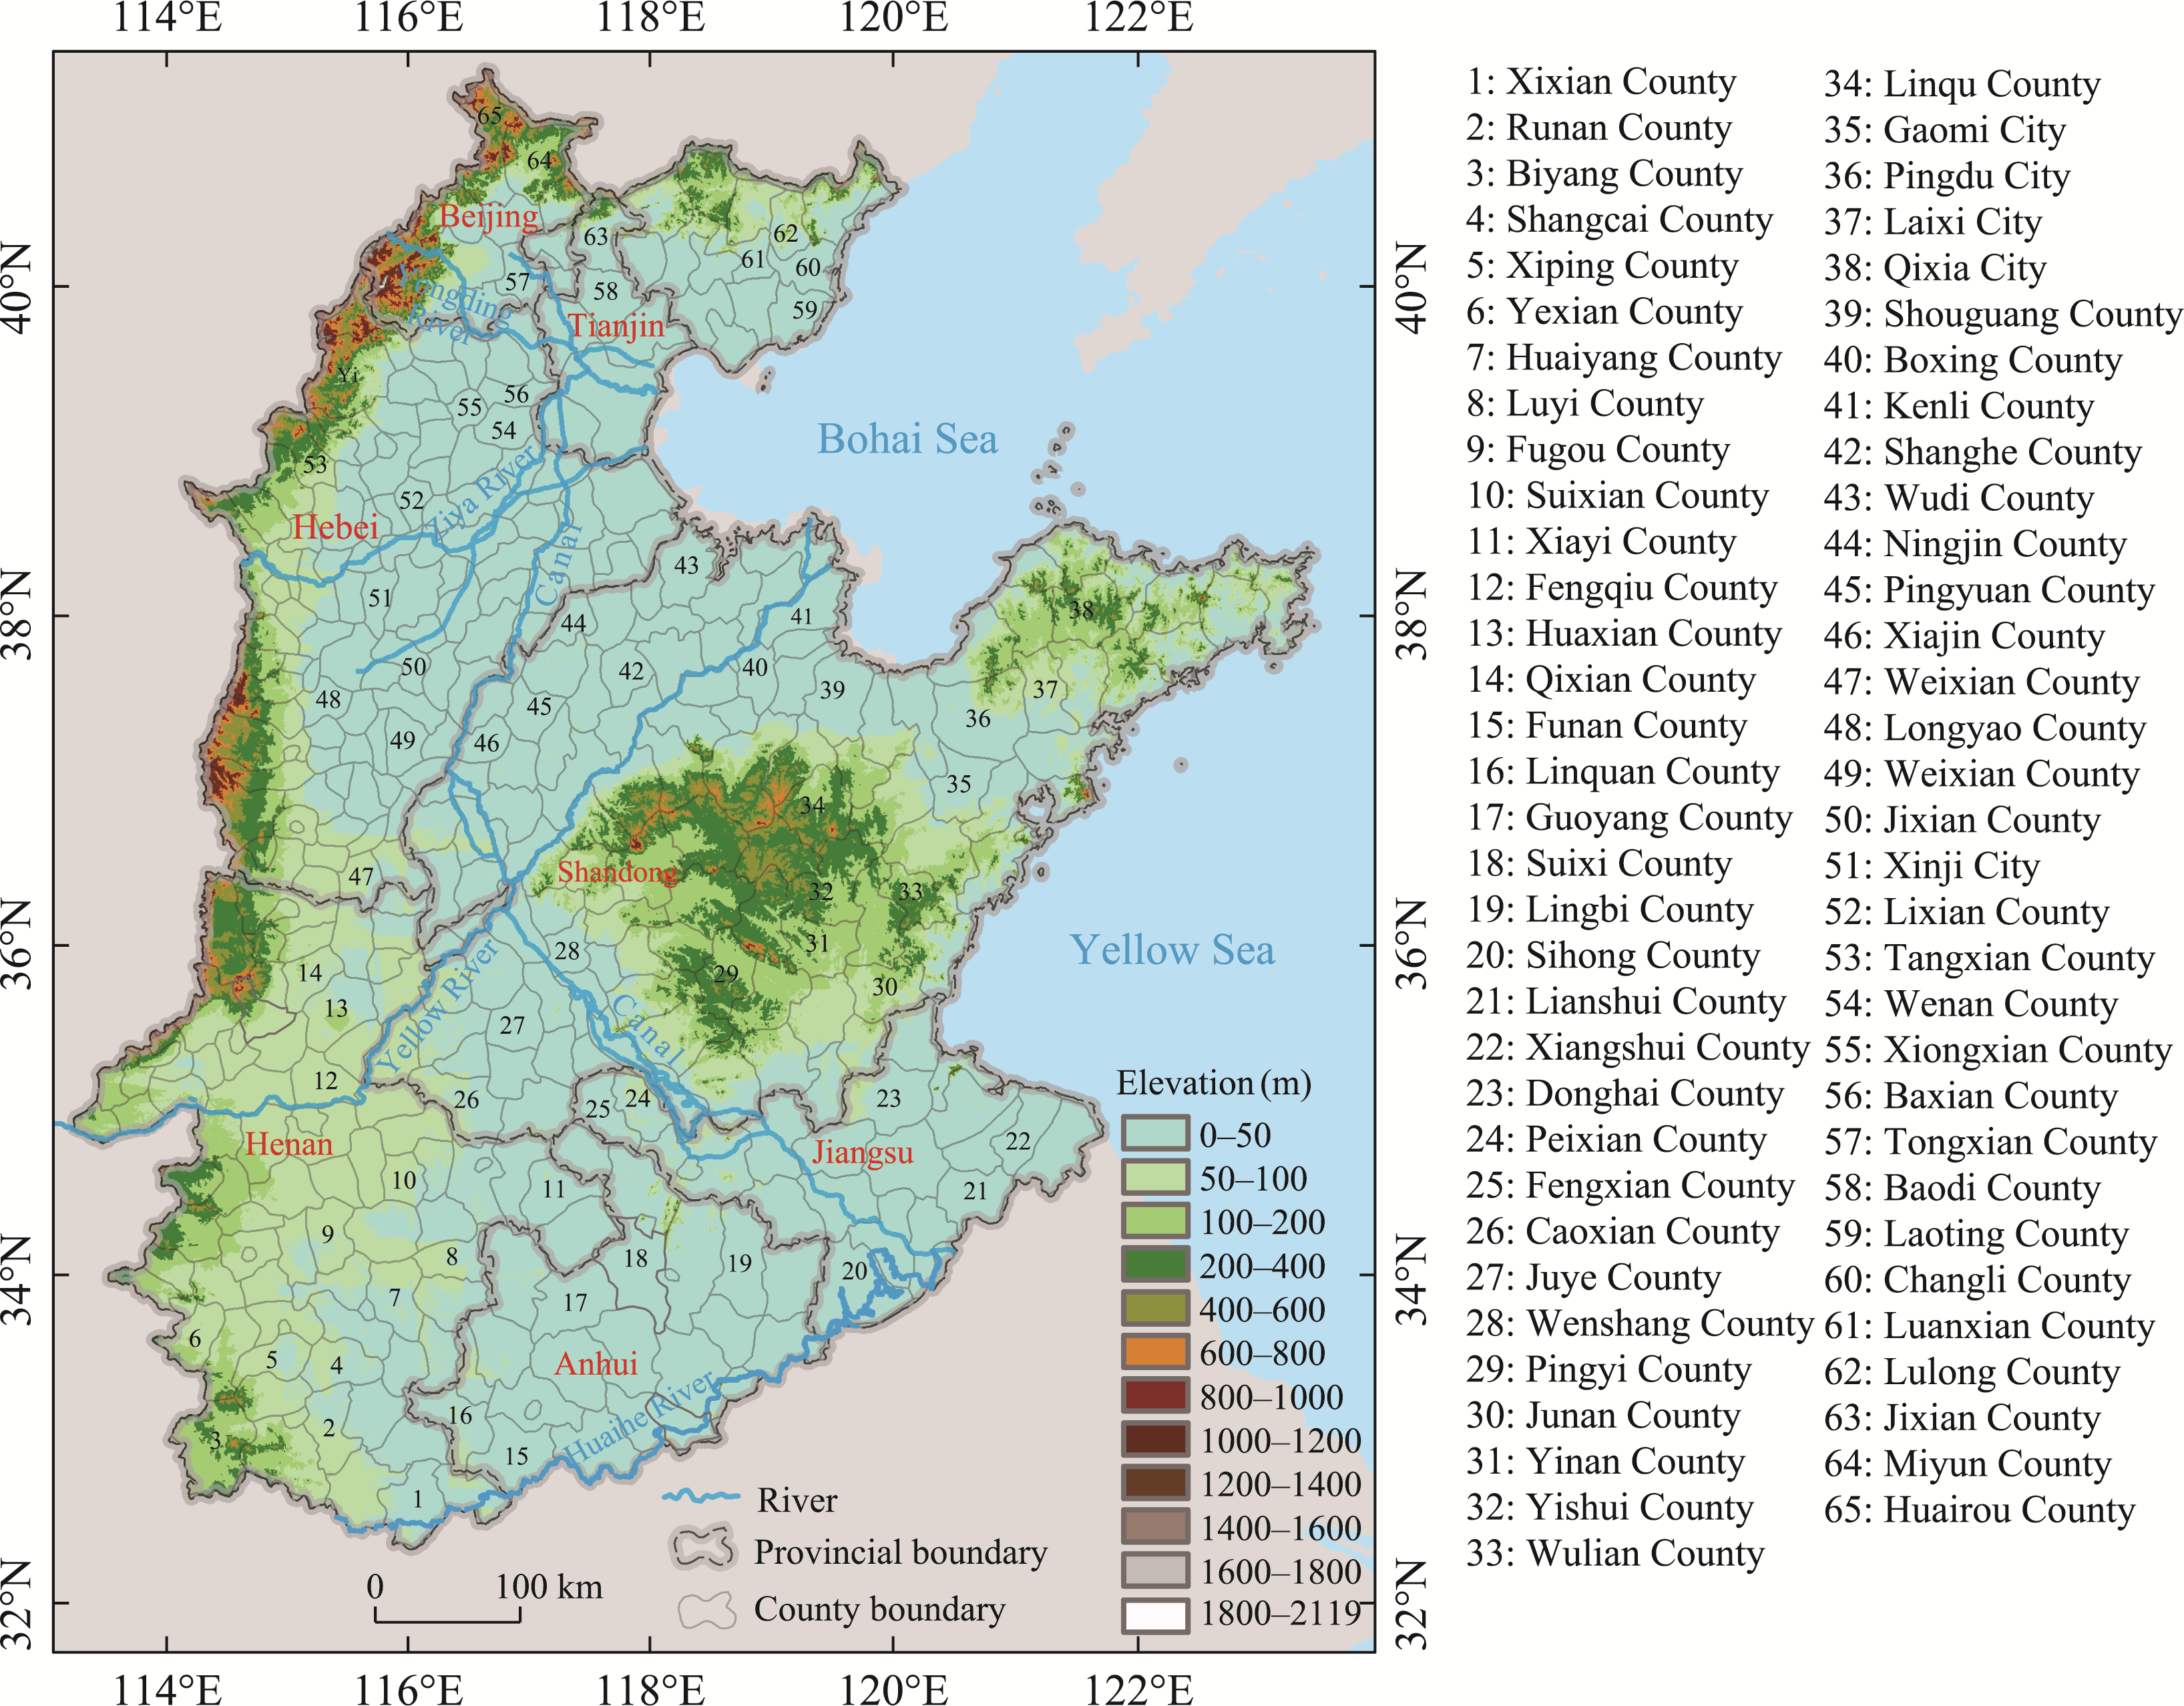
Figure 1
Location of the North China Plain, China
Other figure/table from this article
Table 1
Data sources for the analysis of the drivers of the change in cropping patterns
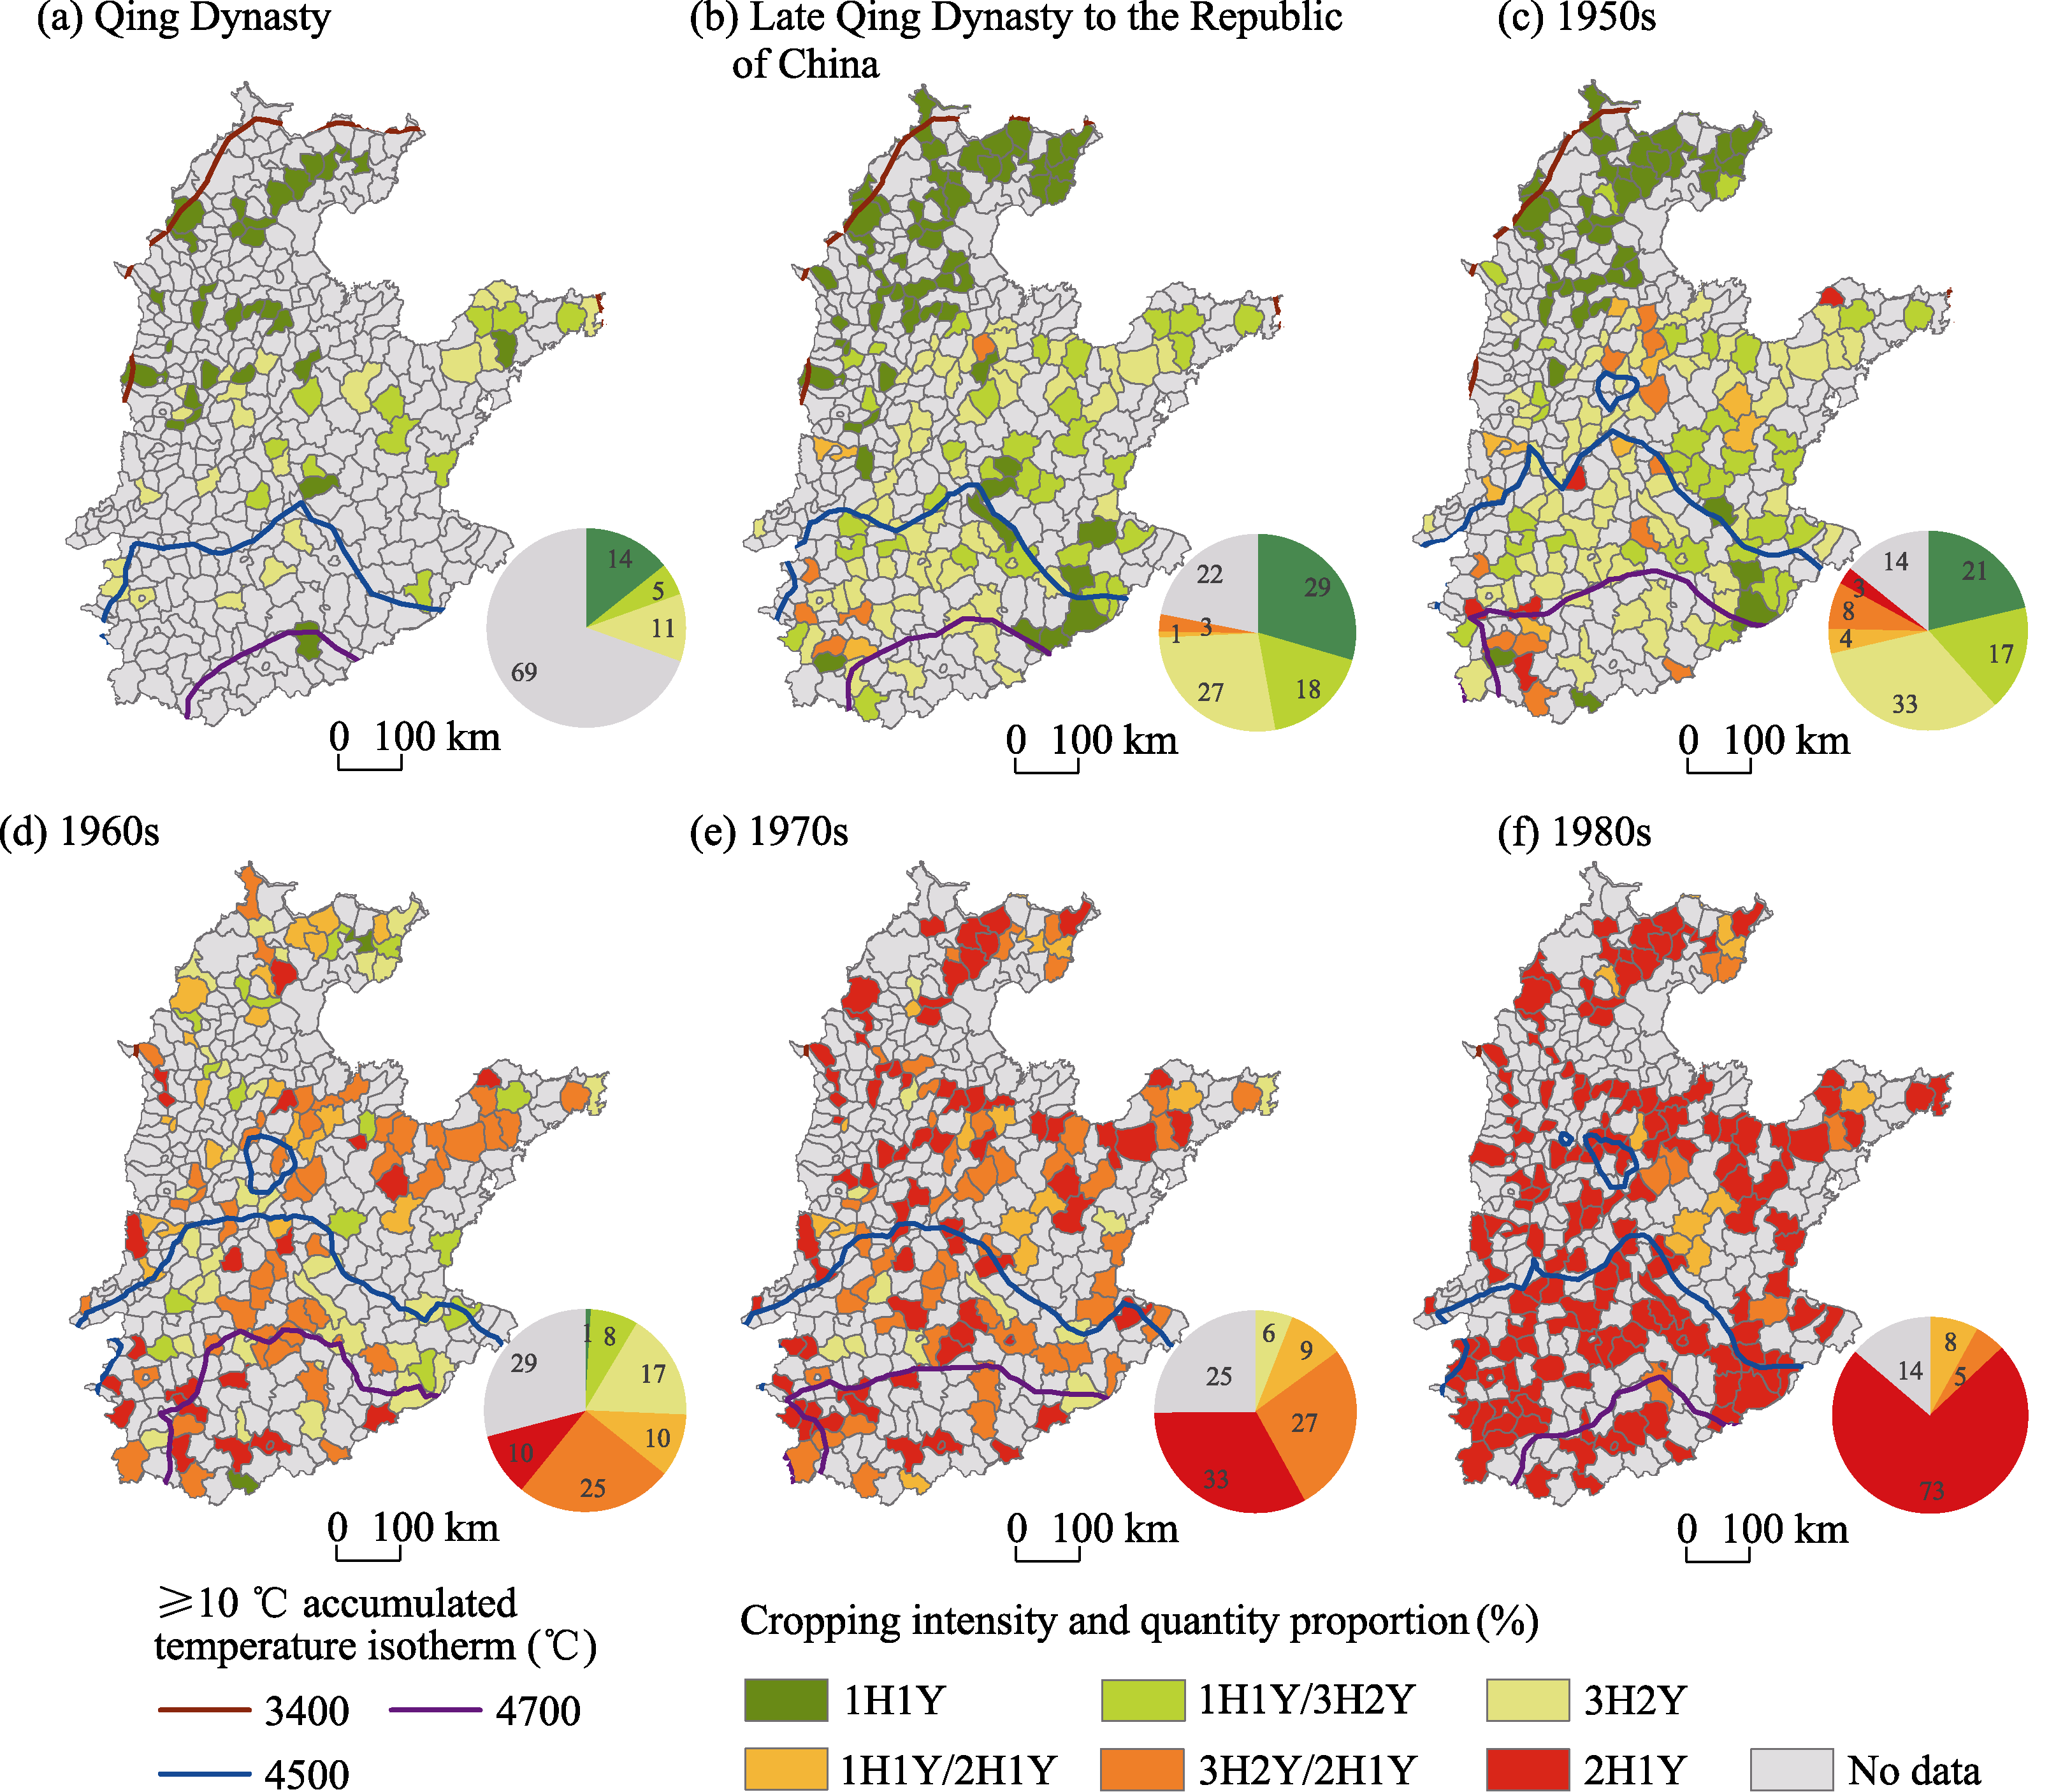
Figure 2
Spatial distribution and proportion of each cropping intensity in the North China Plain for six sub-periods (a−f) since the Qing Dynasty and the accumulated temperature. 1H1Y = one harvest per year, 3H2Y = three harvests in two years, 2H1Y = two harvests per year.
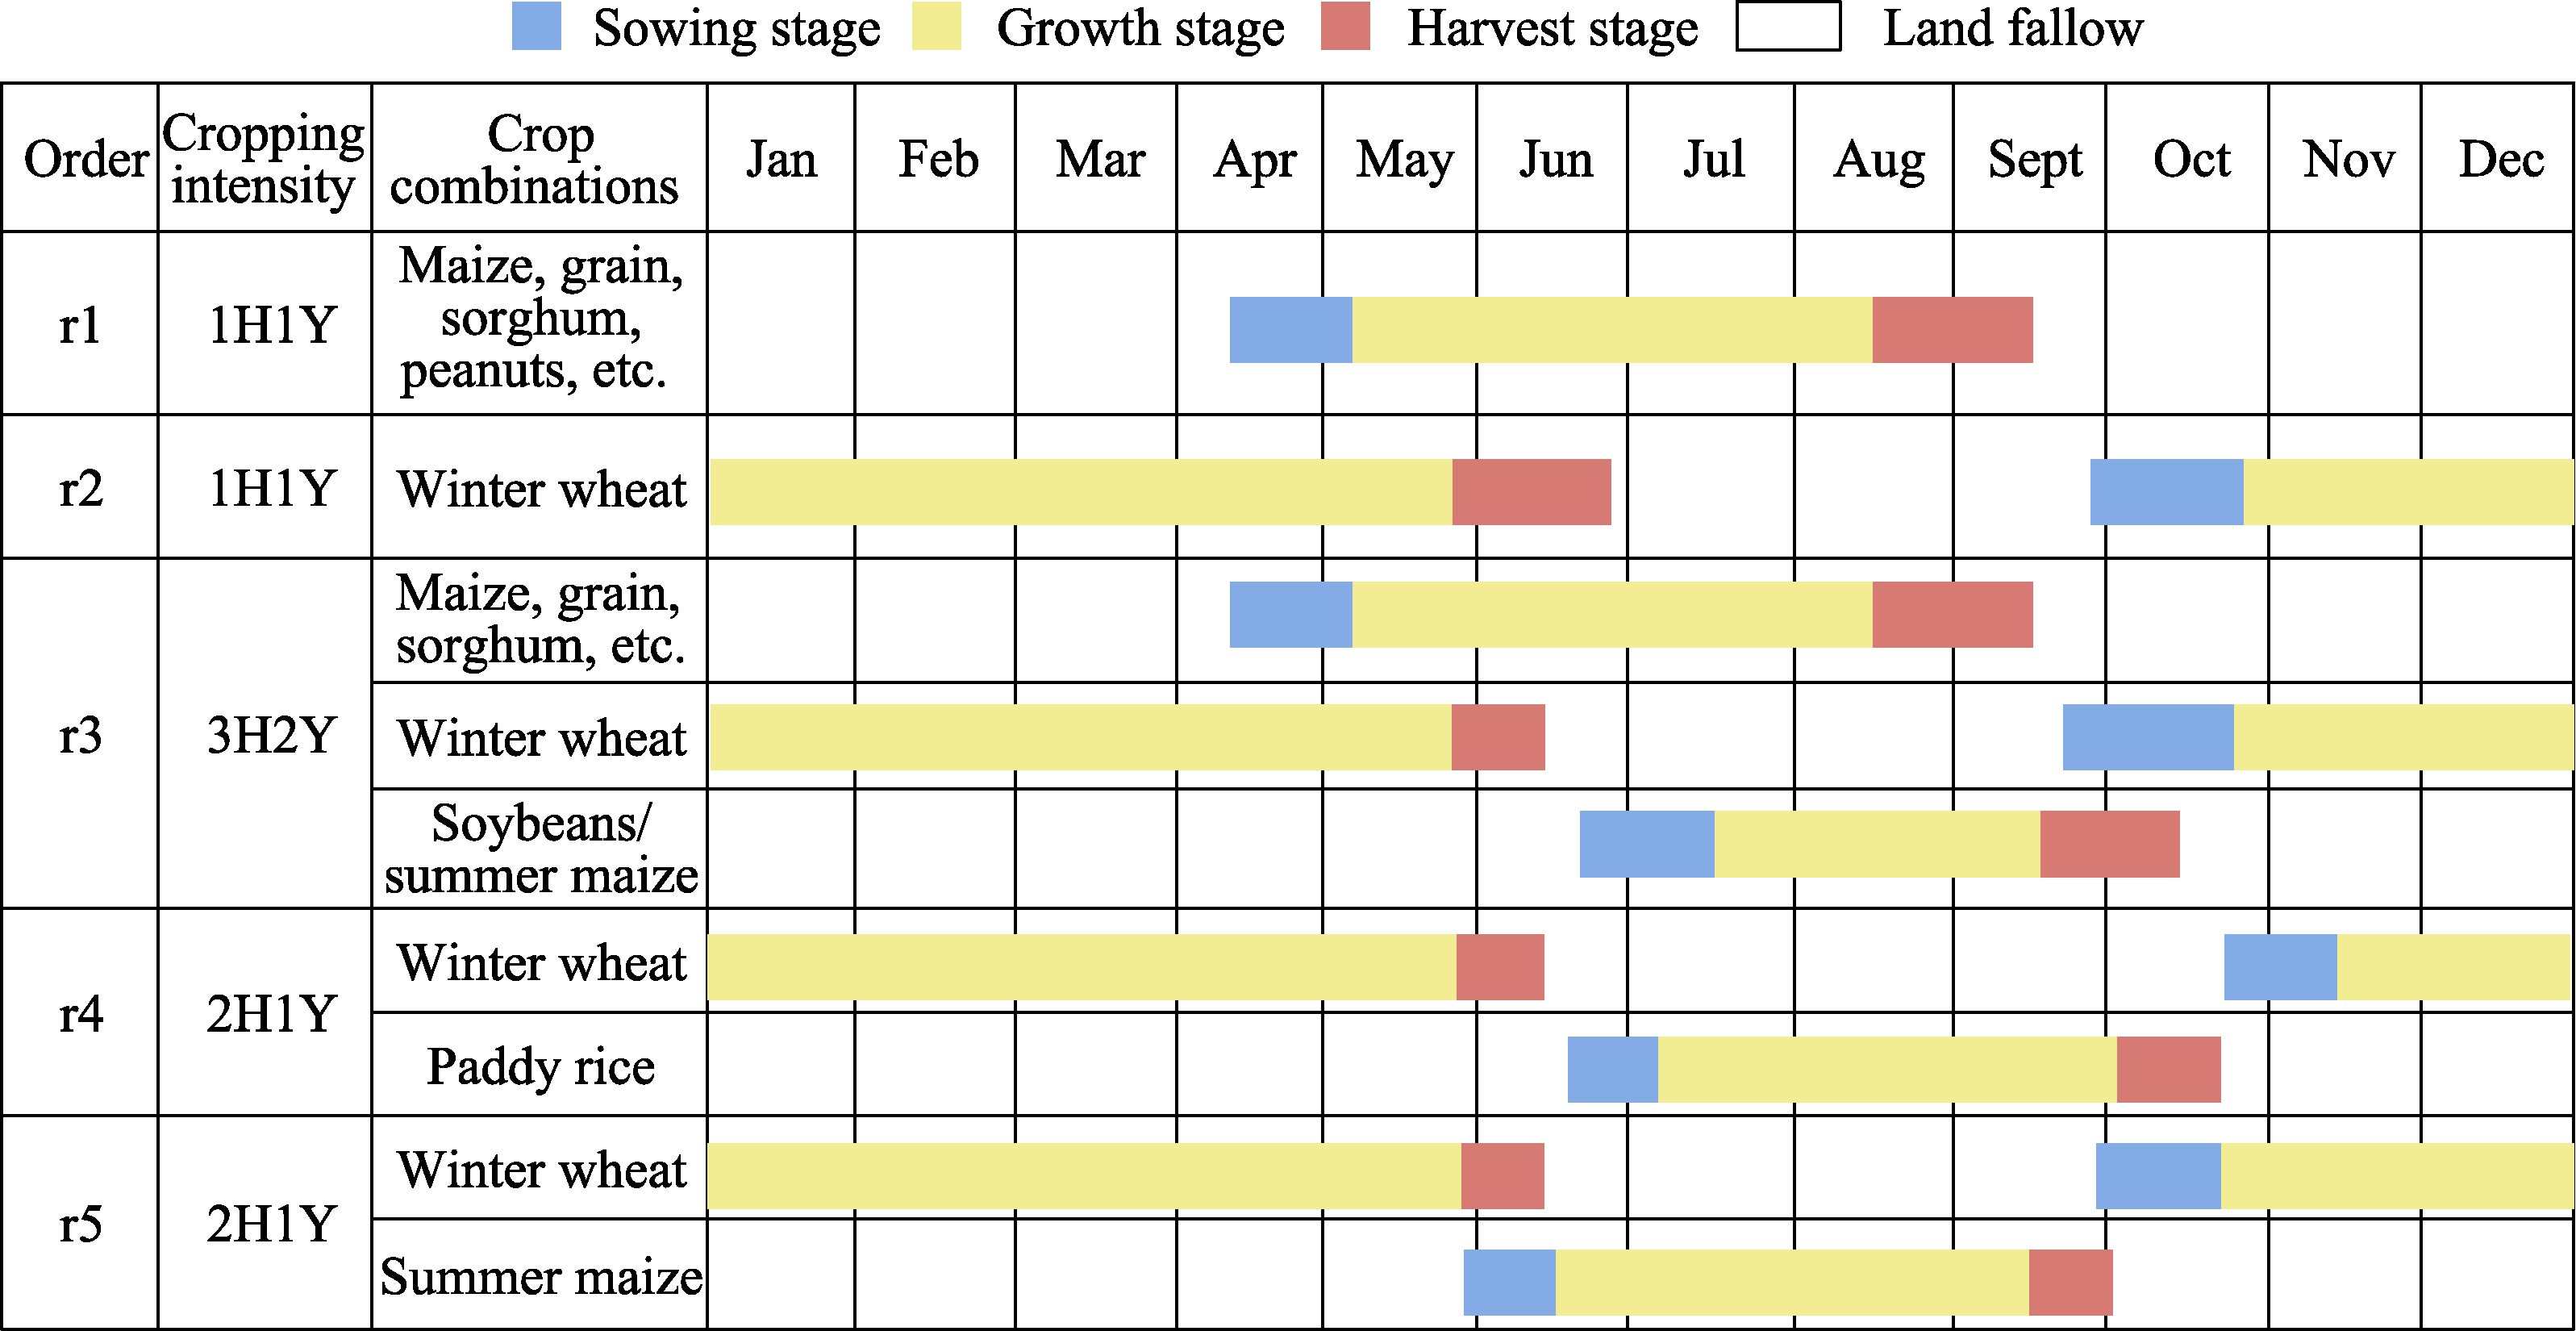
Figure 3
Crop combinations for each crop intensity in the North China Plain. The definitions of 1H1Y, 3H2Y, and 2H1Y are provided in the caption of
Figure 2
.
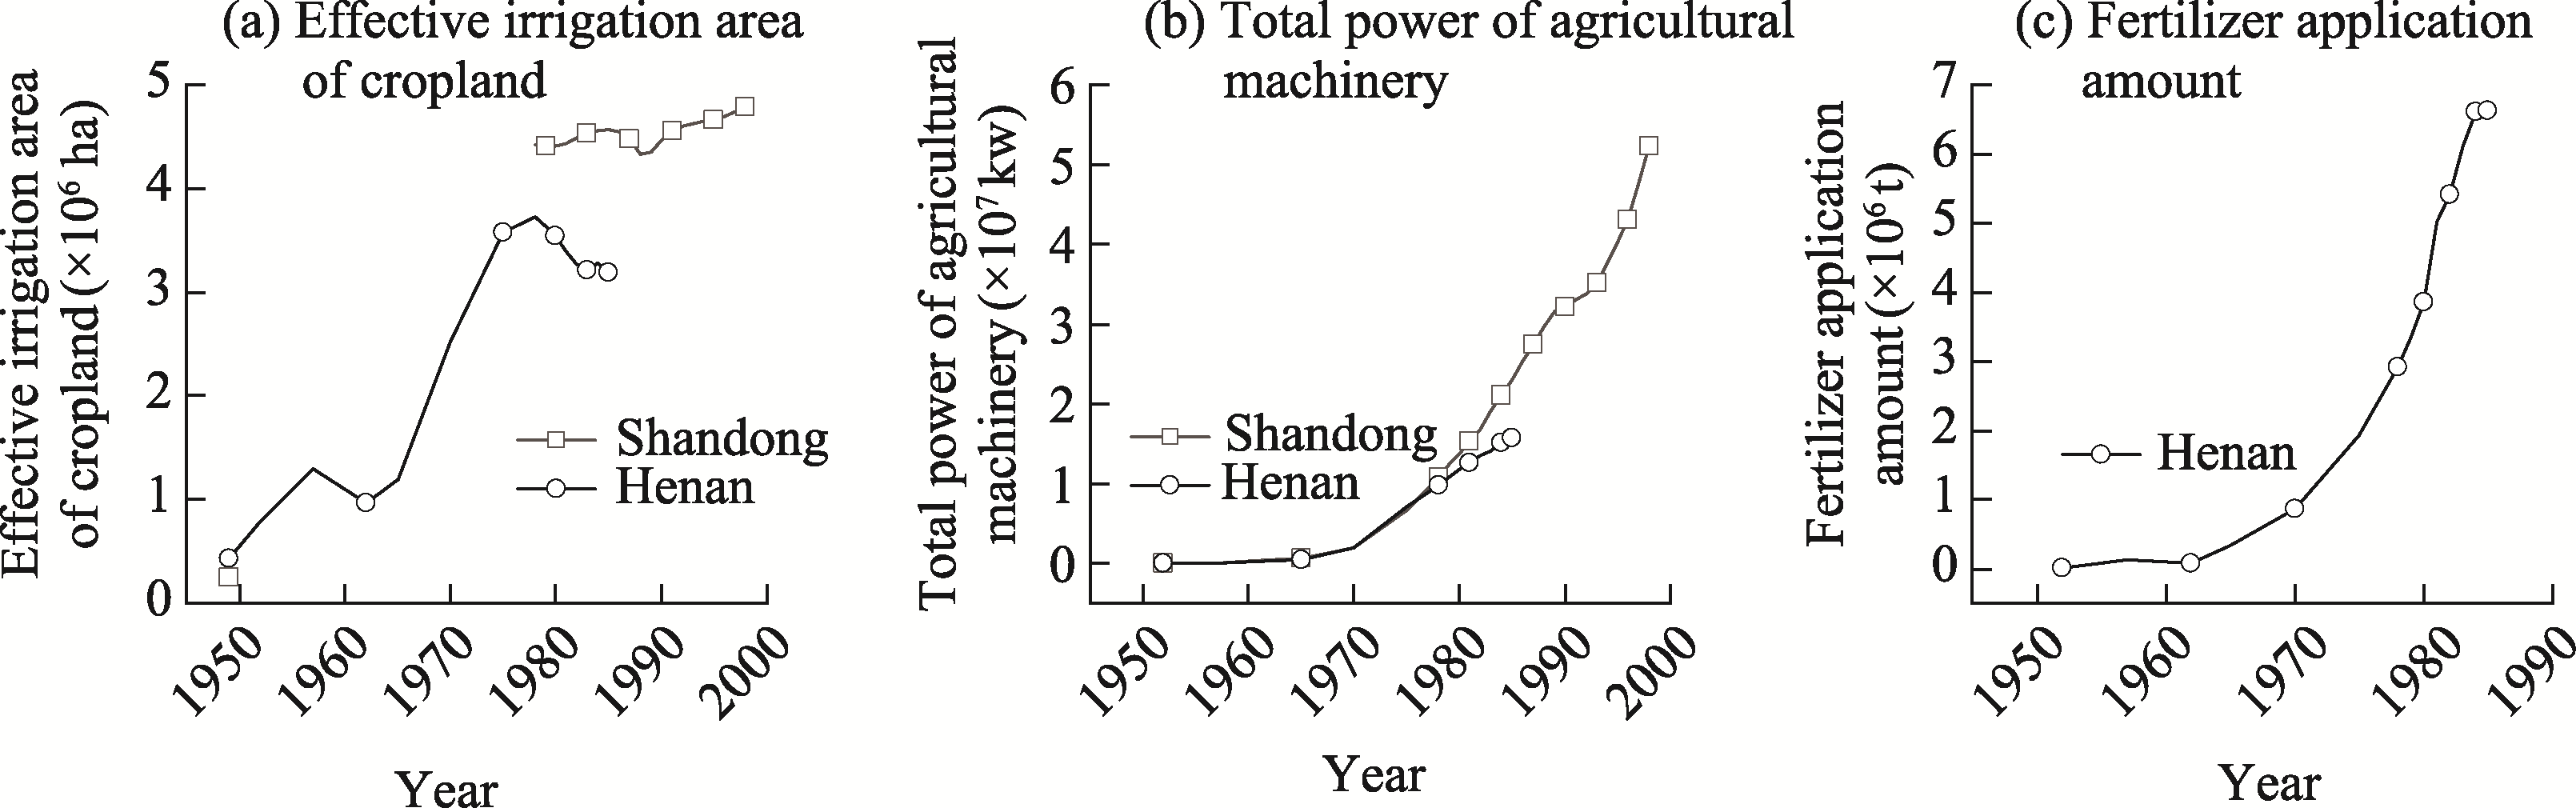
Figure 4
Changes in agricultural production conditions on the NCP since 1949