| Data | Temporal coverage | Spatial coverage | Resolution | Sources | |
|---|---|---|---|---|---|
| Temperature | Daily average temperature (CN05.1) | 1961-2021 | China | 0.25° | https://ccrc.iap.ac.cn/ (Wu and Gao, |
| Monthly average temperature (CRU TS) | 1901-2021 | Globe | 0.5° | https://www.uea.ac.uk/groups-and-centres/climatic-research-unit | |
| Near-surface annual average temperature | 1000-2000 | Northern Hemisphere | 2° | https://poles.tpdc.ac.cn/en/ (Fang et al., | |
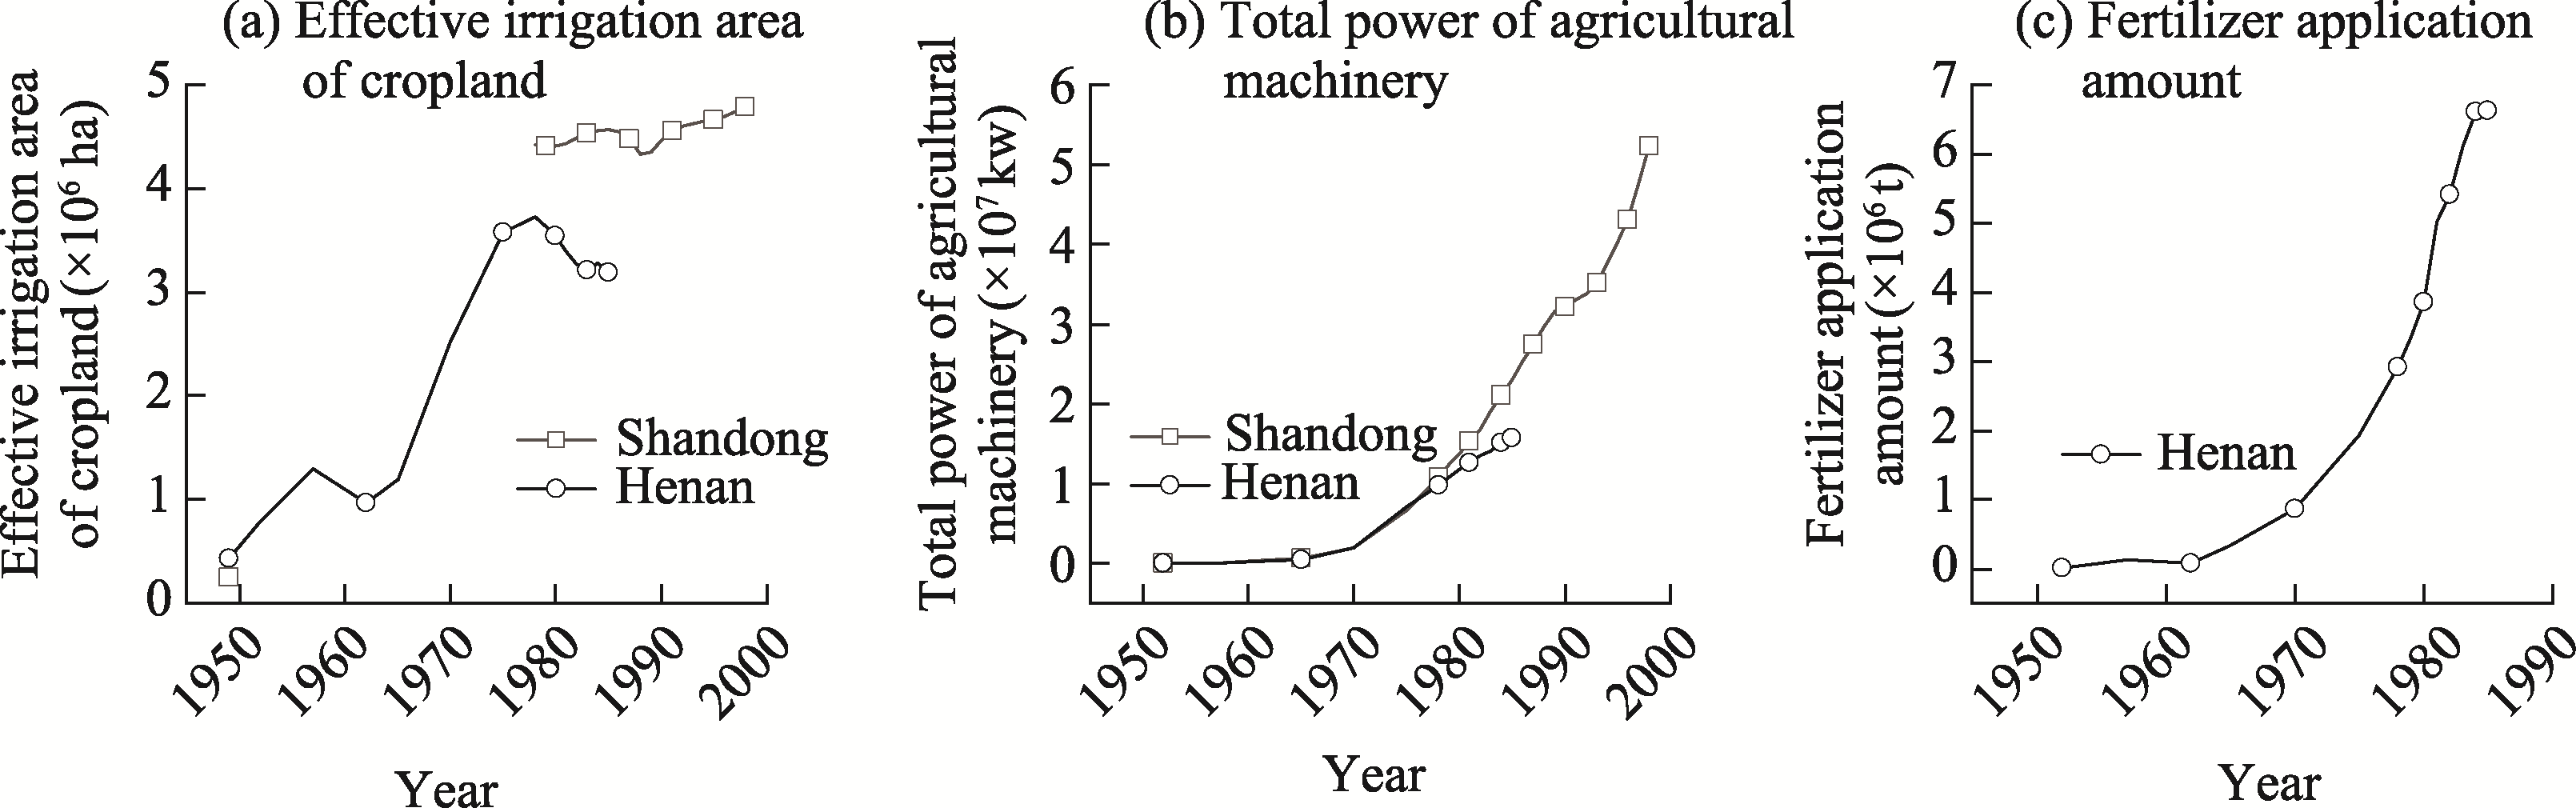
| Agricultural production conditions | Effective irrigation area of cropland | 1949-1999 | Henan and Shandong provinces | Province | Statistical Yearbook of Henan for 1985 (Henan Provincial Bureau of Statistics, |
| Total power of agricultural machinery | 1952-1999 | Henan and Shandong provinces | Province | ||
| Amount of fertilizer applied | 1952-1990 | Henan province | Province | ||