×
模态框(Modal)标题
在这里添加一些文本
关闭
关闭
提交更改
取消
确定并提交
×
模态框(Modal)标题
×
期刊
文章
图表
检索
EN
中文
首页
关于期刊
期刊介绍
数据库收录
期刊荣誉
编委会
投稿指南
在线期刊
当期目录
优先出版
过刊浏览
推荐文章
专题
按栏目浏览
阅读排行
下载排行
引用排行
E-mail Alert
RSS
期刊订阅
广告合作
联系我们
EN
中文
图/表 详细信息
“Bundling regions” based optimization of planting structure for water conservation in the Yellow River Basin
SHEN Yilin, MA Qingtao, GUO Ying, CHEN Xiaolu, LIU Mengzhu, DENG Lu, ZHU Yiding, SHEN Yanjun
地理学报(英文版), 2026, 36(
3
): 669-689. DOI:
10.1007/s11442-026-2465-1
Sown area (10
3
ha)
Yield (10
4
tons)
Irrigation water demand (10
8
m
3
)
Wheat
Maize
Wheat
Maize
Wheat
Maize
Actual
847.85
976.40
241.47
612.37
26.91
30.33
Optimized
852.83
895.97
240.89
559.37
26.50
27.86
Table 2
Annual average sown area, yield, and irrigation water demand of wheat and maize in key regions before and after optimization
本文的其它图/表
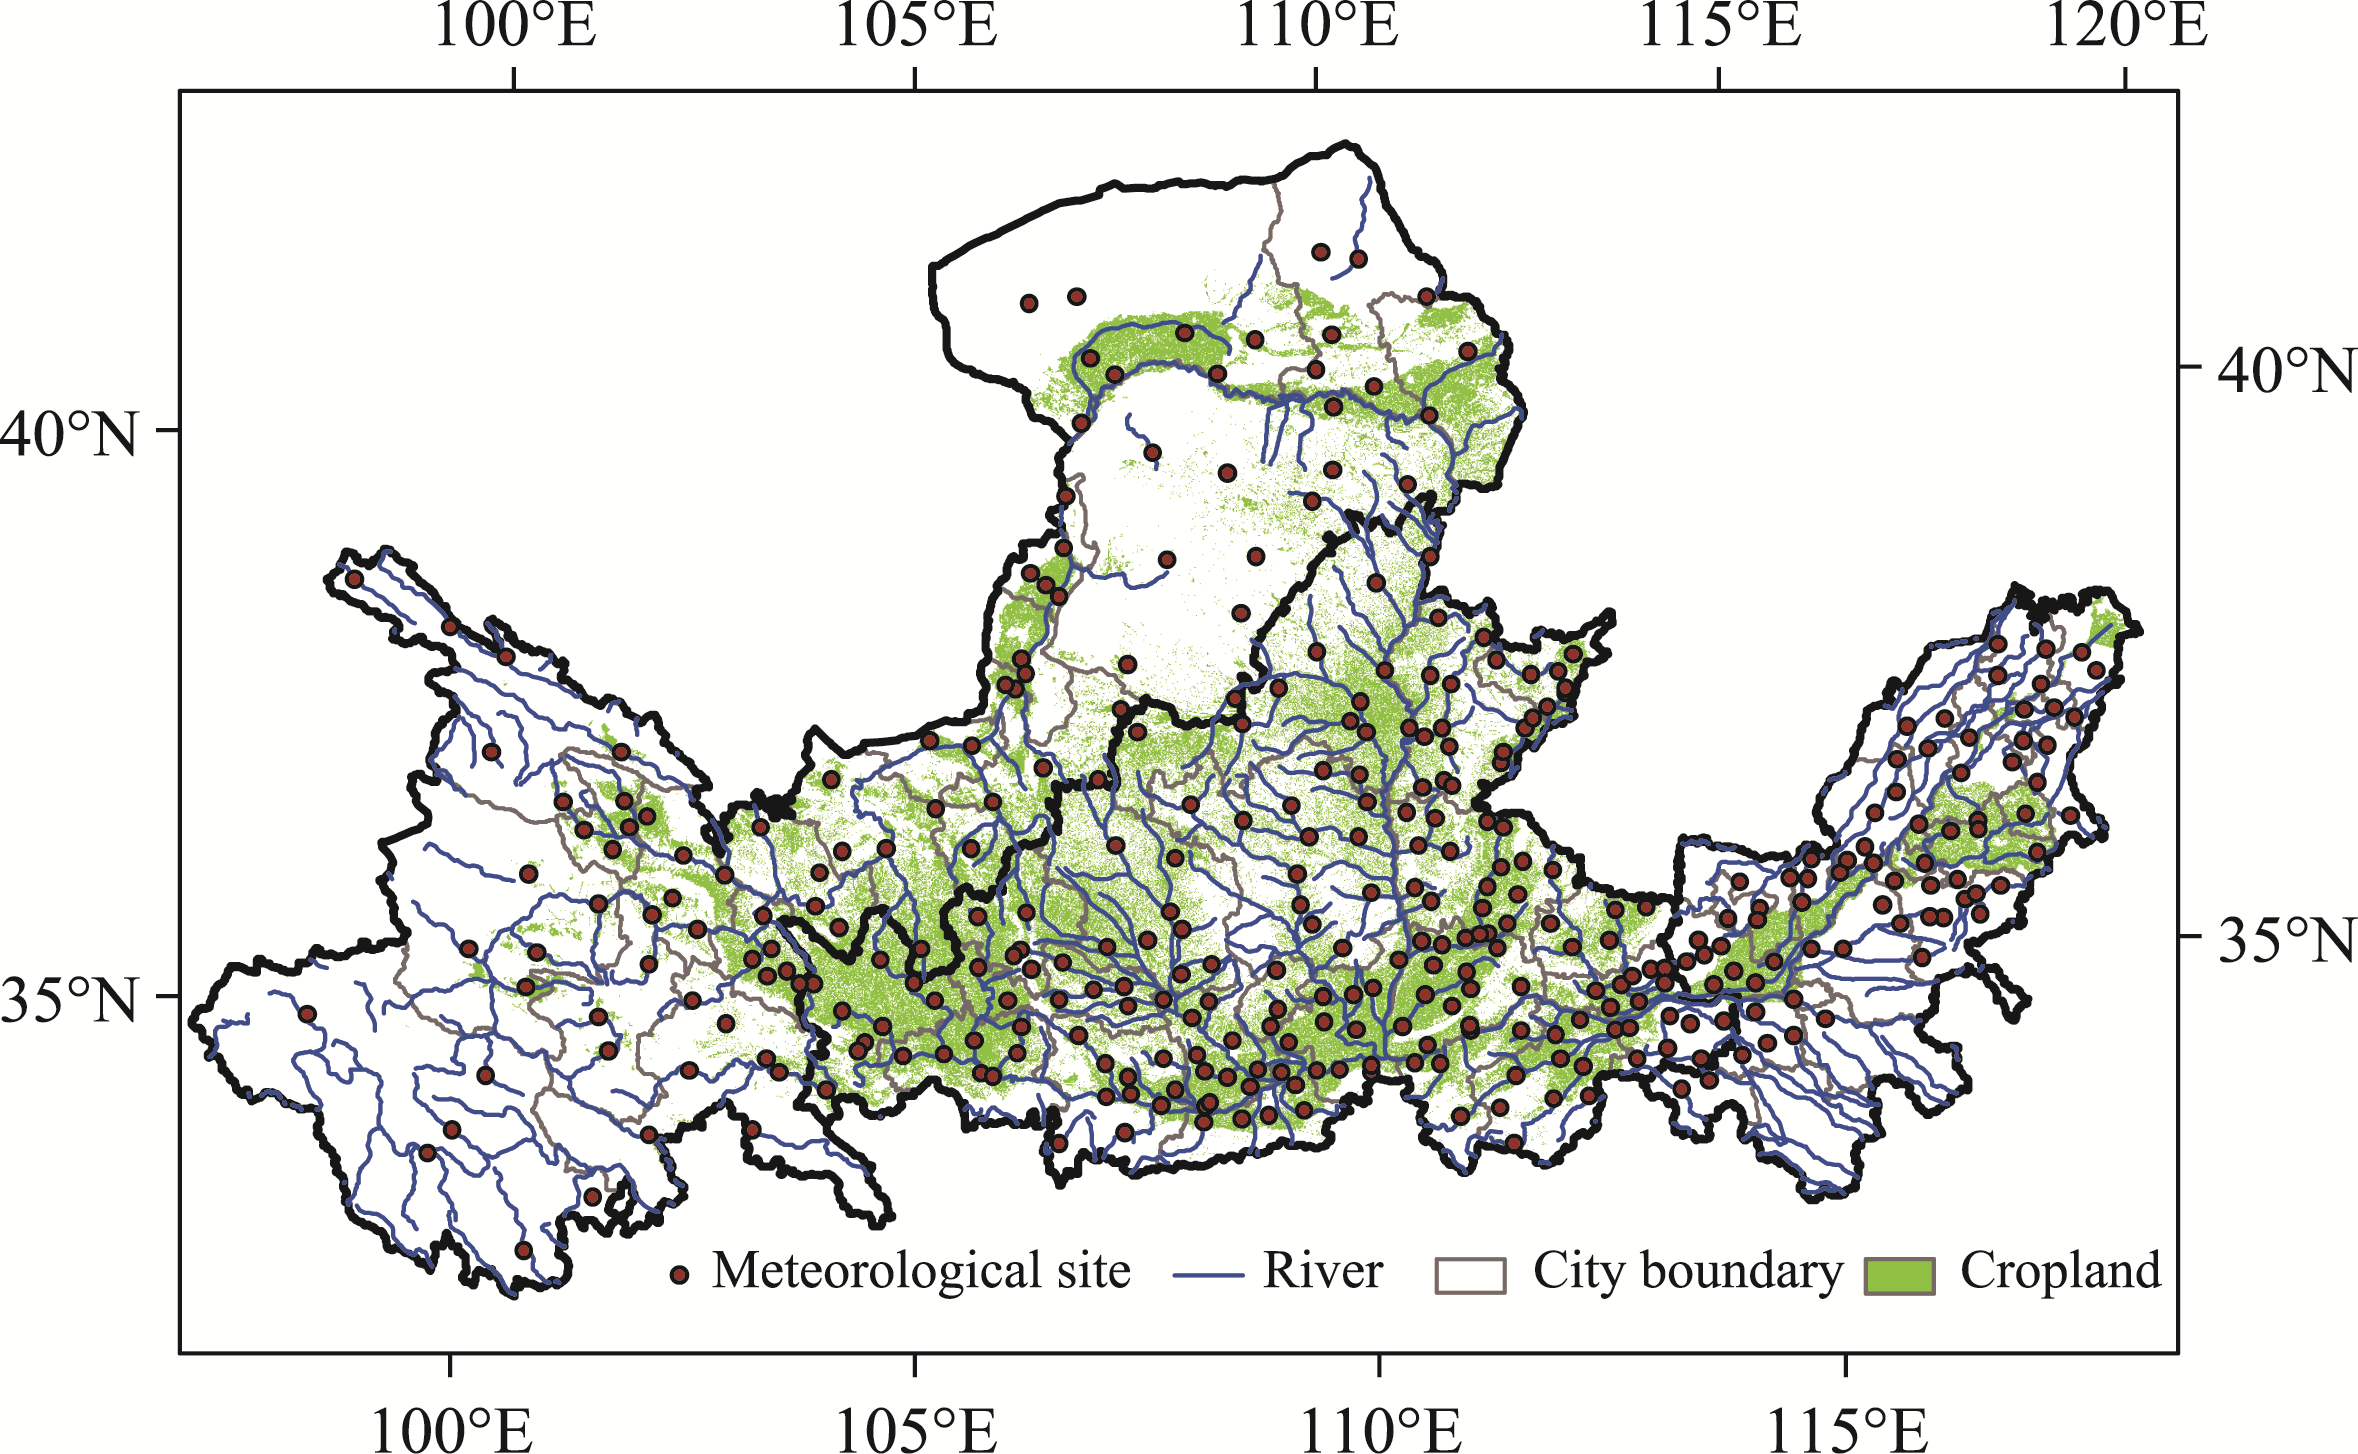
Figure 1
Location of the study area (Yellow River Basin)
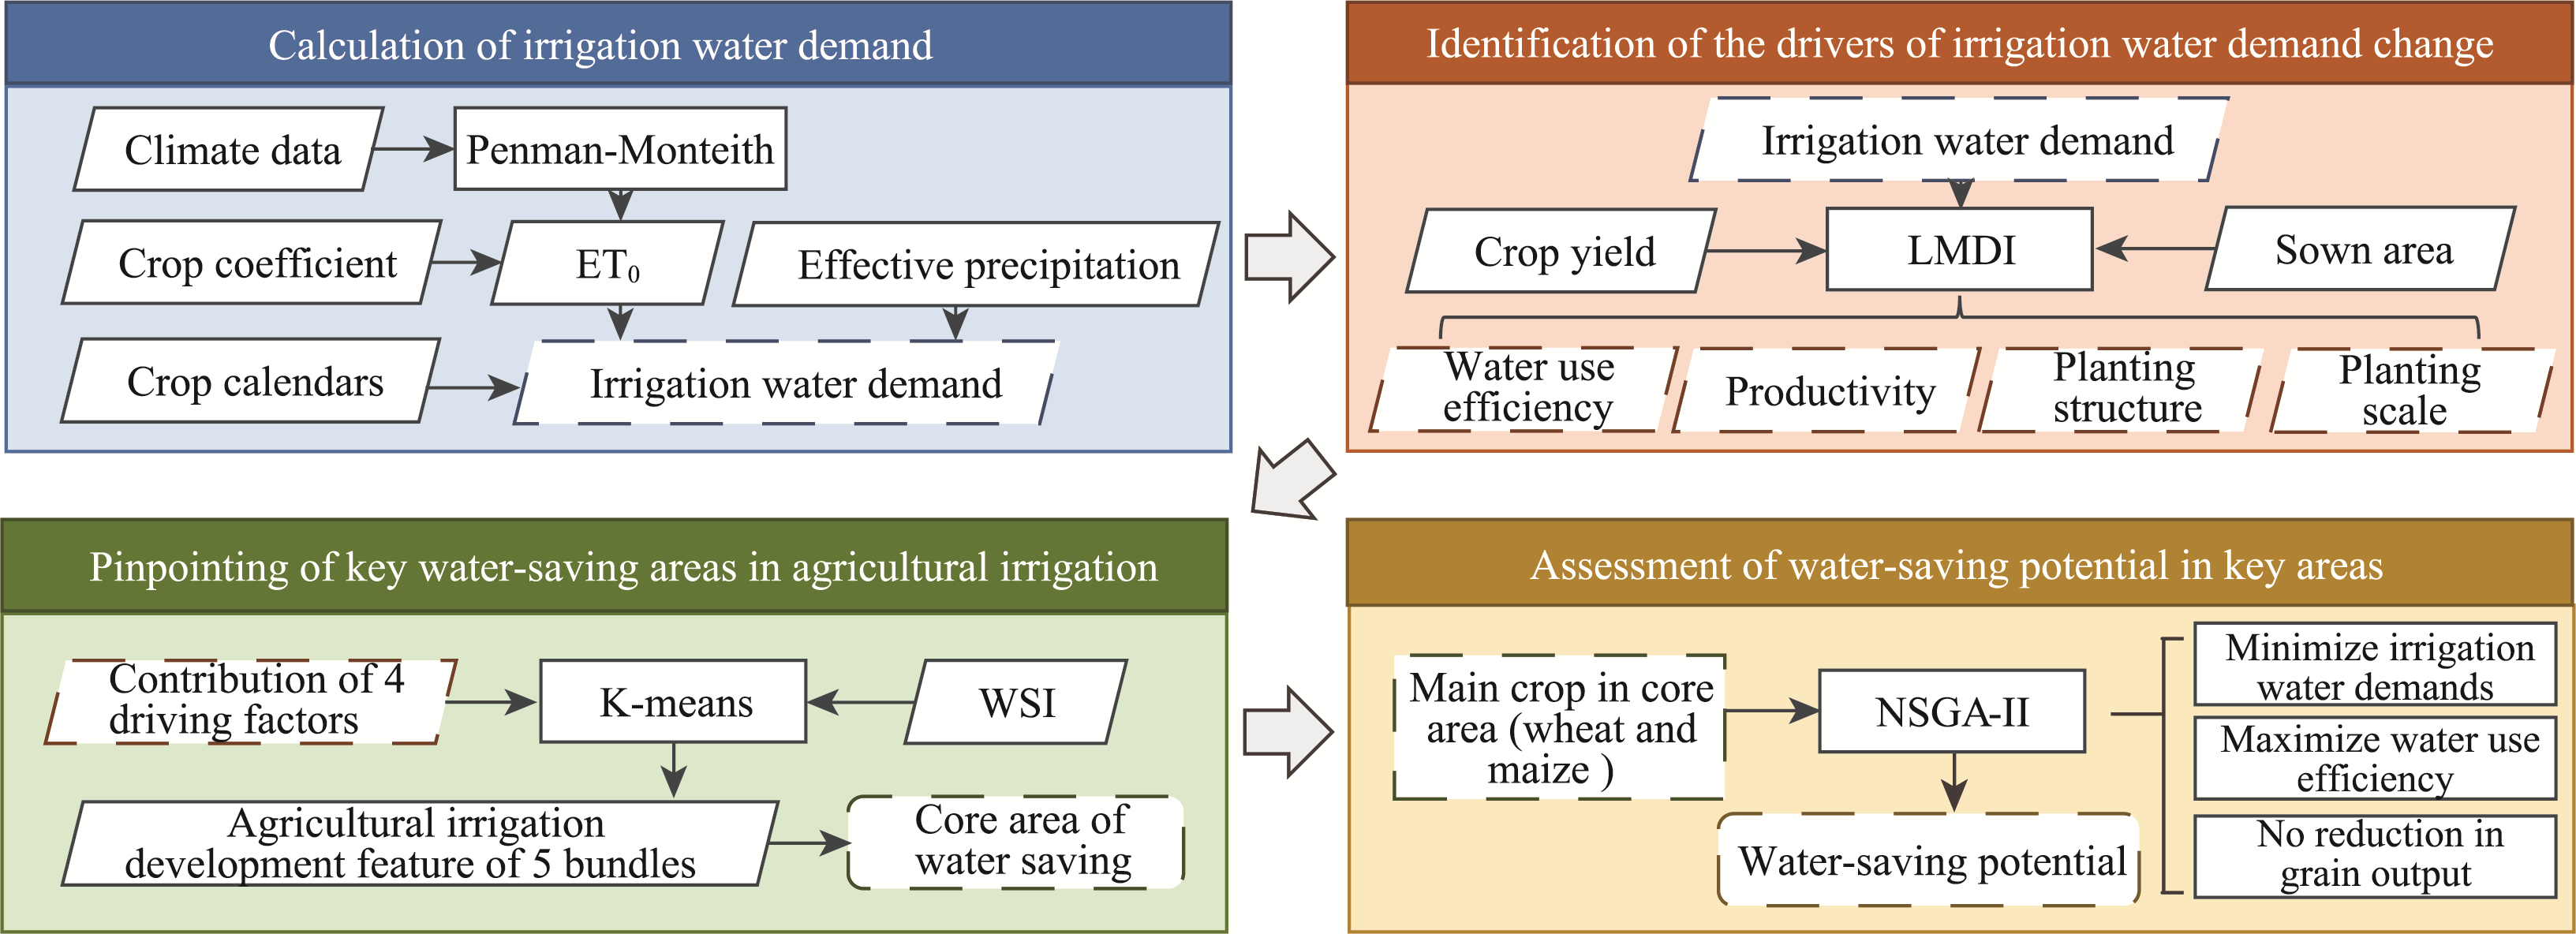
Figure 2
Flow chart
Table 1
Definition and explanation of driving factors for changes in irrigation water demand
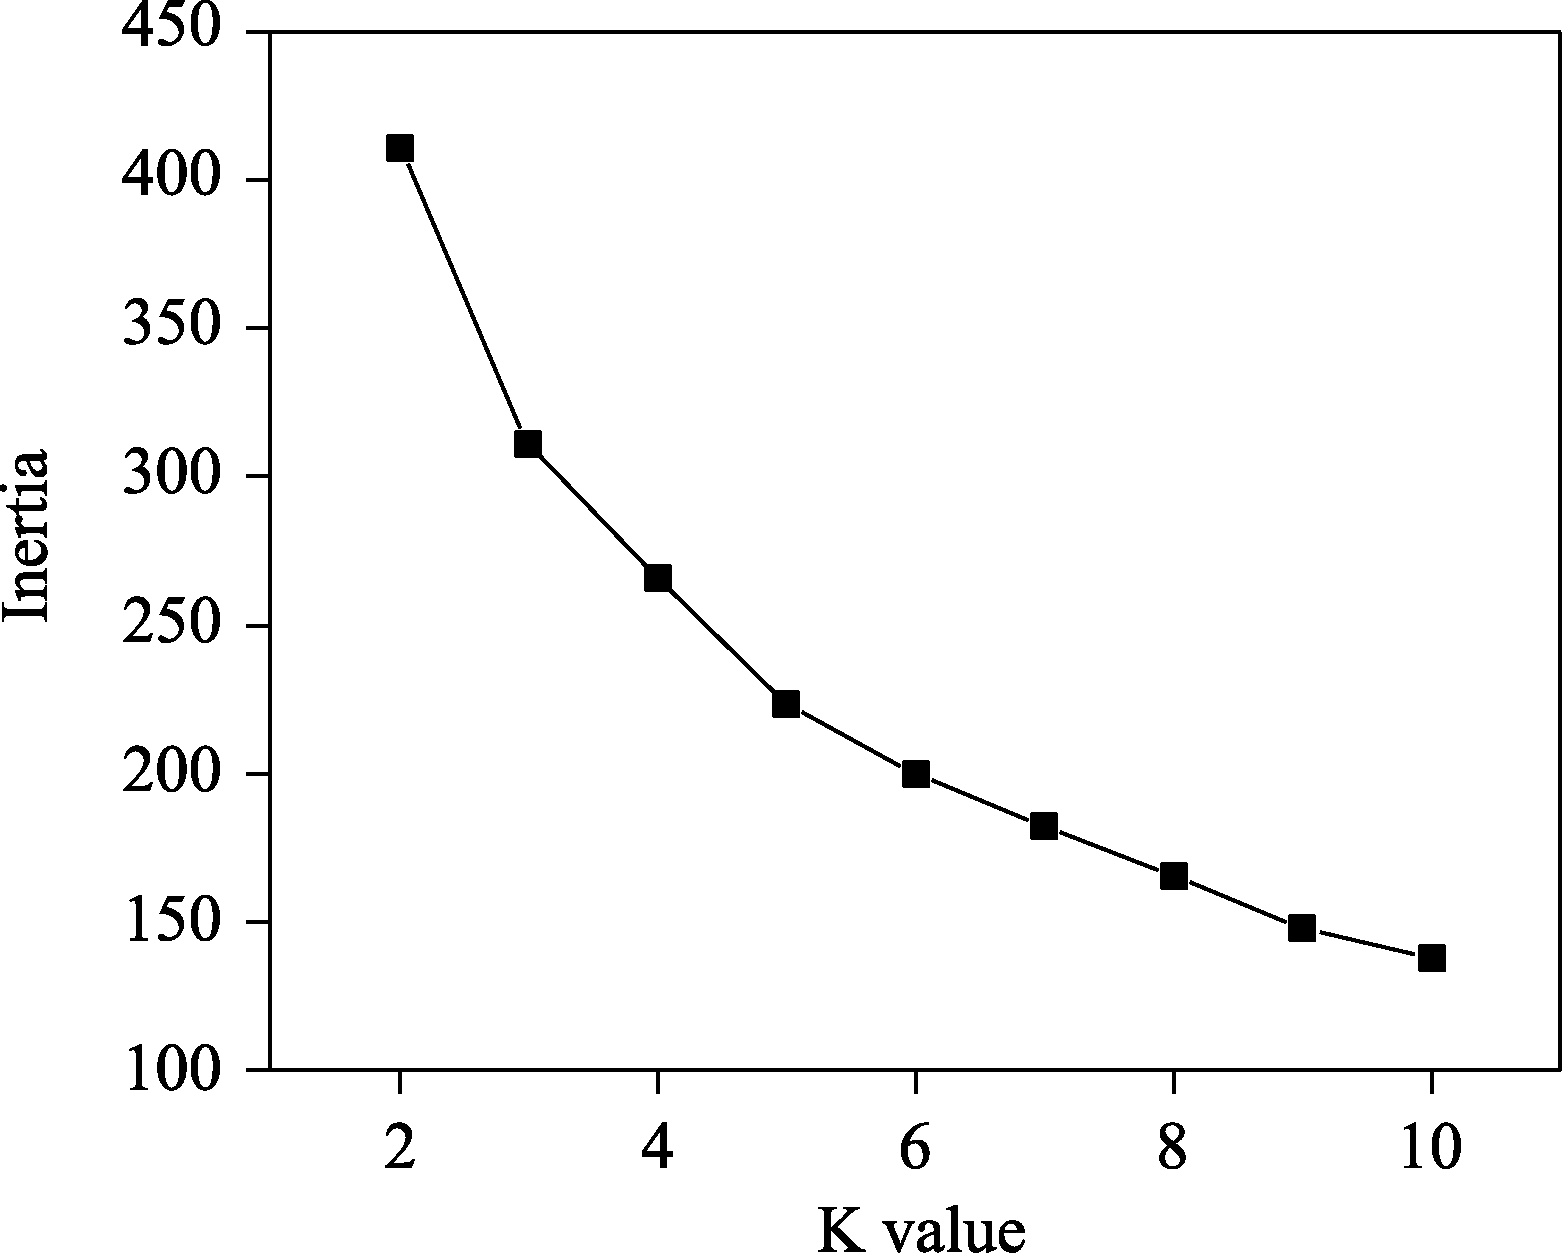
Figure 3
Determining the number of clusters using the elbow method
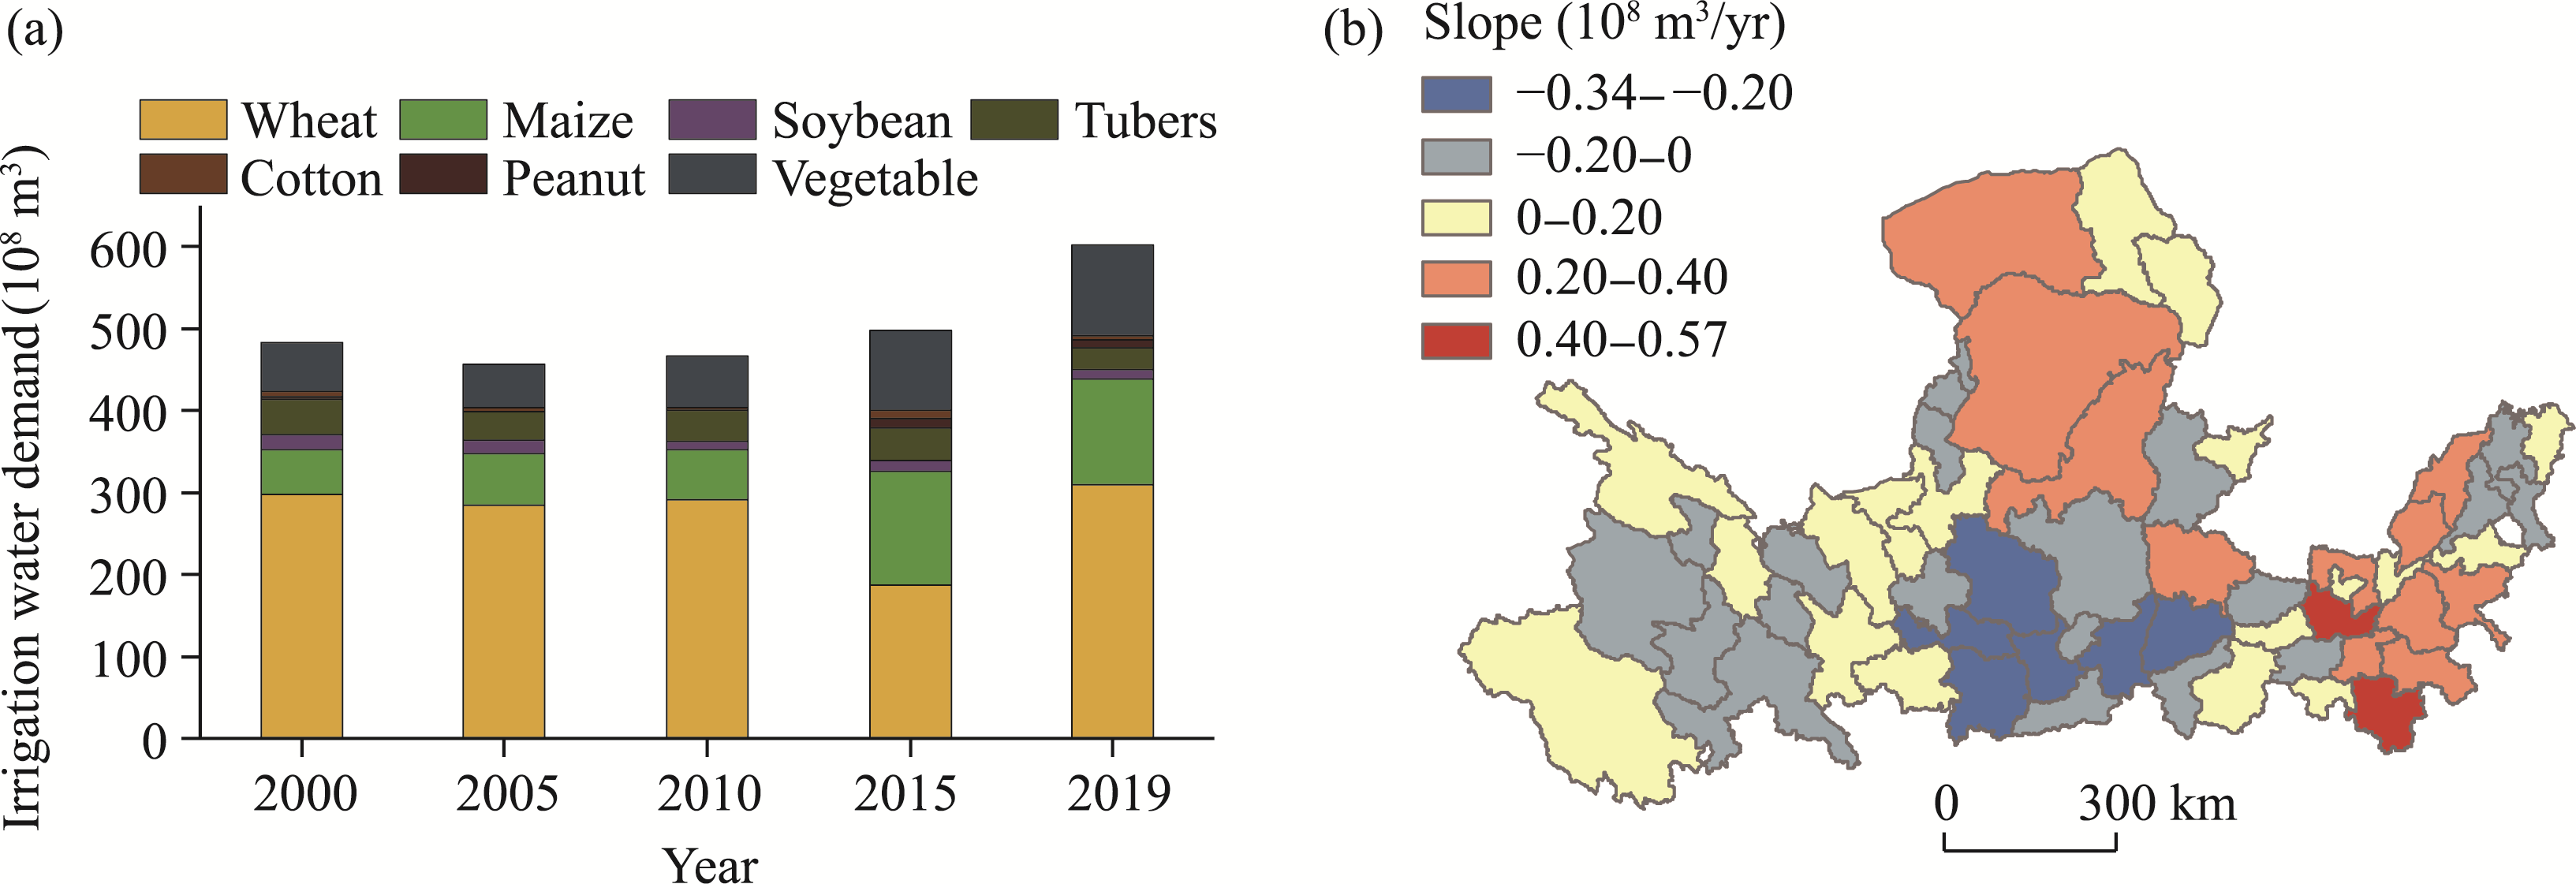
Figure 4
Spatiotemporal variations of irrigation water demand in the Yellow River Basin (The trends of irrigation water demand changes were obtained from data from the years 2000, 2005, 2010, 2015 and 2019.)
Figure 5
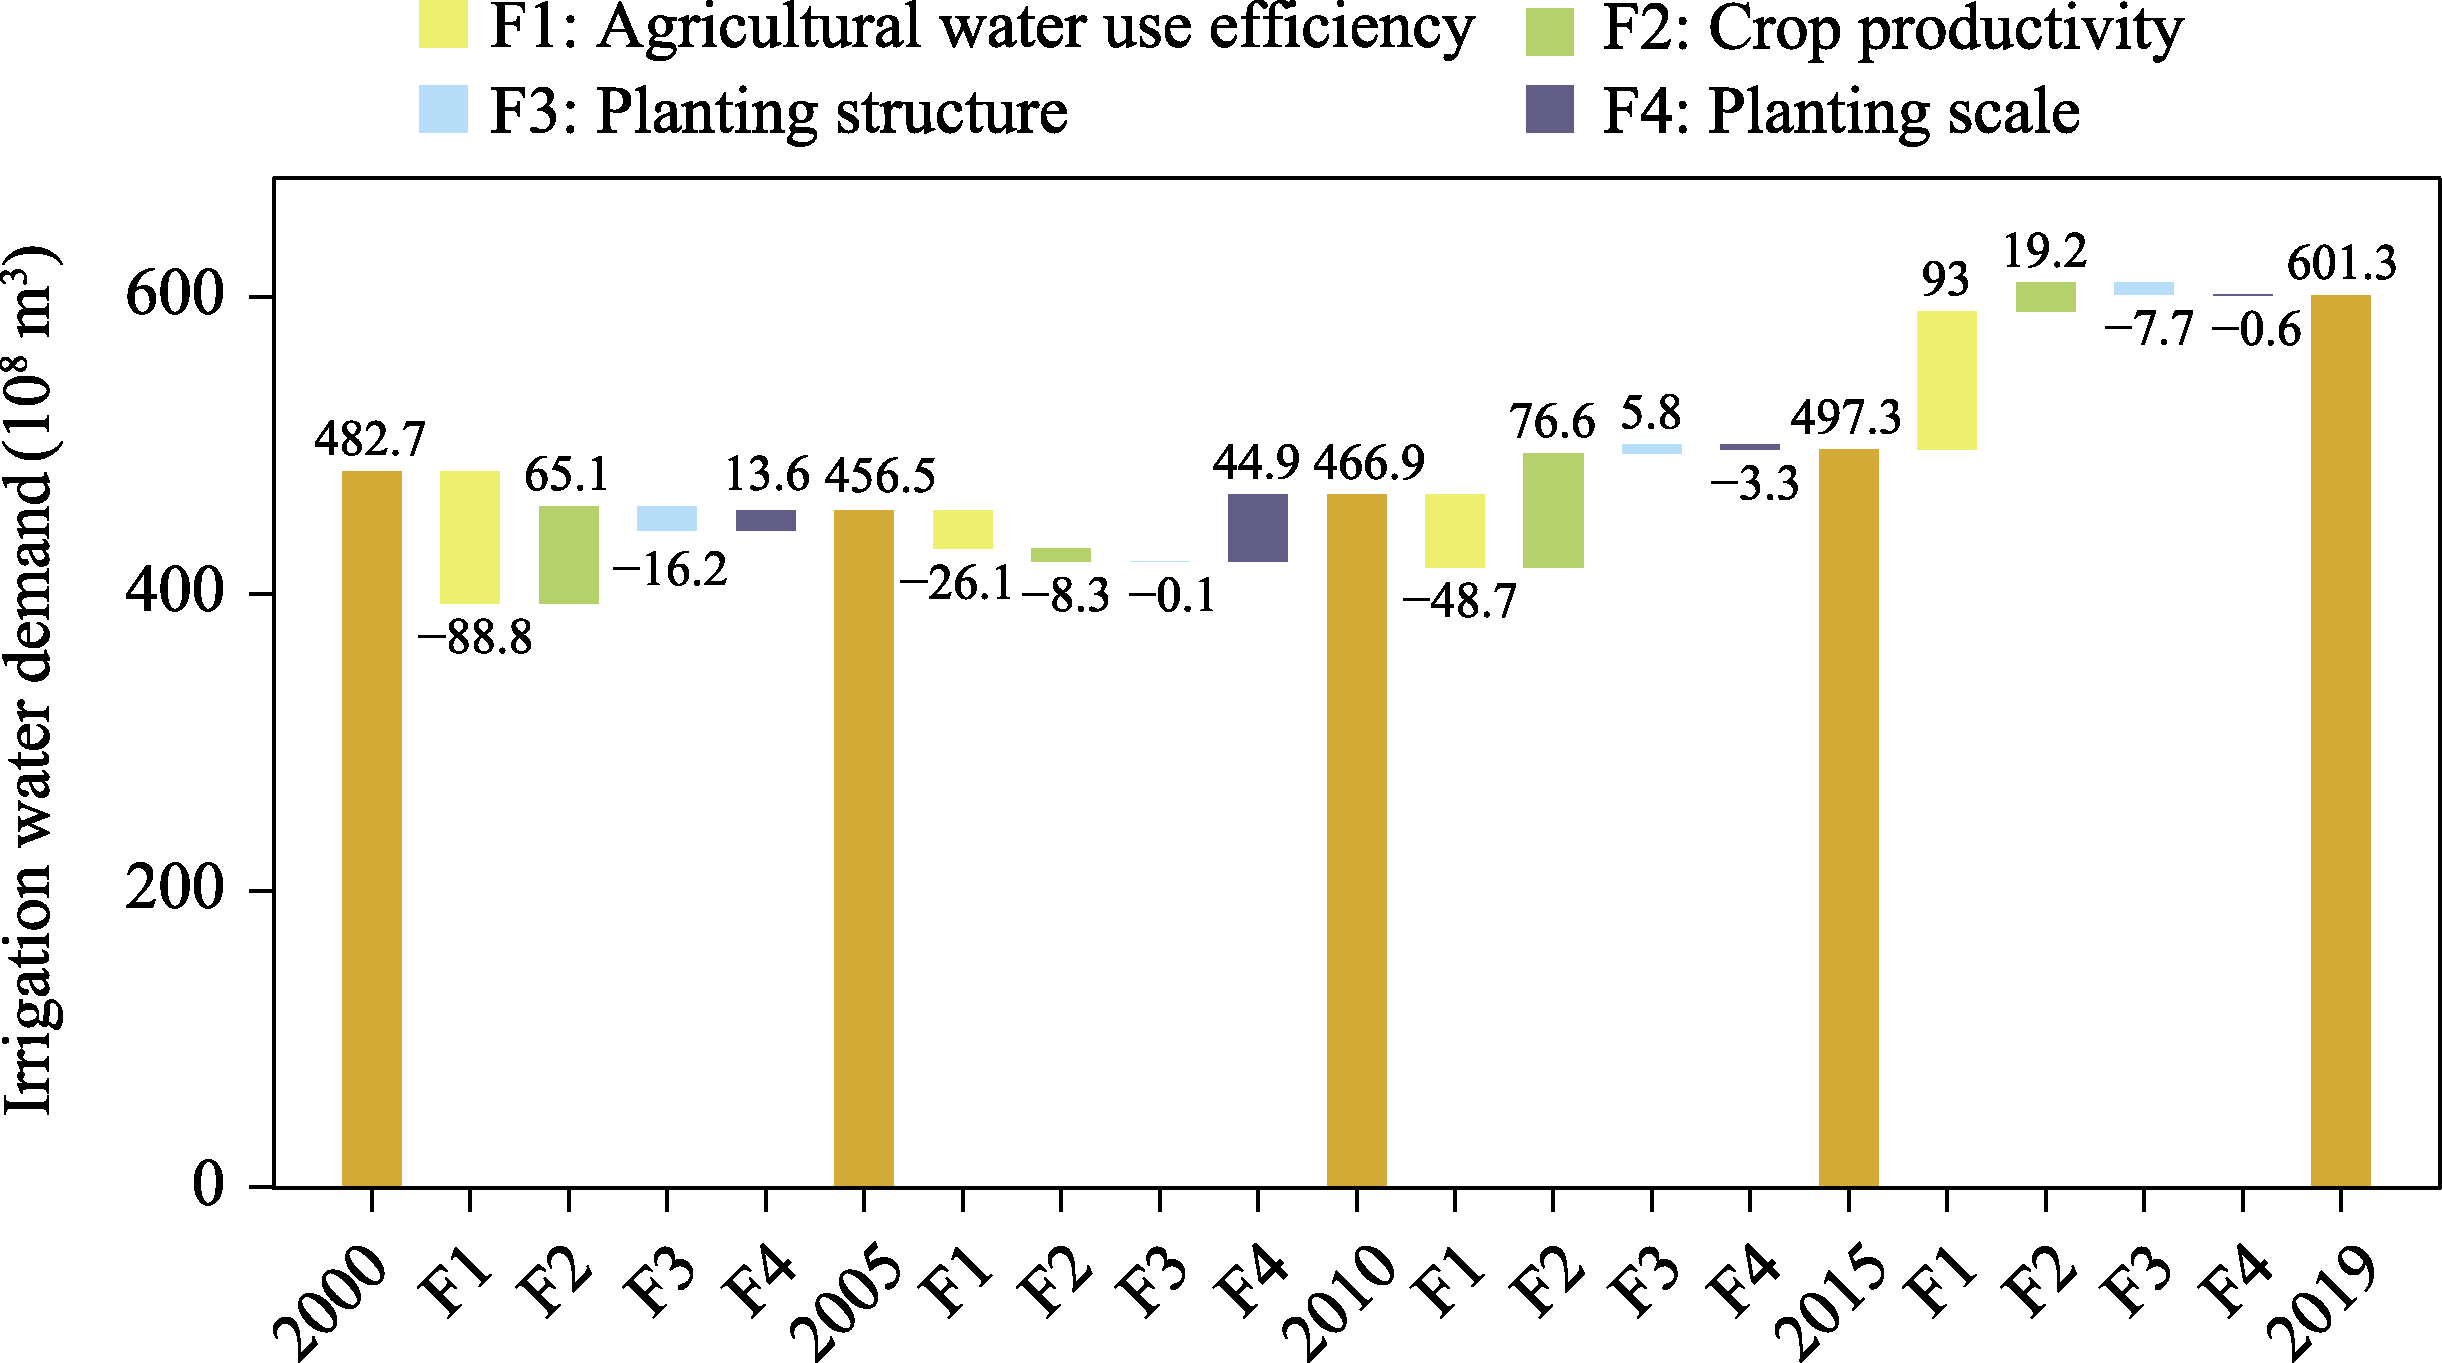
Contributions of agricultural water use efficiency changes, yield per unit area, cropping patterns, and planting scale to irrigation water demand
Figure 6
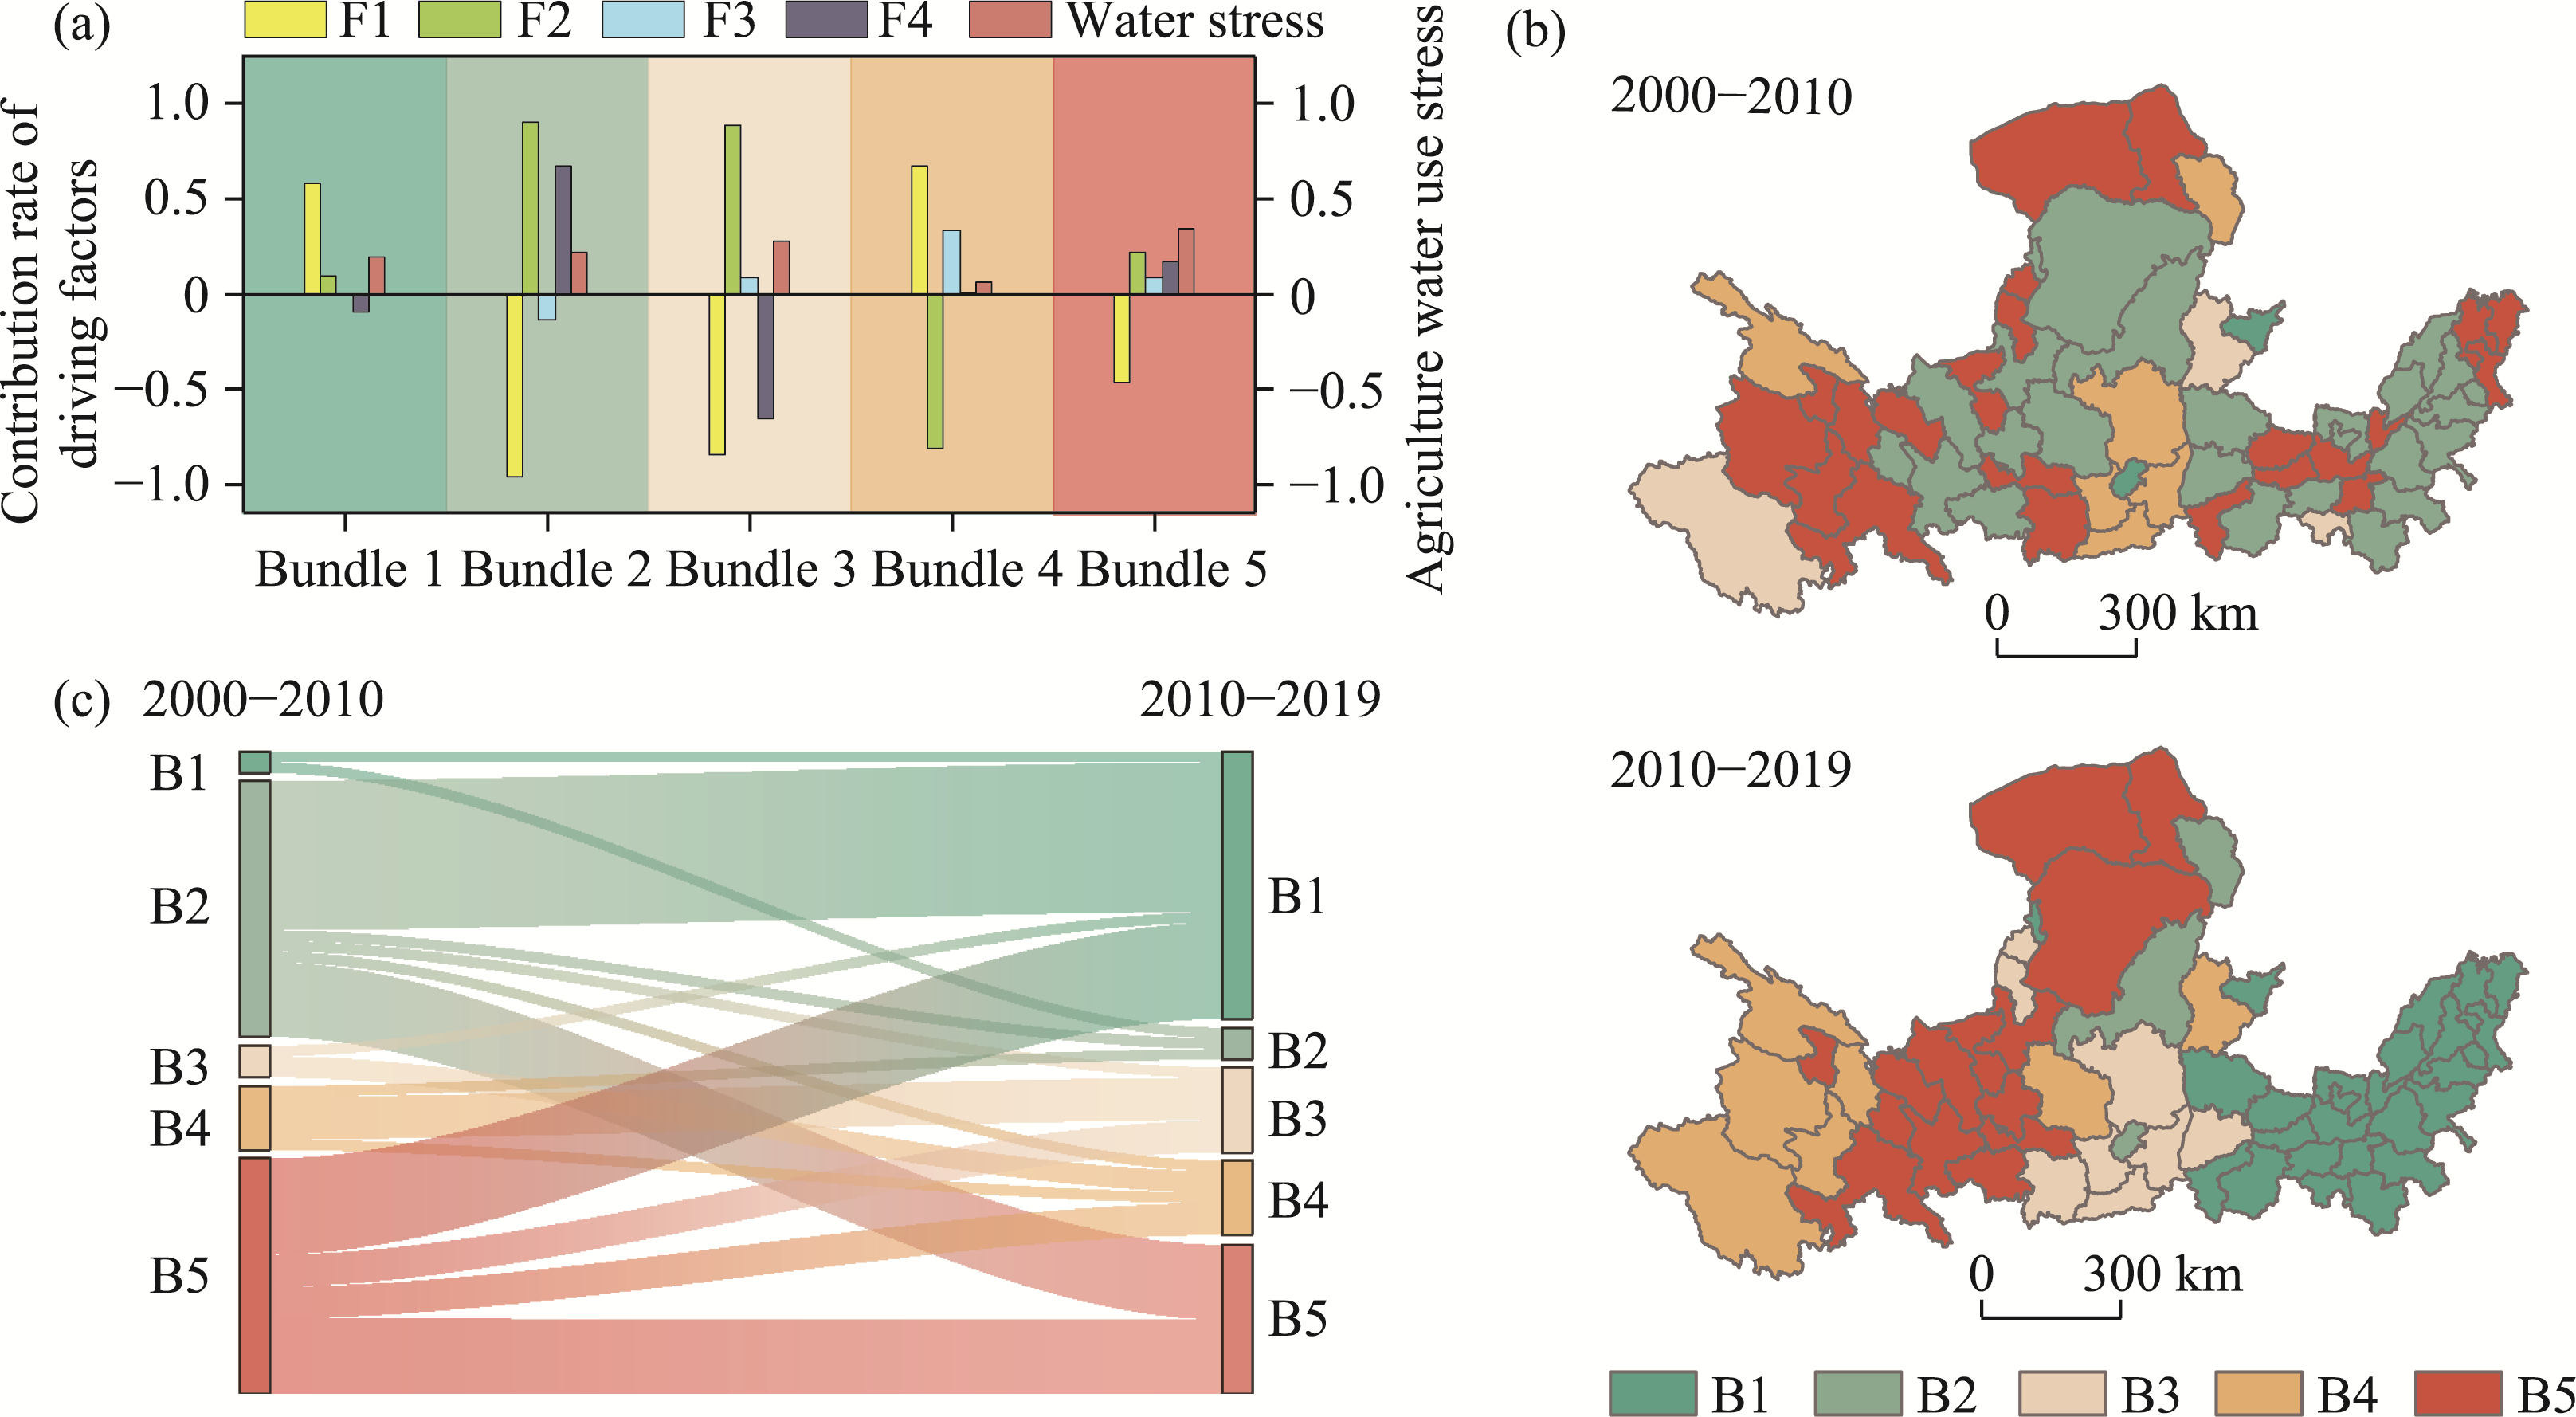
Spatiotemporal variation characteristics of irrigation water demand driving zones in the Yellow River Basin: (a) Irrigation water demand driving characteristics of each zone; (b) spatial distribution of each zone during the periods 2000-2010 and 2010-2019; (c) change trajectories of city zones within the two periods
Figure 7
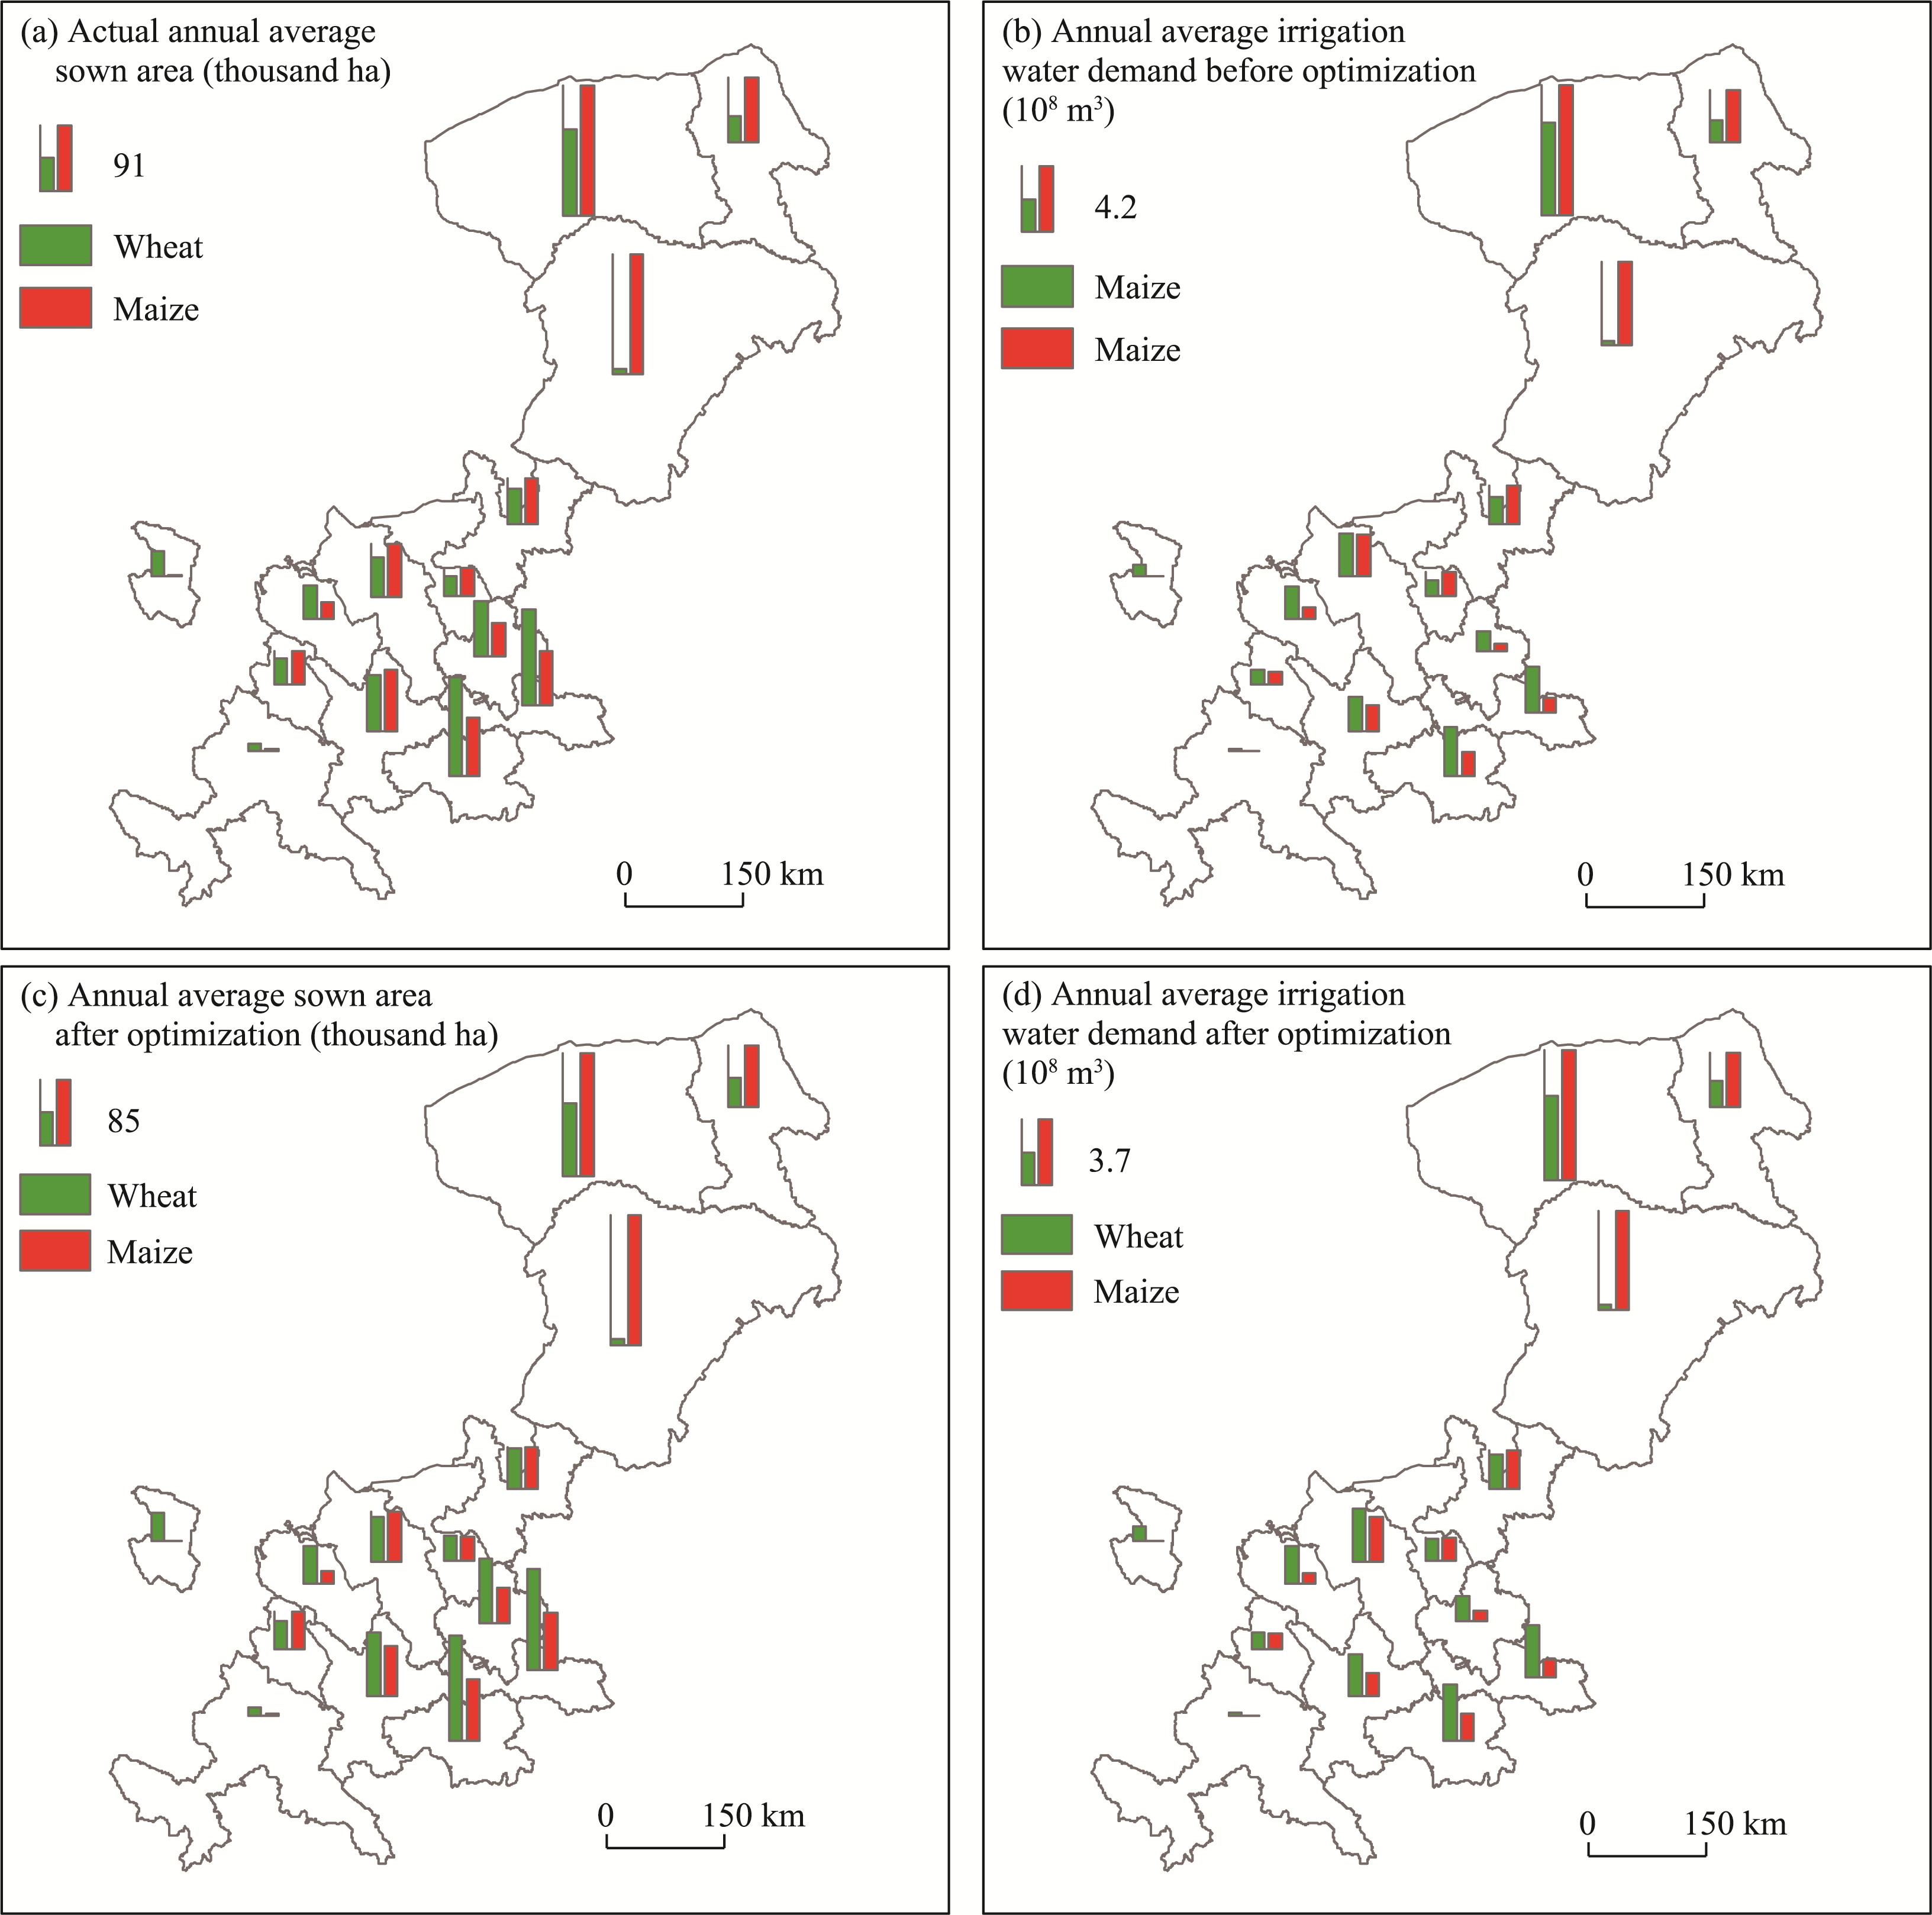
Annual average sown area (a), annual average irrigation water demand for wheat and maize (b), annual average sown area after optimization (c), annual average irrigation water demand for wheat and maize after optimization (d) in key agricultural water-saving zone (prefecture-level cities of the upper Yellow River Basin transition from B2 to B5 and persistent B5 classification)
Figure S1
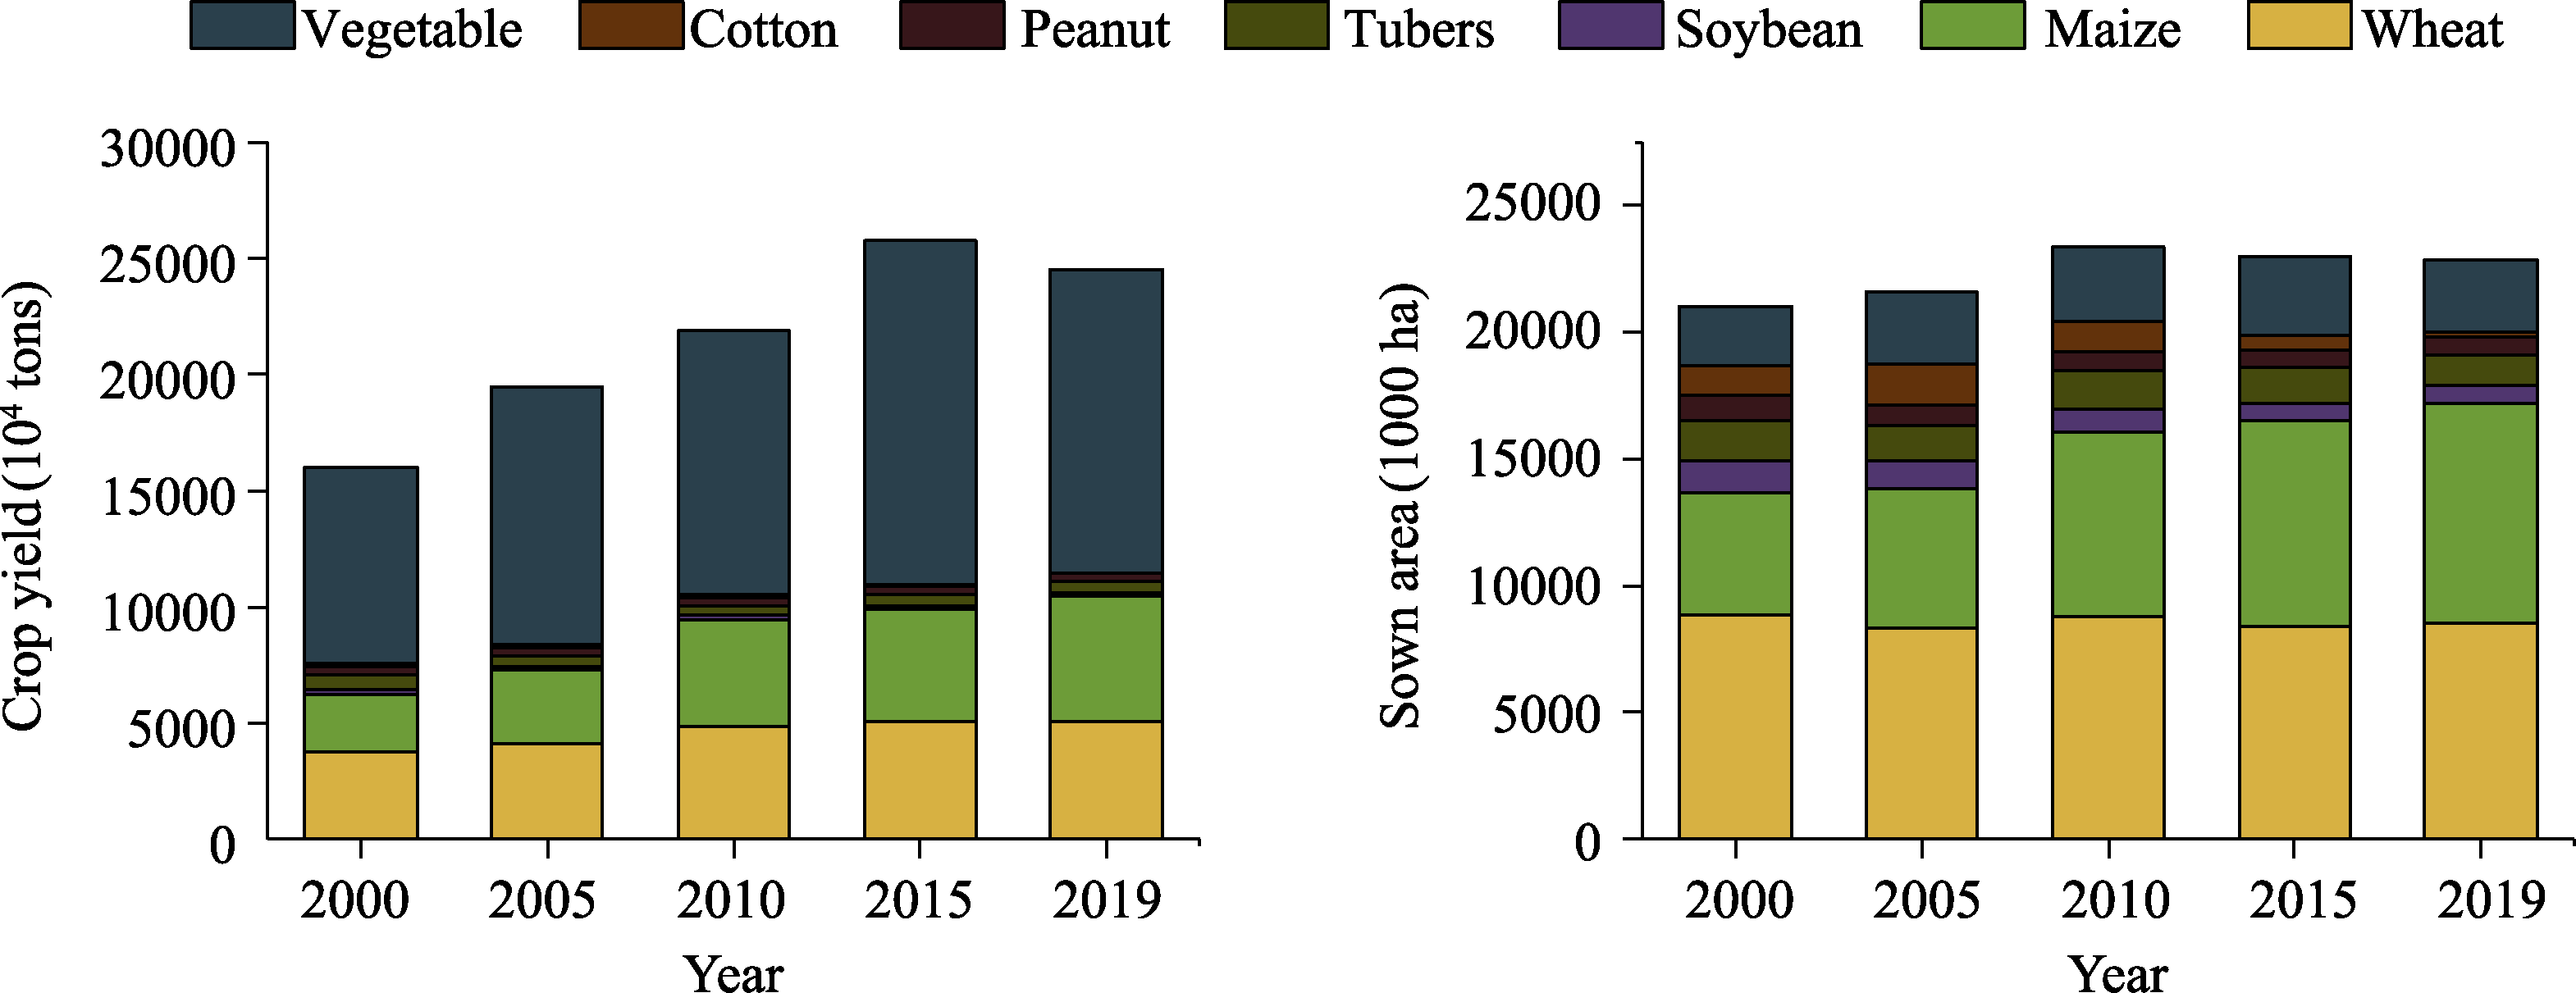
Changes in yield and sown area of different crops in the Yellow River Basin
Table S1
Crop coefficient of spring wheat
Table S2
Crop coefficient of winter wheat
Table S3
Crop coefficient of spring maize
Table S4
Crop coefficient of summer maize
Table S5
Crop coefficient of cotton
Table S6
Crop coefficient of peanut
Table S7
Crop coefficient of soybean
Table S8
Crop coefficient of tubers (Using the sweet potatoes to represent the tubers)
Figure S2
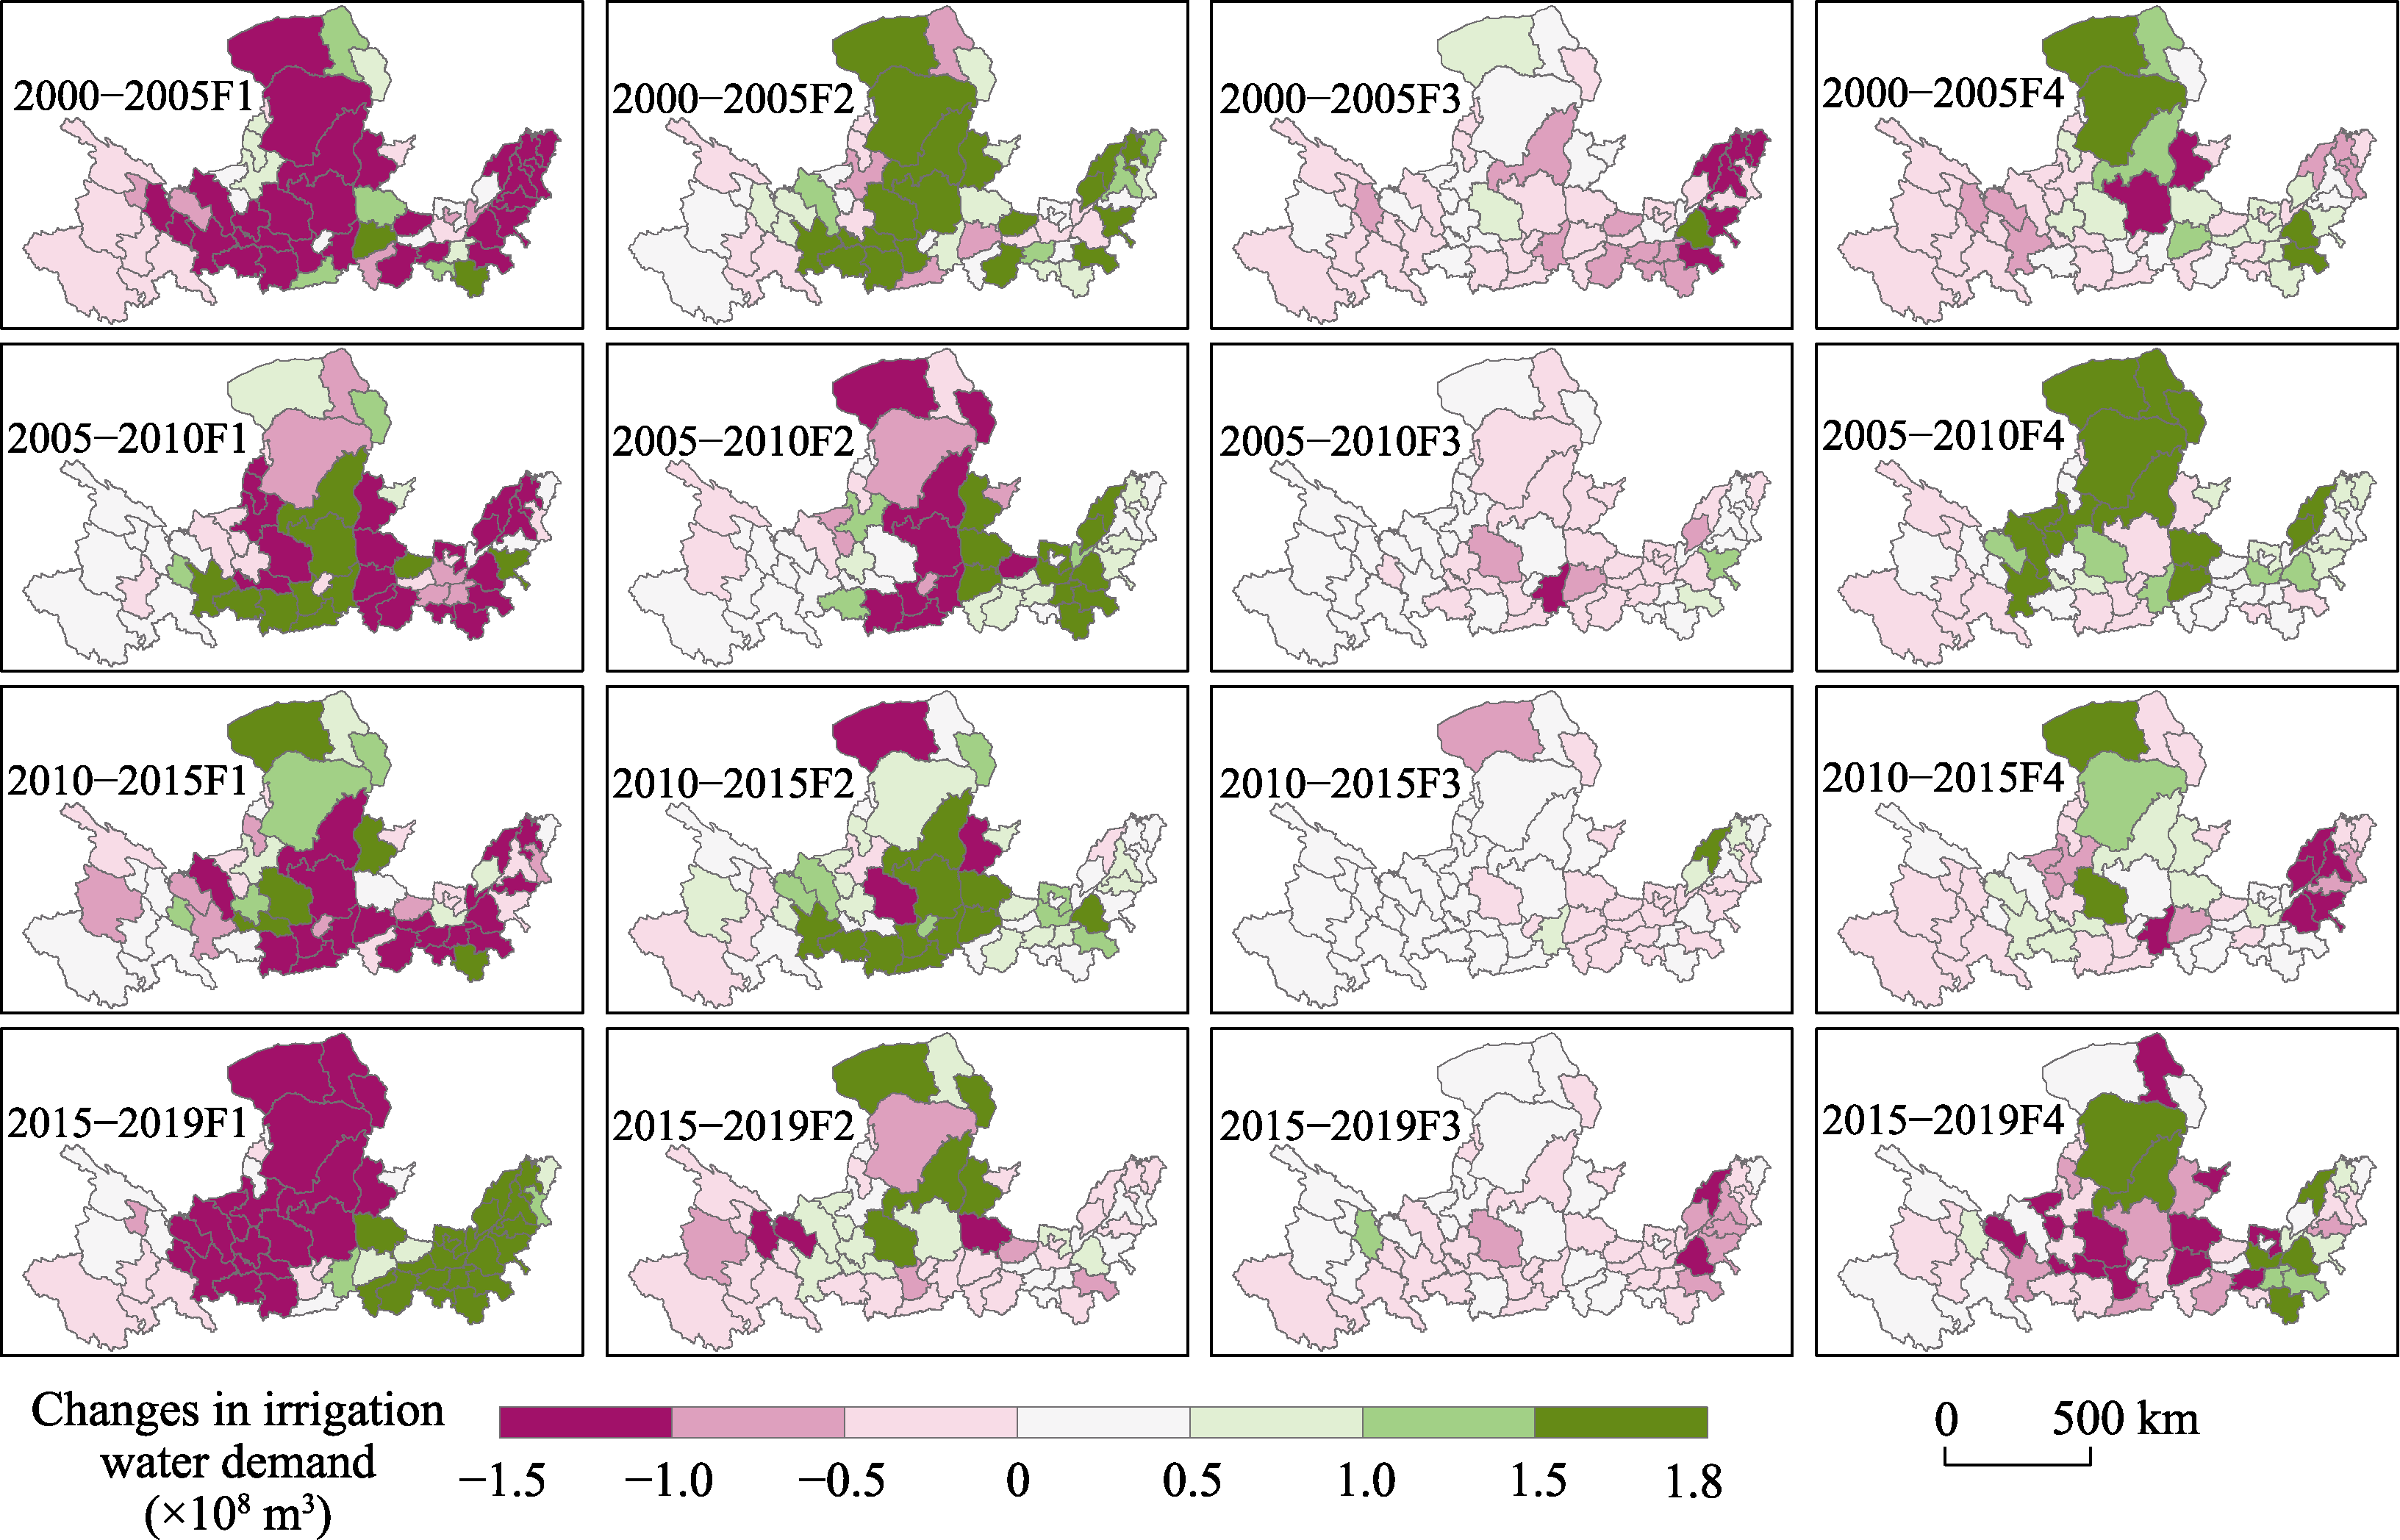
Spatial distribution of driving factors (values scaled to the 90th percentile to highlight spatial gradients; extreme values beyond this threshold are uniformly represented within the upper and lower color.)
Table S9
The naming and interpretation of each bundle