×
模态框(Modal)标题
在这里添加一些文本
关闭
关闭
提交更改
取消
确定并提交
×
模态框(Modal)标题
×
期刊
文章
图表
检索
EN
中文
首页
关于期刊
期刊介绍
数据库收录
期刊荣誉
编委会
投稿指南
在线期刊
当期目录
优先出版
过刊浏览
推荐文章
专题
按栏目浏览
阅读排行
下载排行
引用排行
E-mail Alert
RSS
期刊订阅
广告合作
联系我们
EN
中文
图/表 详细信息
Multidimensional and multiscenario assessment for cropland supply‒demand matches and sustainable development zoning
JIANG Zixin, LI Sinan, WANG Zhennan, ZHU Congmou, CHEN Yun, WANG Ke, ZHANG Jing
地理学报(英文版), 2025, 35(
12
): 2536-2558. DOI:
10.1007/s11442-025-2424-2
Rations
Meat
Poultry
Aquatic products
Eggs
Milk
Industry
Seeds
Oil
Vegetable
Sugar
Fruits
Grain self-
sufficiency (%)
37.21
16.31
5.74
2.76
4.36
1.12
11.83
0.09
16.25
3.51
0.14
1.76
100.44
Table 3
China’s total cropland footprint structure in 2022 (Mha)
本文的其它图/表
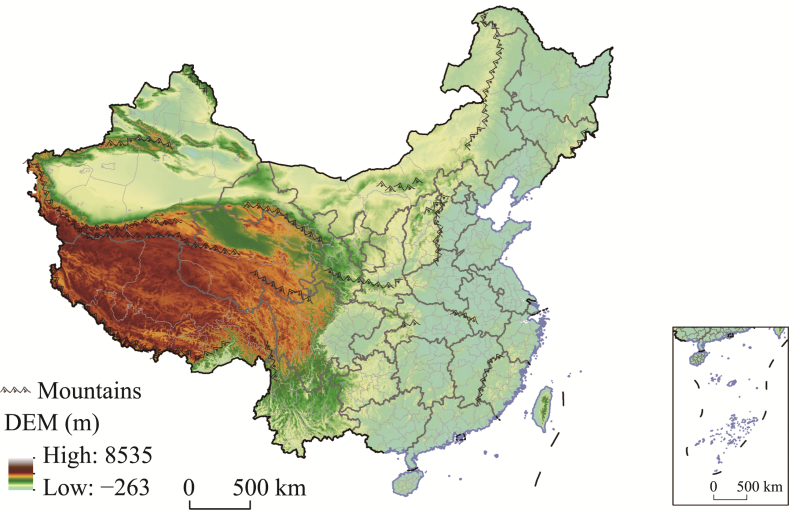
Figure 1
Study area and locations of the sampling sites in China
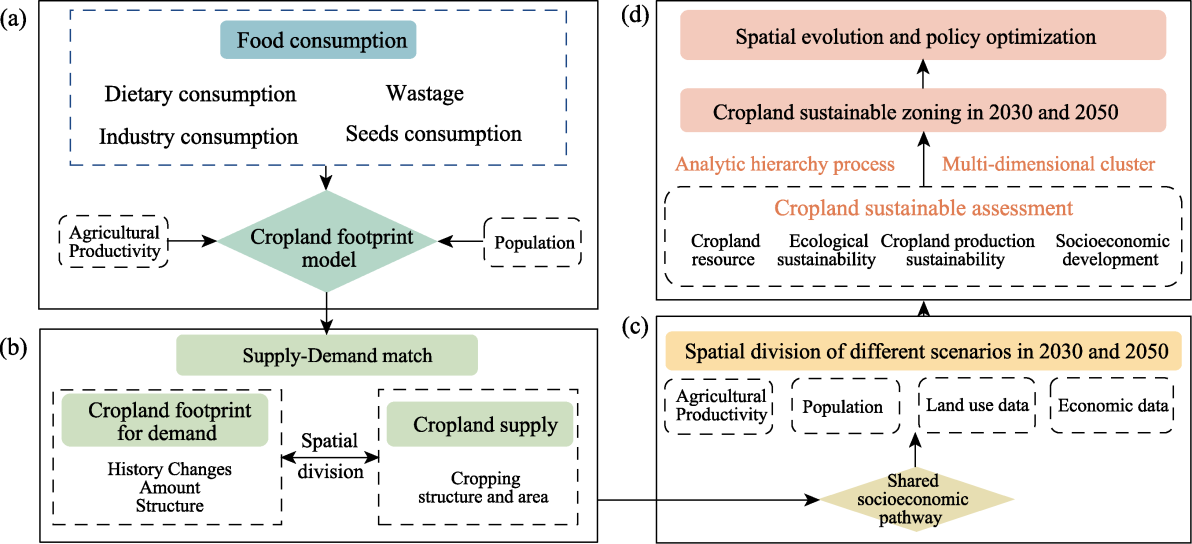
Figure 2
Study design
Table 1
Dining-out consumption factor K
i
and conversion factor R
i
Table 2
Cropland sustainability assessment
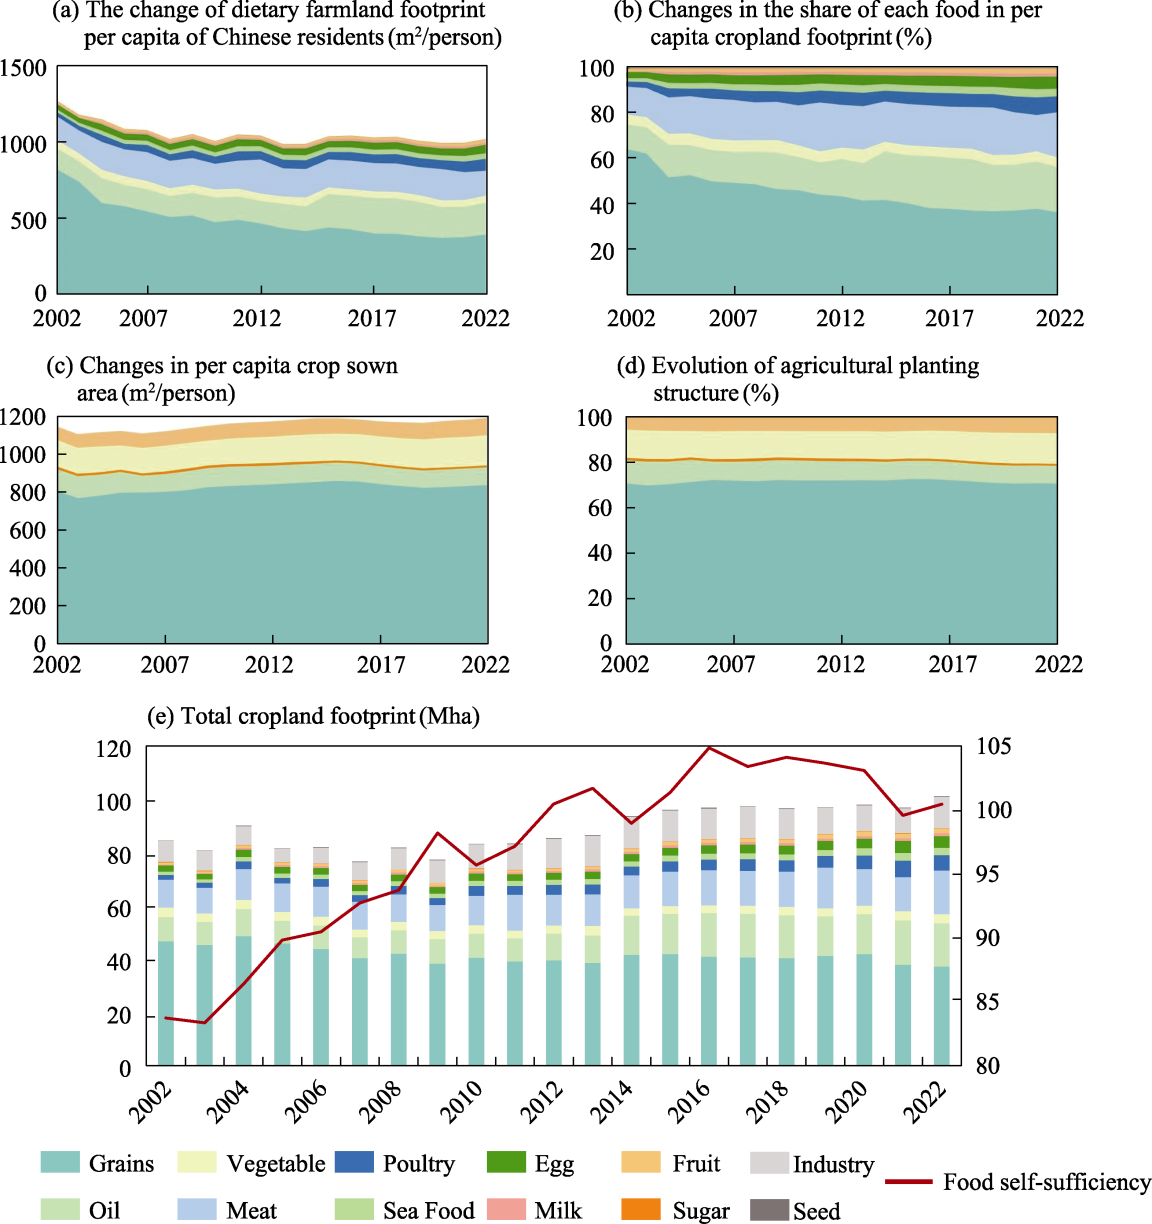
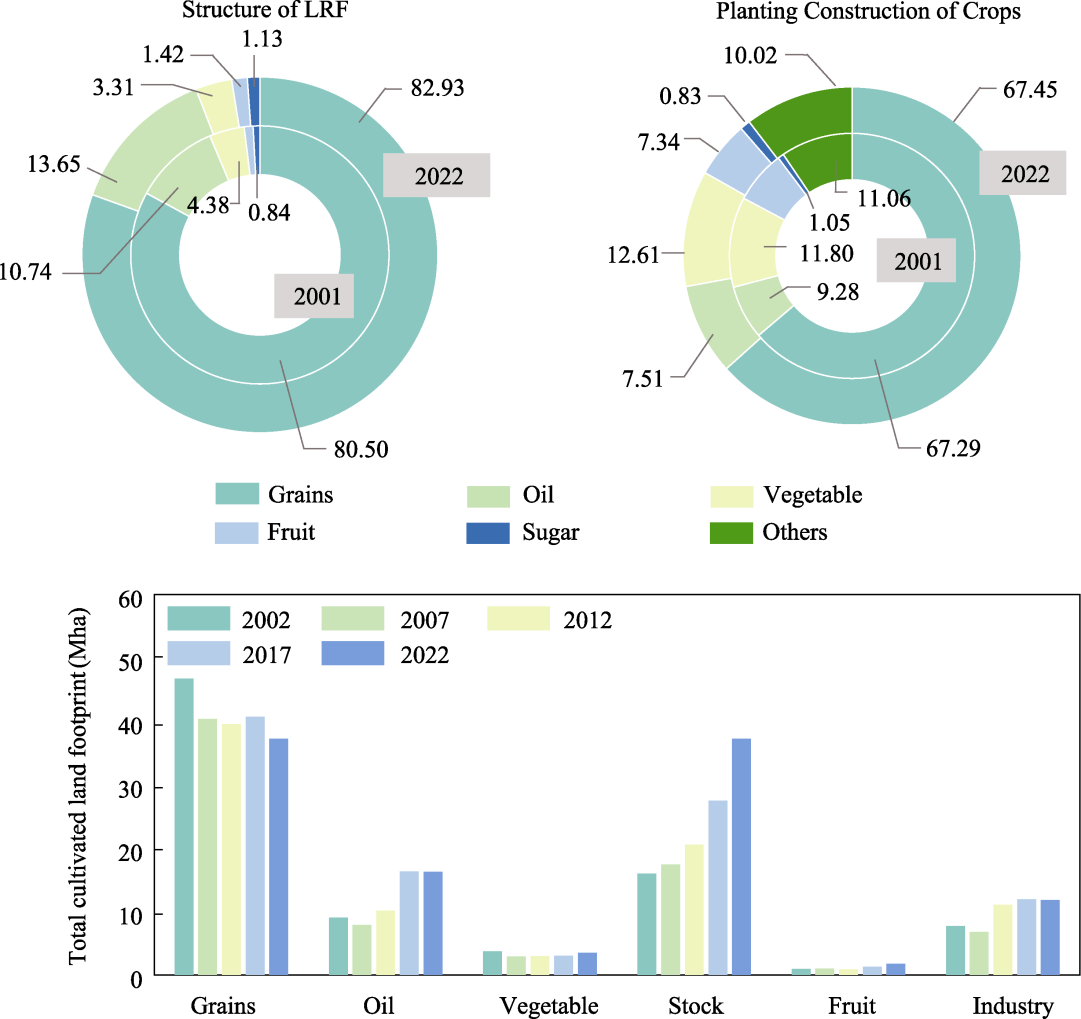
Figure 3
Changes in the per capita cropland footprint and changes in the cropland cropping structure from 2002 to 2022
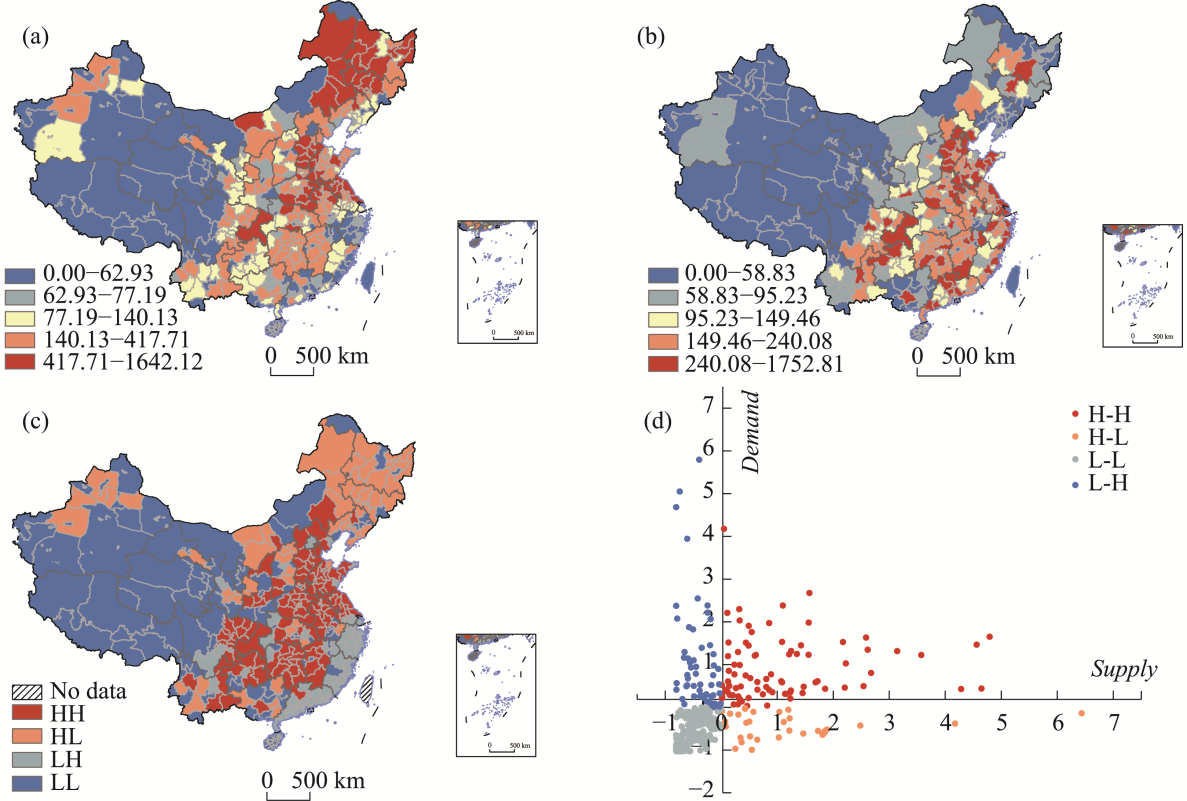
Figure 4
Spatial patterns of the supply and demand of cropland (a. supply, b. demand, c. supply‒demand matches, d. quadrant diagram distribution of cropland supply‒demand matches)
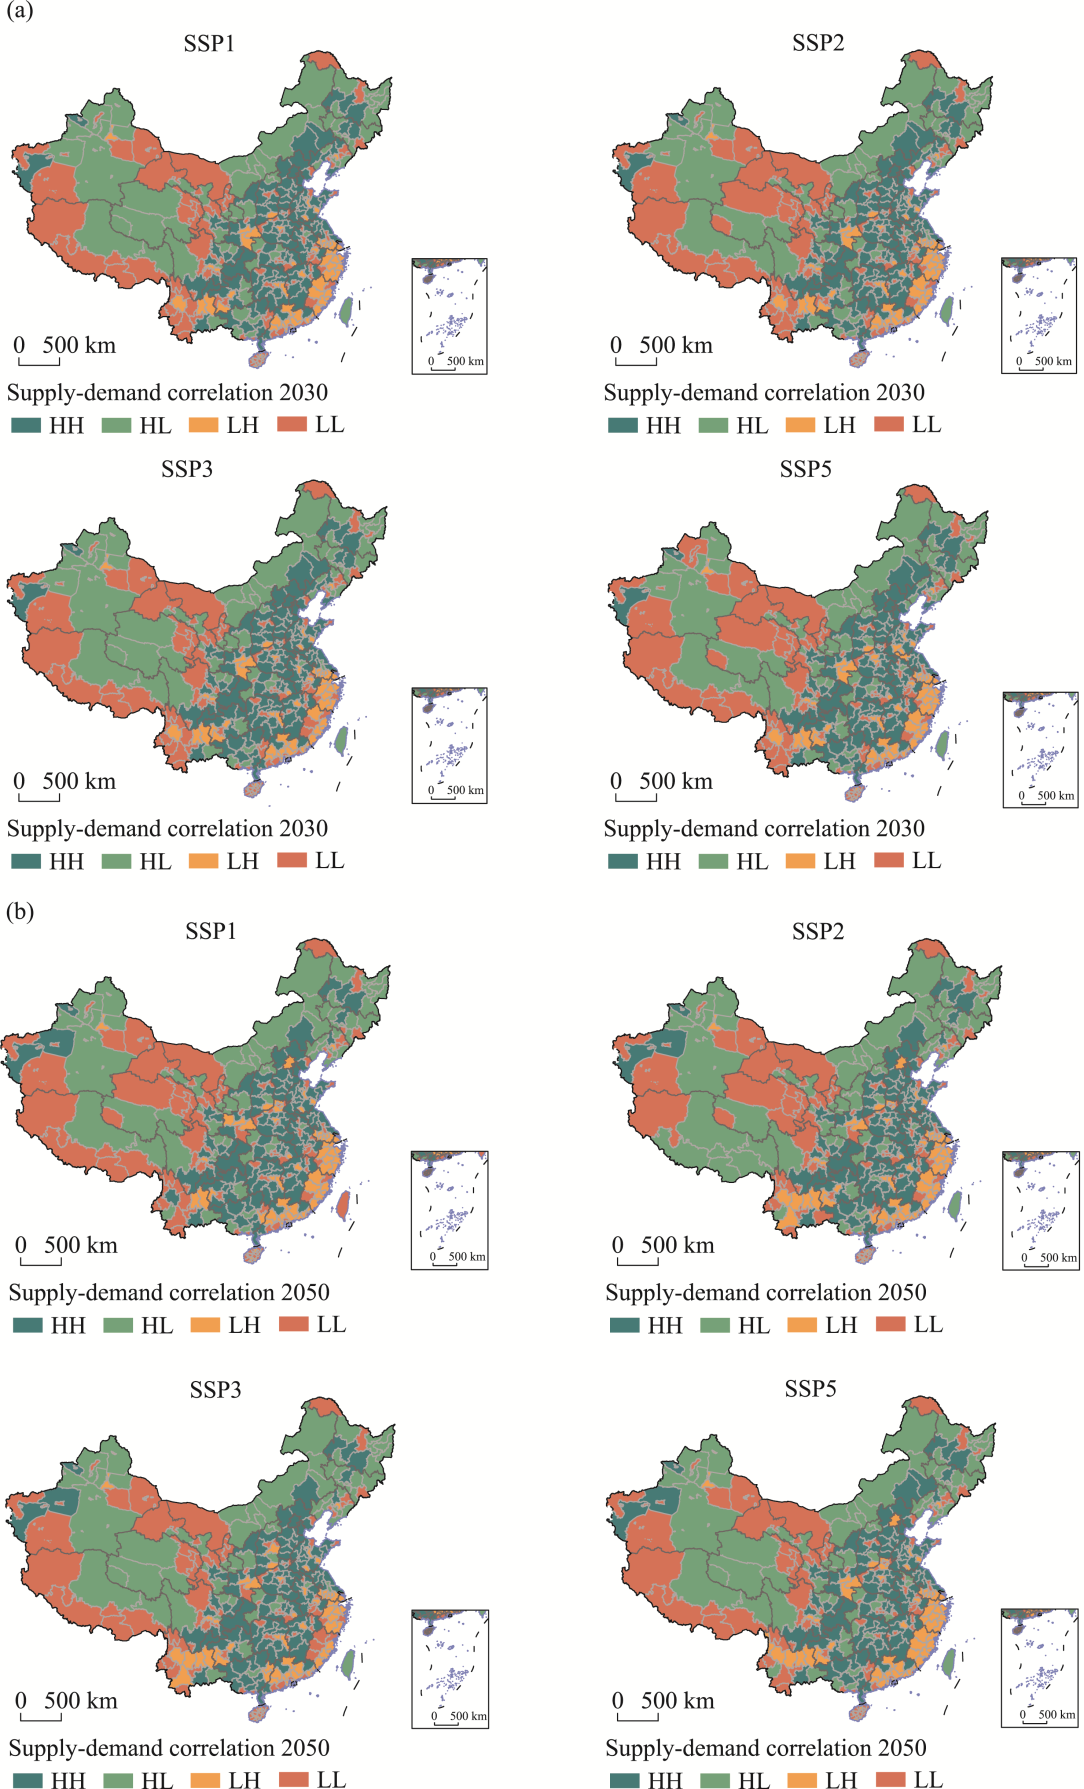
Figure 5
Spatial division of SSP-simulated cropland supply and demand in 2030 and 2050 (a. 2030; b. 2050)
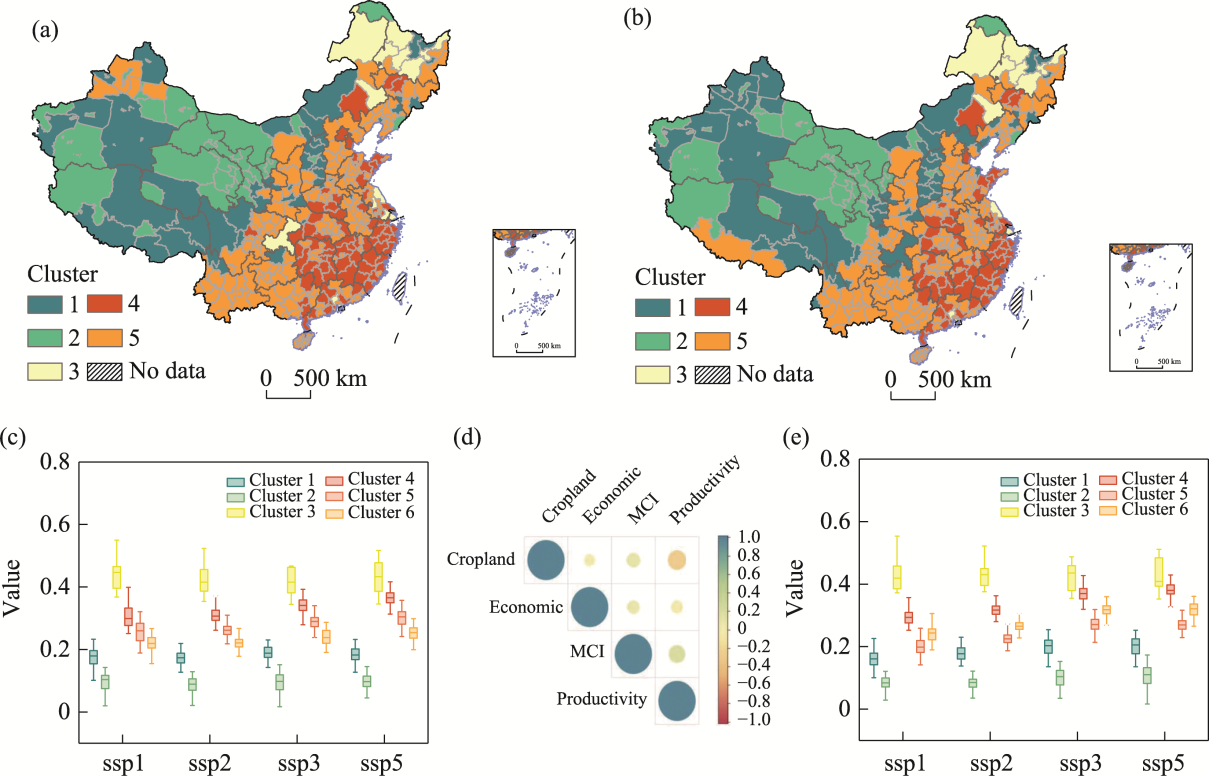
Figure 6
Multidimensional clustering of the agricultural sustainable zones (a. 2030; b. 2050; c. Data distribution of SSP1, SSP2, SSP3, and SSP5 in 2030 sustainable development zoning; d. Correlations of the indicators; e. Data distribution of SSP1, SSP2, SSP3, and SSP5 in 2050 sustainable development zoning)
Figure 7
Comparison and trends of dietary structure and cropping structure in 2002 and 2022