图/表 详细信息

Multidimensional and multiscenario assessment for cropland supply‒demand matches and sustainable development zoning
JIANG Zixin, LI Sinan, WANG Zhennan, ZHU Congmou, CHEN Yun, WANG Ke, ZHANG Jing
地理学报(英文版), 2025, 35(12): 2536-2558.   DOI: 10.1007/s11442-025-2424-2

Indicator Principle Data sources and calculation process
Socioeconomic development Rural per capita disposable income The per capita disposable income in rural areas is derived from parameters such as the rural population and GDP through a mathematical function (Liang et al.,
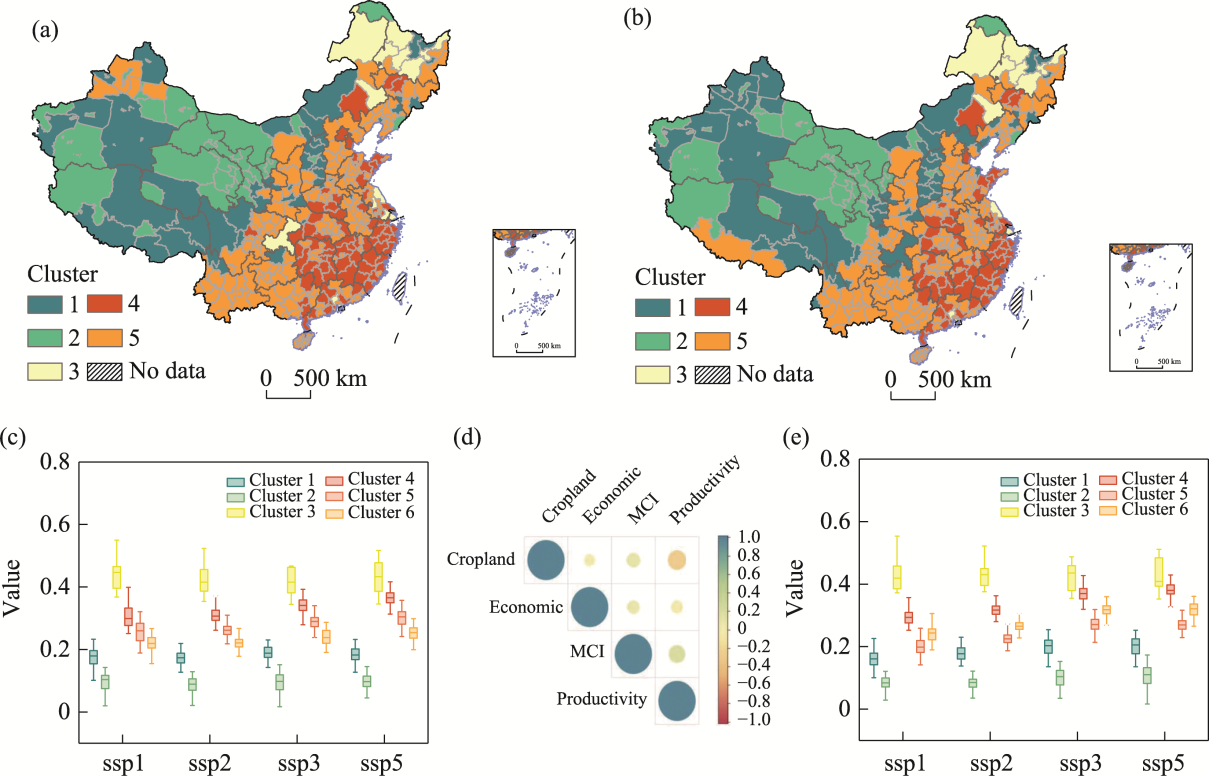
 2023). The socioeconomic data for shared socioeconomic pathways (SSPs) is obtained from Chen et al. (2020)
Cropland resources sustainability Cropland area The 1-km resolution land use data for China under the SSP scenarios is sourced from Zhang et al. (2023), and the total cropland area for each prefecture-level city is calculated using ArcGIS software.
Ecological
sustainability
Climate
production
The calculation of climate productivity refers to He et al. (2014), where precipitation and temperature data are transformed into climate productivity. The simulated precipitation and temperature data are obtained from CMIP6 (https://aims2.llnl.gov/search/cmip6).
Cropland
production
sustainability
Multiple
cropping index (MCI)
The multiple cropping index is derived from parameters such as the crop yield, rural population, and level of agricultural mechanization (Moein et al., 2018). The simulation of crop yield and agricultural mechanization level is referenced in the literature. The rural population data is sourced from Chen et al. (2020).
Table 2 Cropland sustainability assessment
本文的其它图/表