| Datasets | Data source | Data description |
|---|---|---|
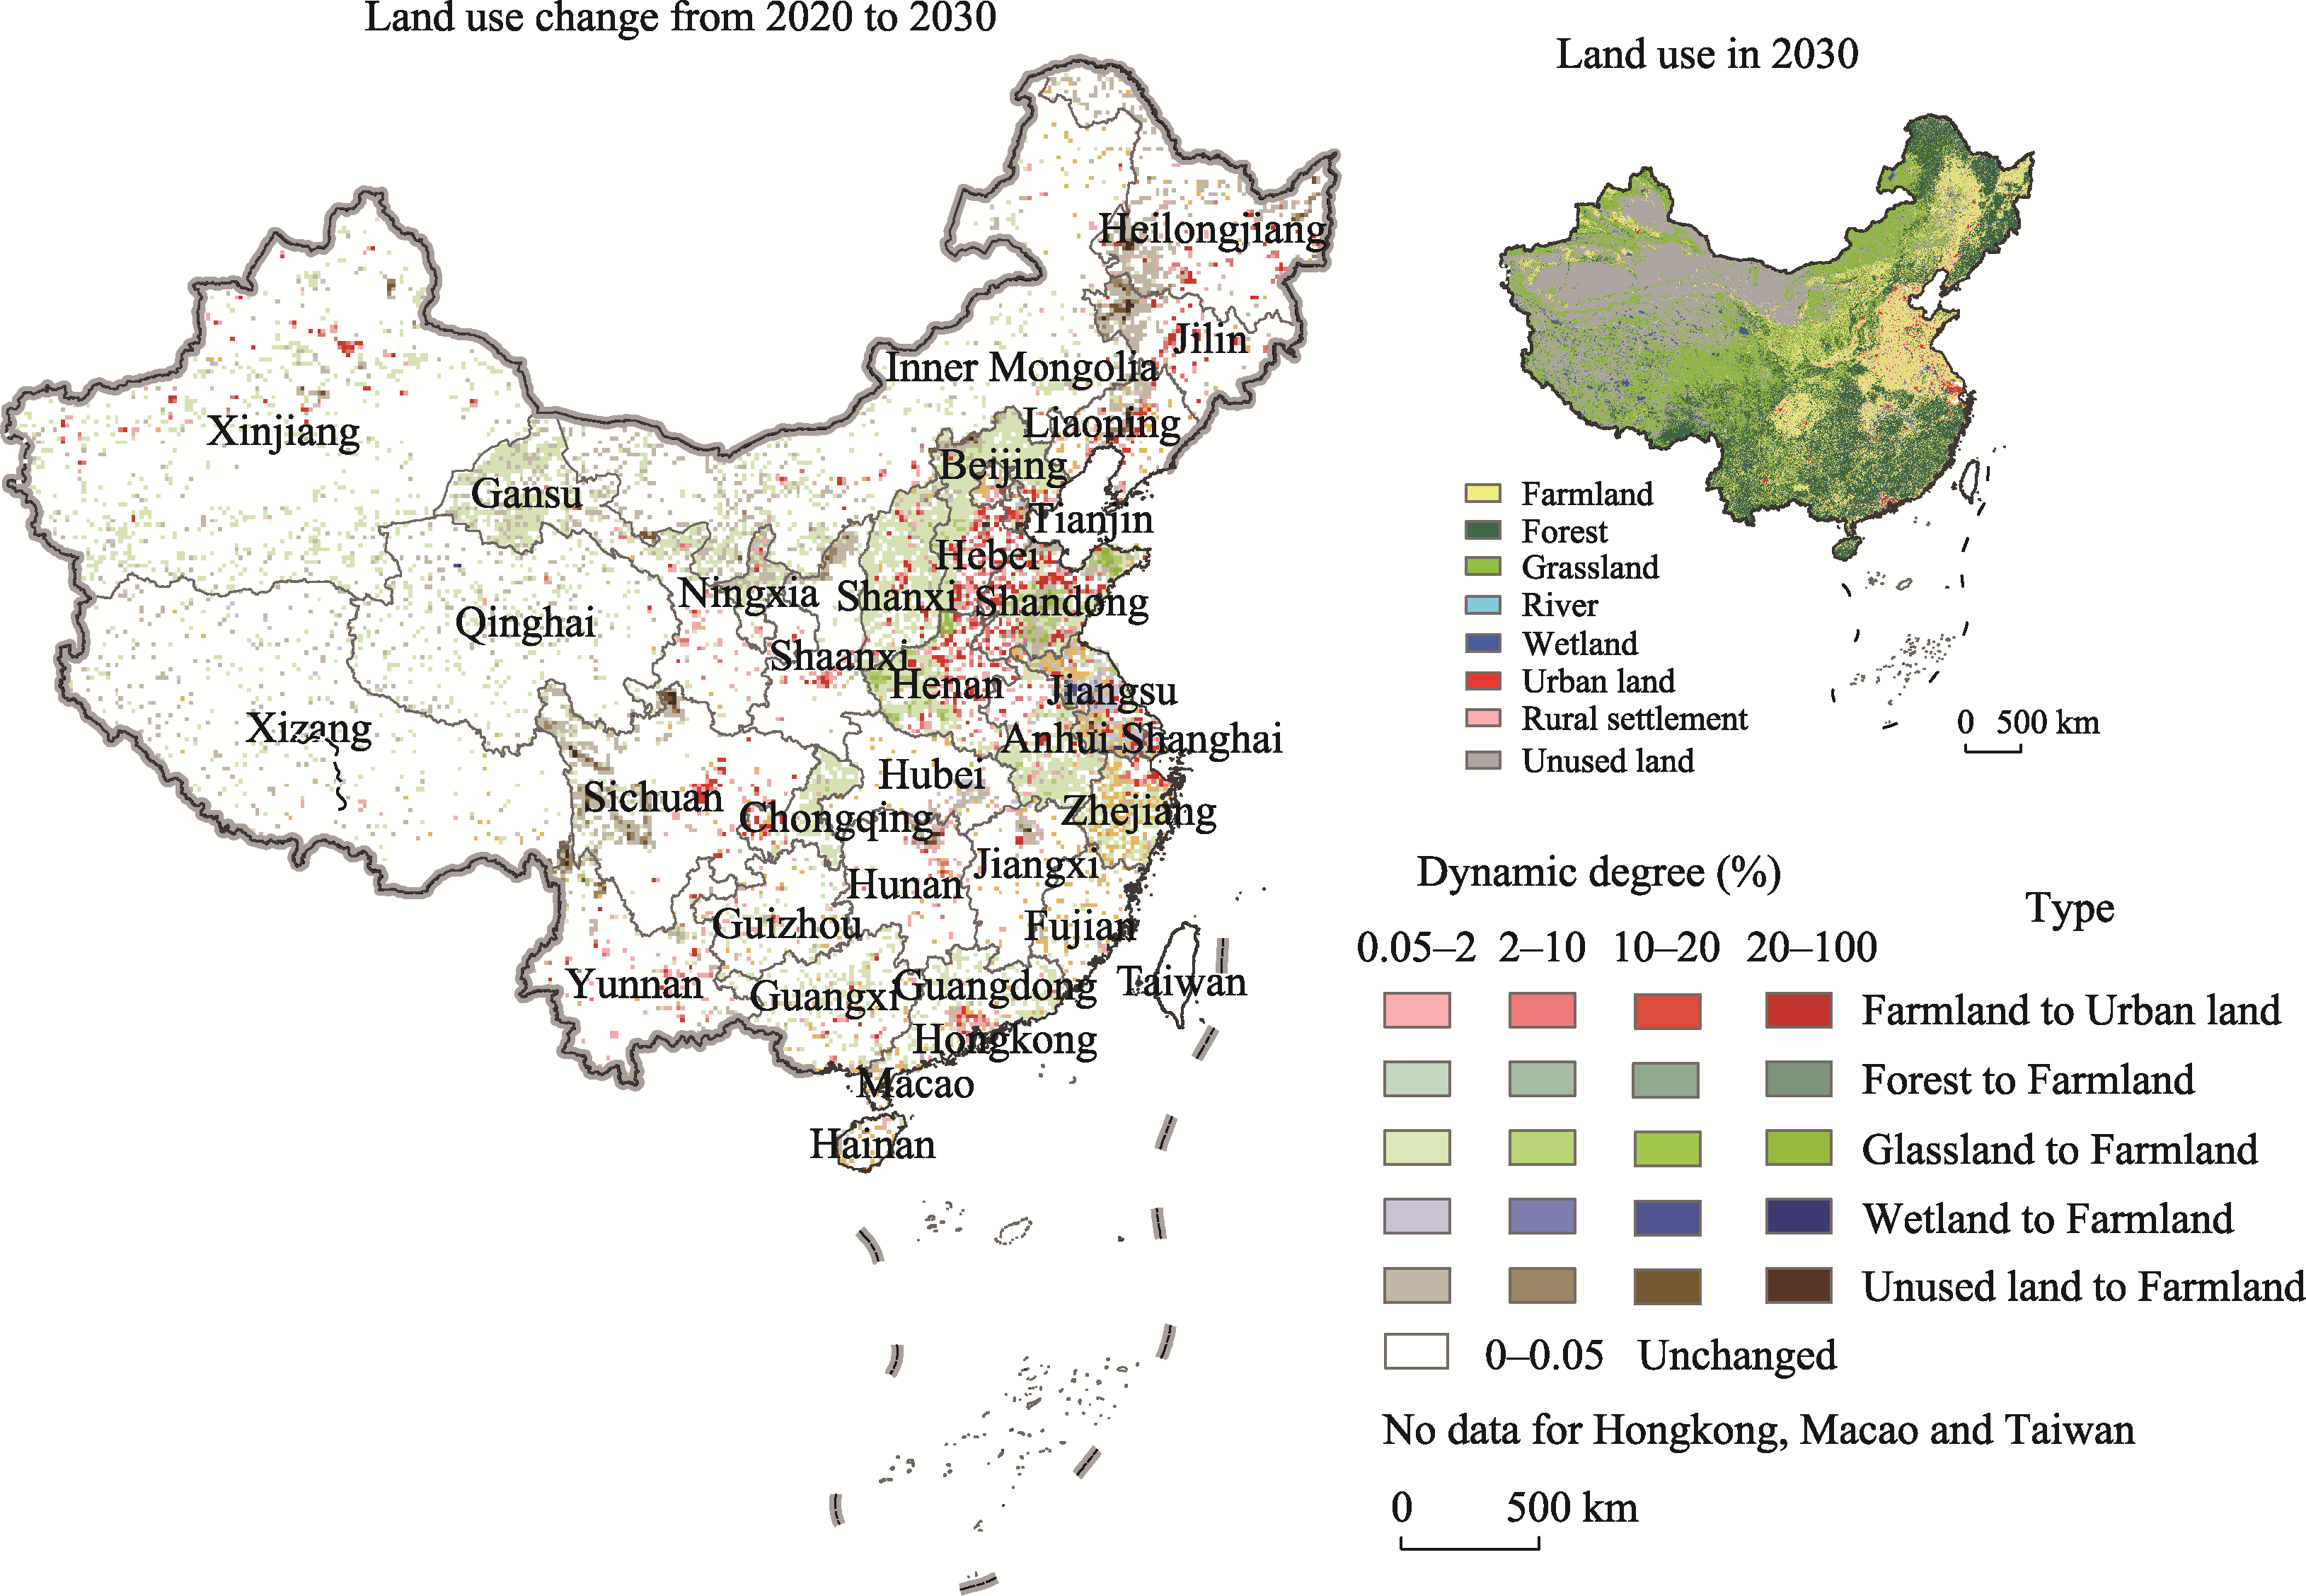
| Land-use data | Resource and Environmental Science Data Platform (RESDC) | Land-use map in 2000 used to project urban land demand for 2030 Land-use map in 2010 used to simulate land use for 2020 Land-use map in 2020 used for model calibration |
| Potential cereal production data | Global Agro-Ecological Zones (GAEZ) | Potential cereal production dataset used as a restricted condition of cereal production balance in LANDSCAPE model |
| Meteorological data | China Meteorological Data Network | Annual precipitation, average annual accumulated temperature, and average annual solar radiation in 2020 used to calculate the conversion probability |
| Terrain data | The Shuttle Radar Topography Mission (SRTM) | DEM data used to calculate the conversion probability Slope data extracted from DEM used to calculate the conversion probability |
| Soil data | Harmonized World Soil Database (HWSD) | Soil organic carbon used to calculate the conversion probability Soil pH value used to calculate the conversion probability |
| Traffic data | Open Street Map | Euclidean distance to railways, highways, national highways, provincial highways, county roads, and urban trunk roads of 2020 used to calculate the conversion probability |
| Nature reserve data | Resource and Environmental Science Data Platform (RESDC) | Restricting urban land expansion and cropland development |
| NPP | Resource and Environmental Science Data Platform (RESDC) | NPP data in 2020 used to calculate the regional difference coefficient correction |
| Consumption and expenditure data | China Bureau of Statistics | Food consumption expenditure and total consumption expenditure data in 2020 used to calculate Engel’s coefficient |
| Population data | China Bureau of Statistics | Urban population and rural population from 2010 to 2020 used to calculate the social development factor correction and predicted the future food demand |
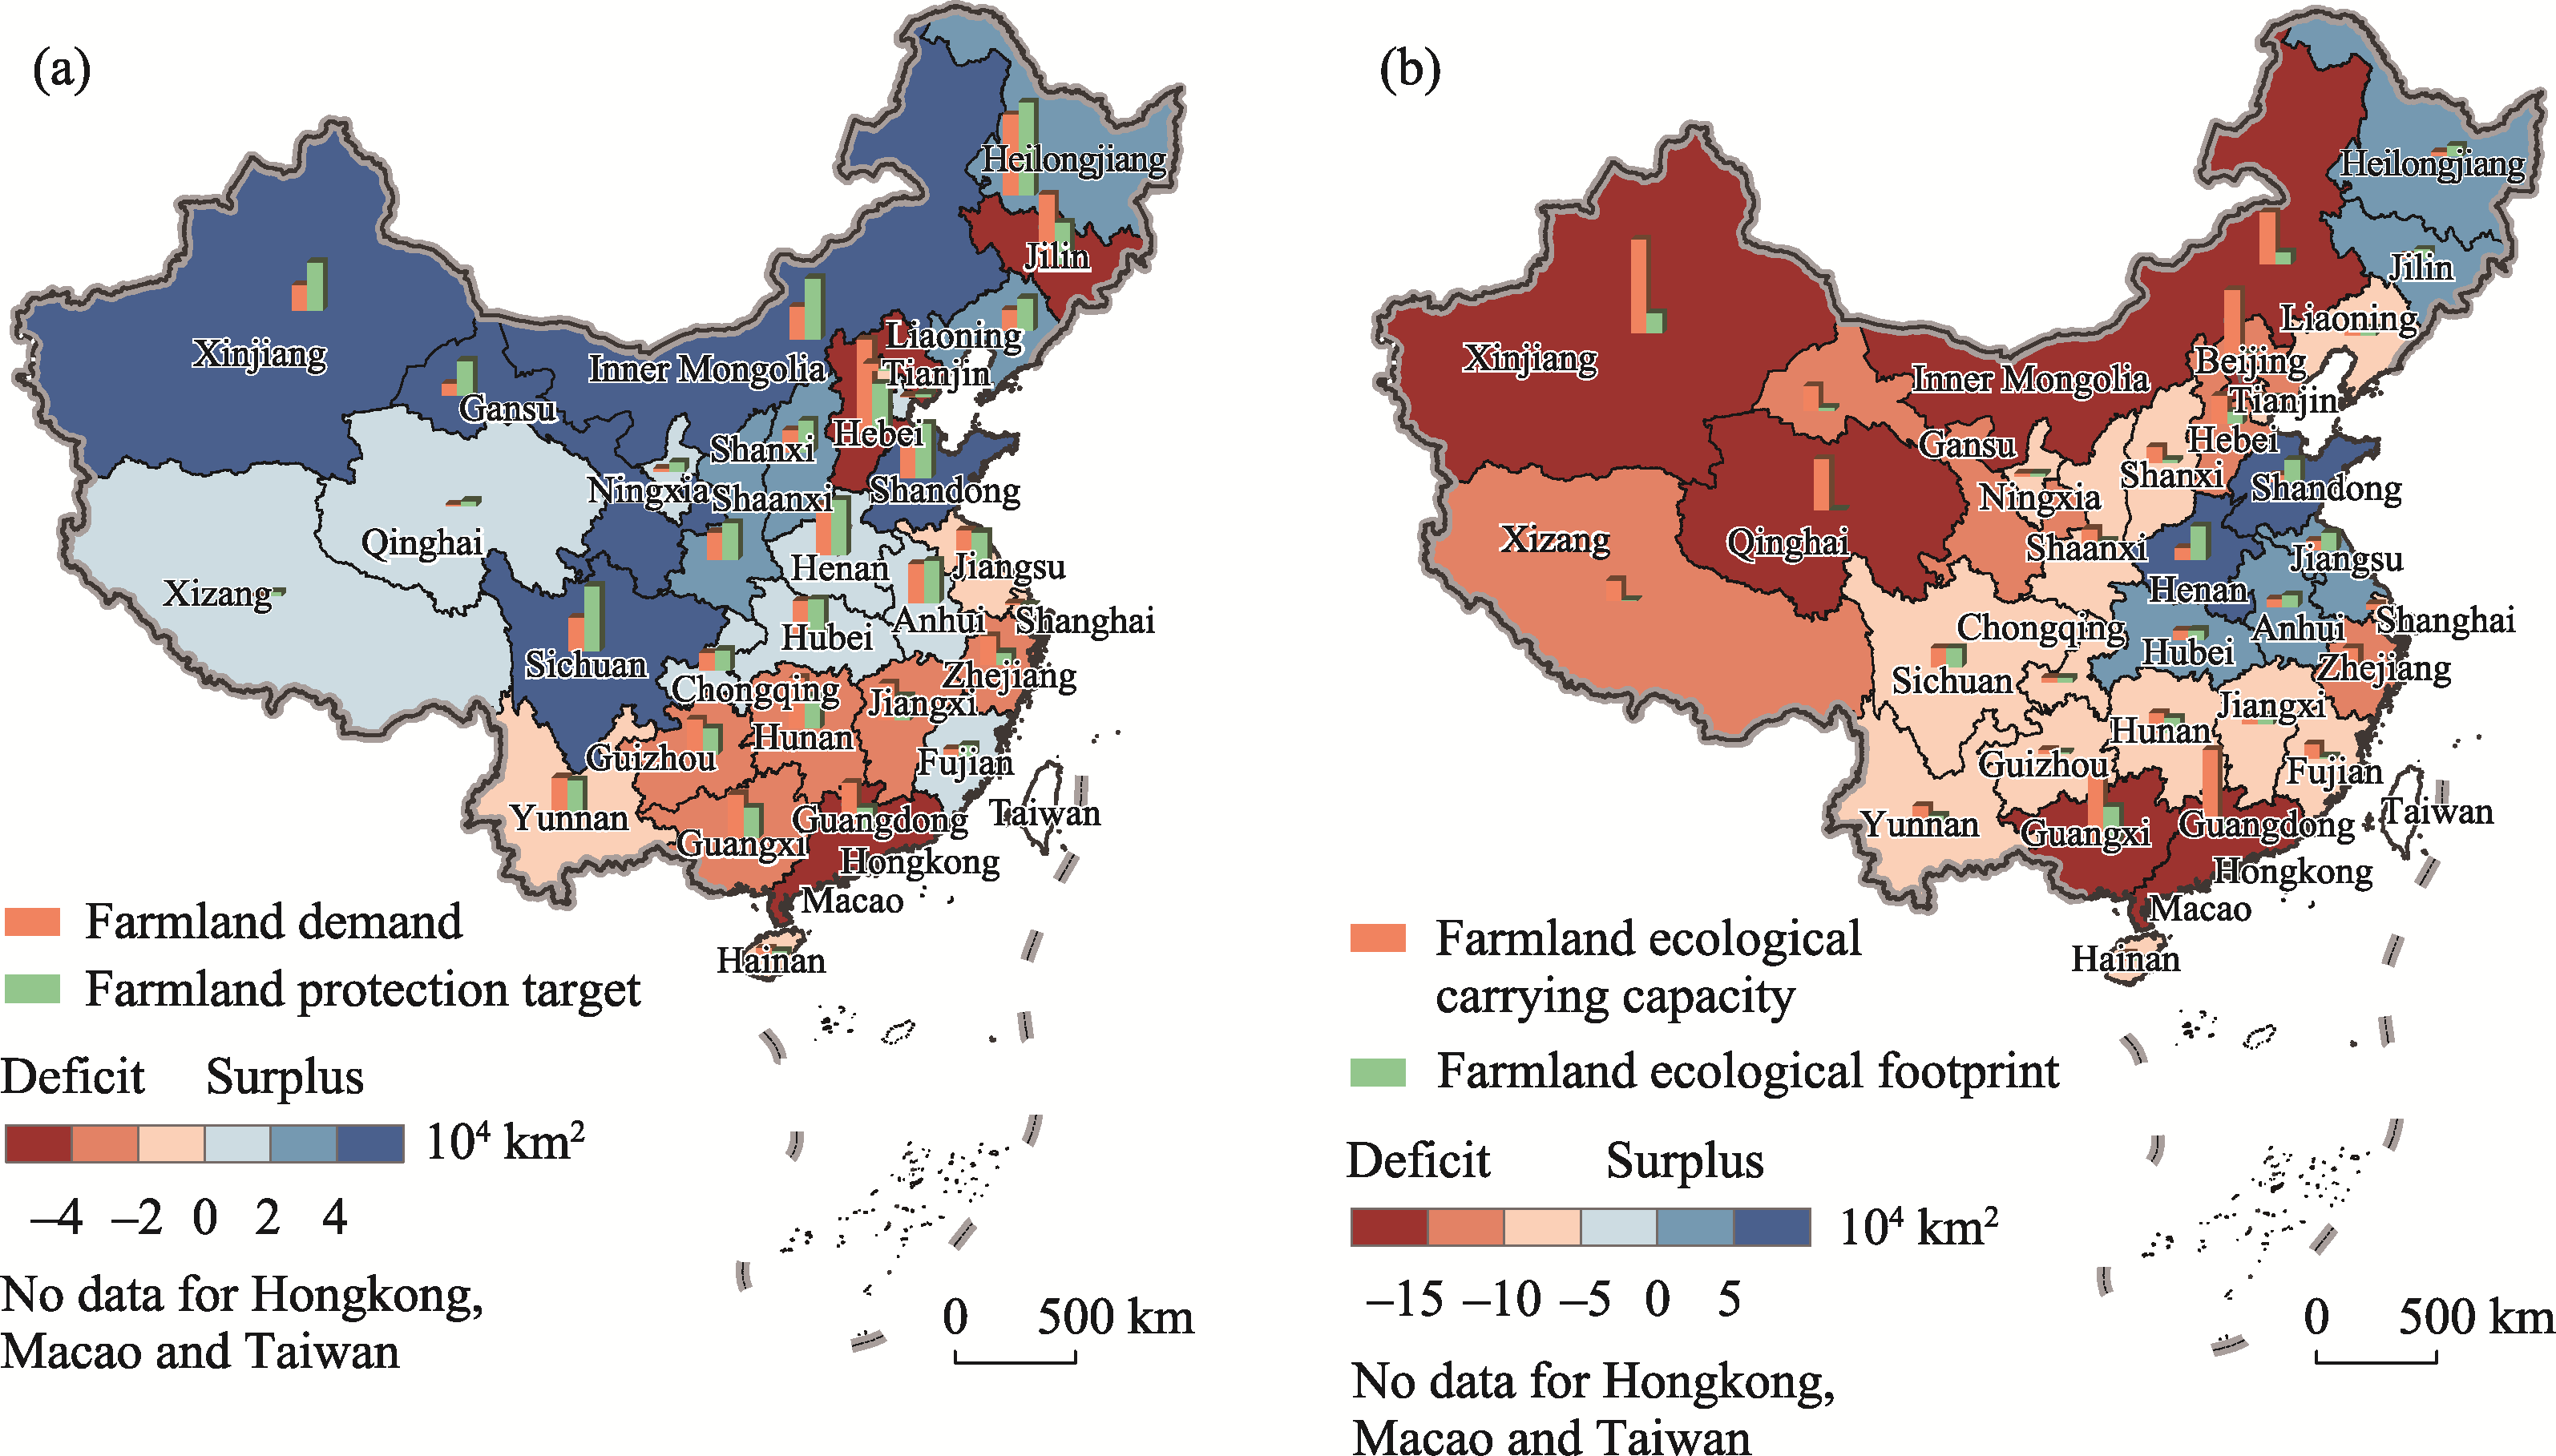
| Crop data | China Bureau of Statistics | Crop production and consumption of rice, corn, and wheat from 2010 to 2020 used to calculate the farmland deficit and surplus |
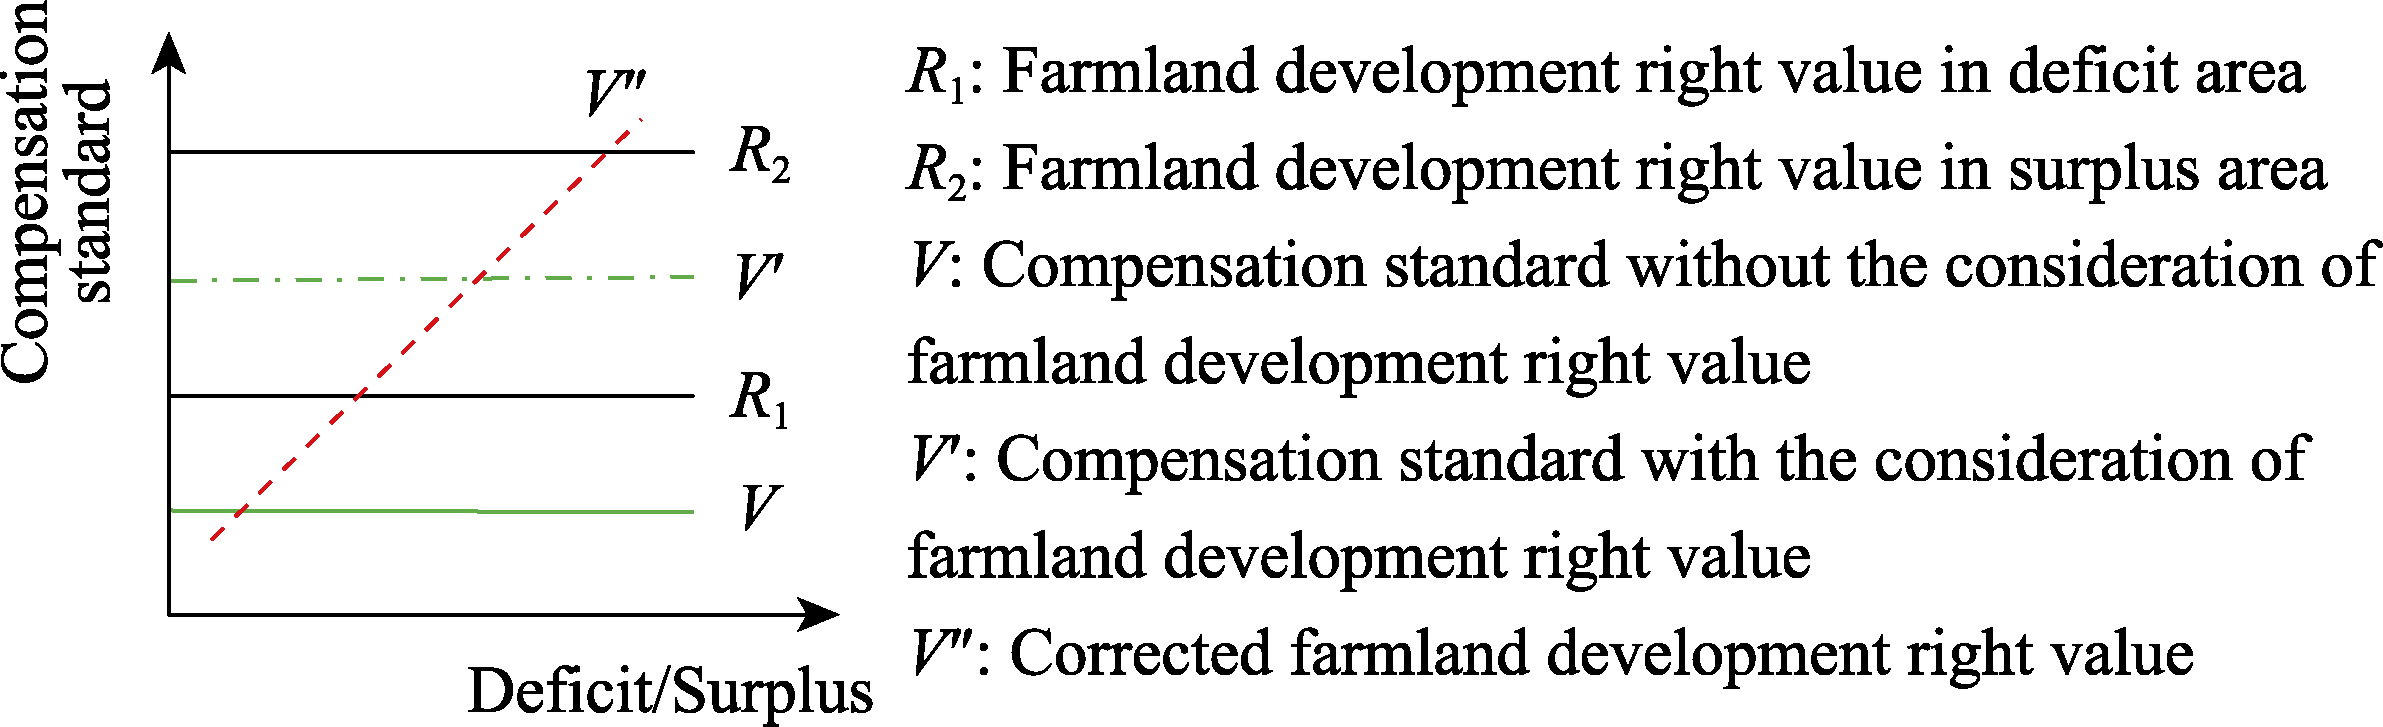
| Input‒output data | China Bureau of Statistics | Input‒output tables in 2017 to calculate the land development right value |