×
模态框(Modal)标题
在这里添加一些文本
关闭
关闭
提交更改
取消
确定并提交
×
模态框(Modal)标题
×
期刊
文章
图表
检索
EN
中文
首页
关于期刊
期刊介绍
数据库收录
期刊荣誉
编委会
投稿指南
在线期刊
当期目录
优先出版
过刊浏览
推荐文章
专题
按栏目浏览
阅读排行
下载排行
引用排行
E-mail Alert
RSS
期刊订阅
广告合作
联系我们
EN
中文
图/表 详细信息
Multi-scenario land use prediction and layout optimization in Nanjing Metropolitan Area based on the PLUS model
CAO Ji, CAO Weidong, CAO Yuhong, WANG Xuewei, ZHANG Yizhen, MA Jinji
地理学报(英文版), 2024, 34(
7
): 1415-1436. DOI:
10.1007/s11442-024-2254-7
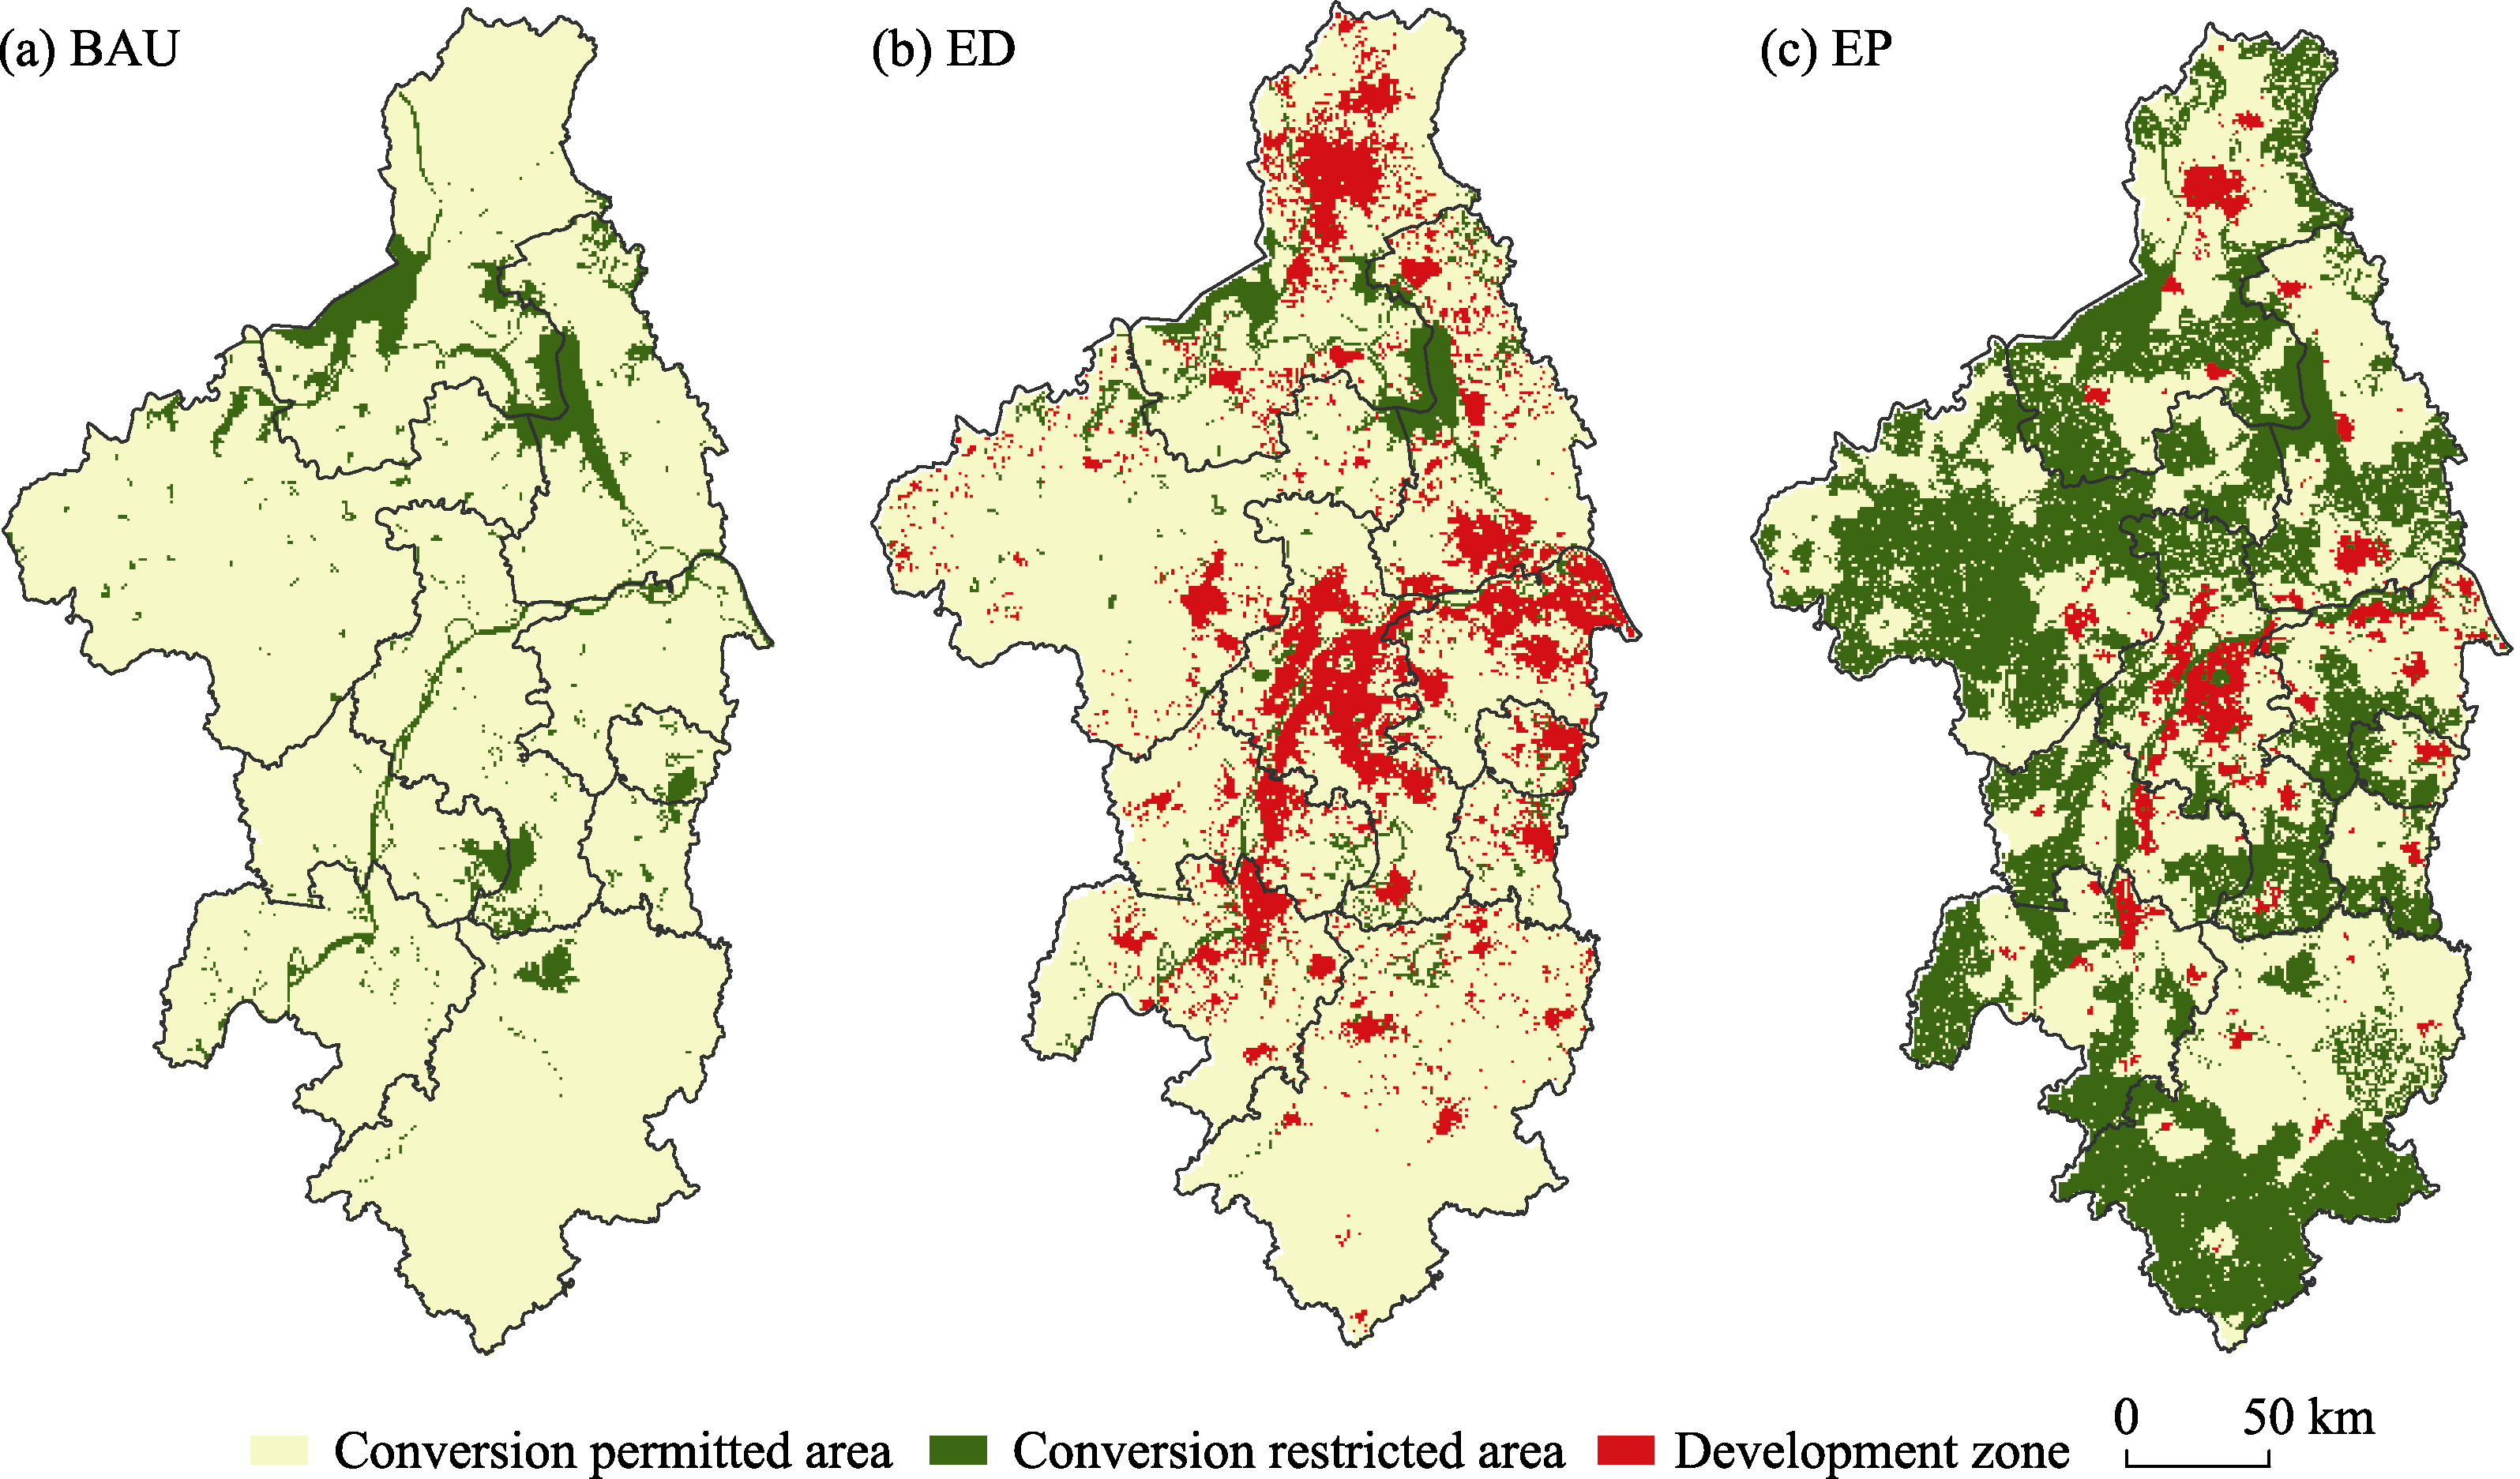
Figure 8
Setting diagram of the development zone under different scenarios in Nanjing Metropolitan Area (a. BAU scenario; b. ED scenario; c. EP scenario)
本文的其它图/表
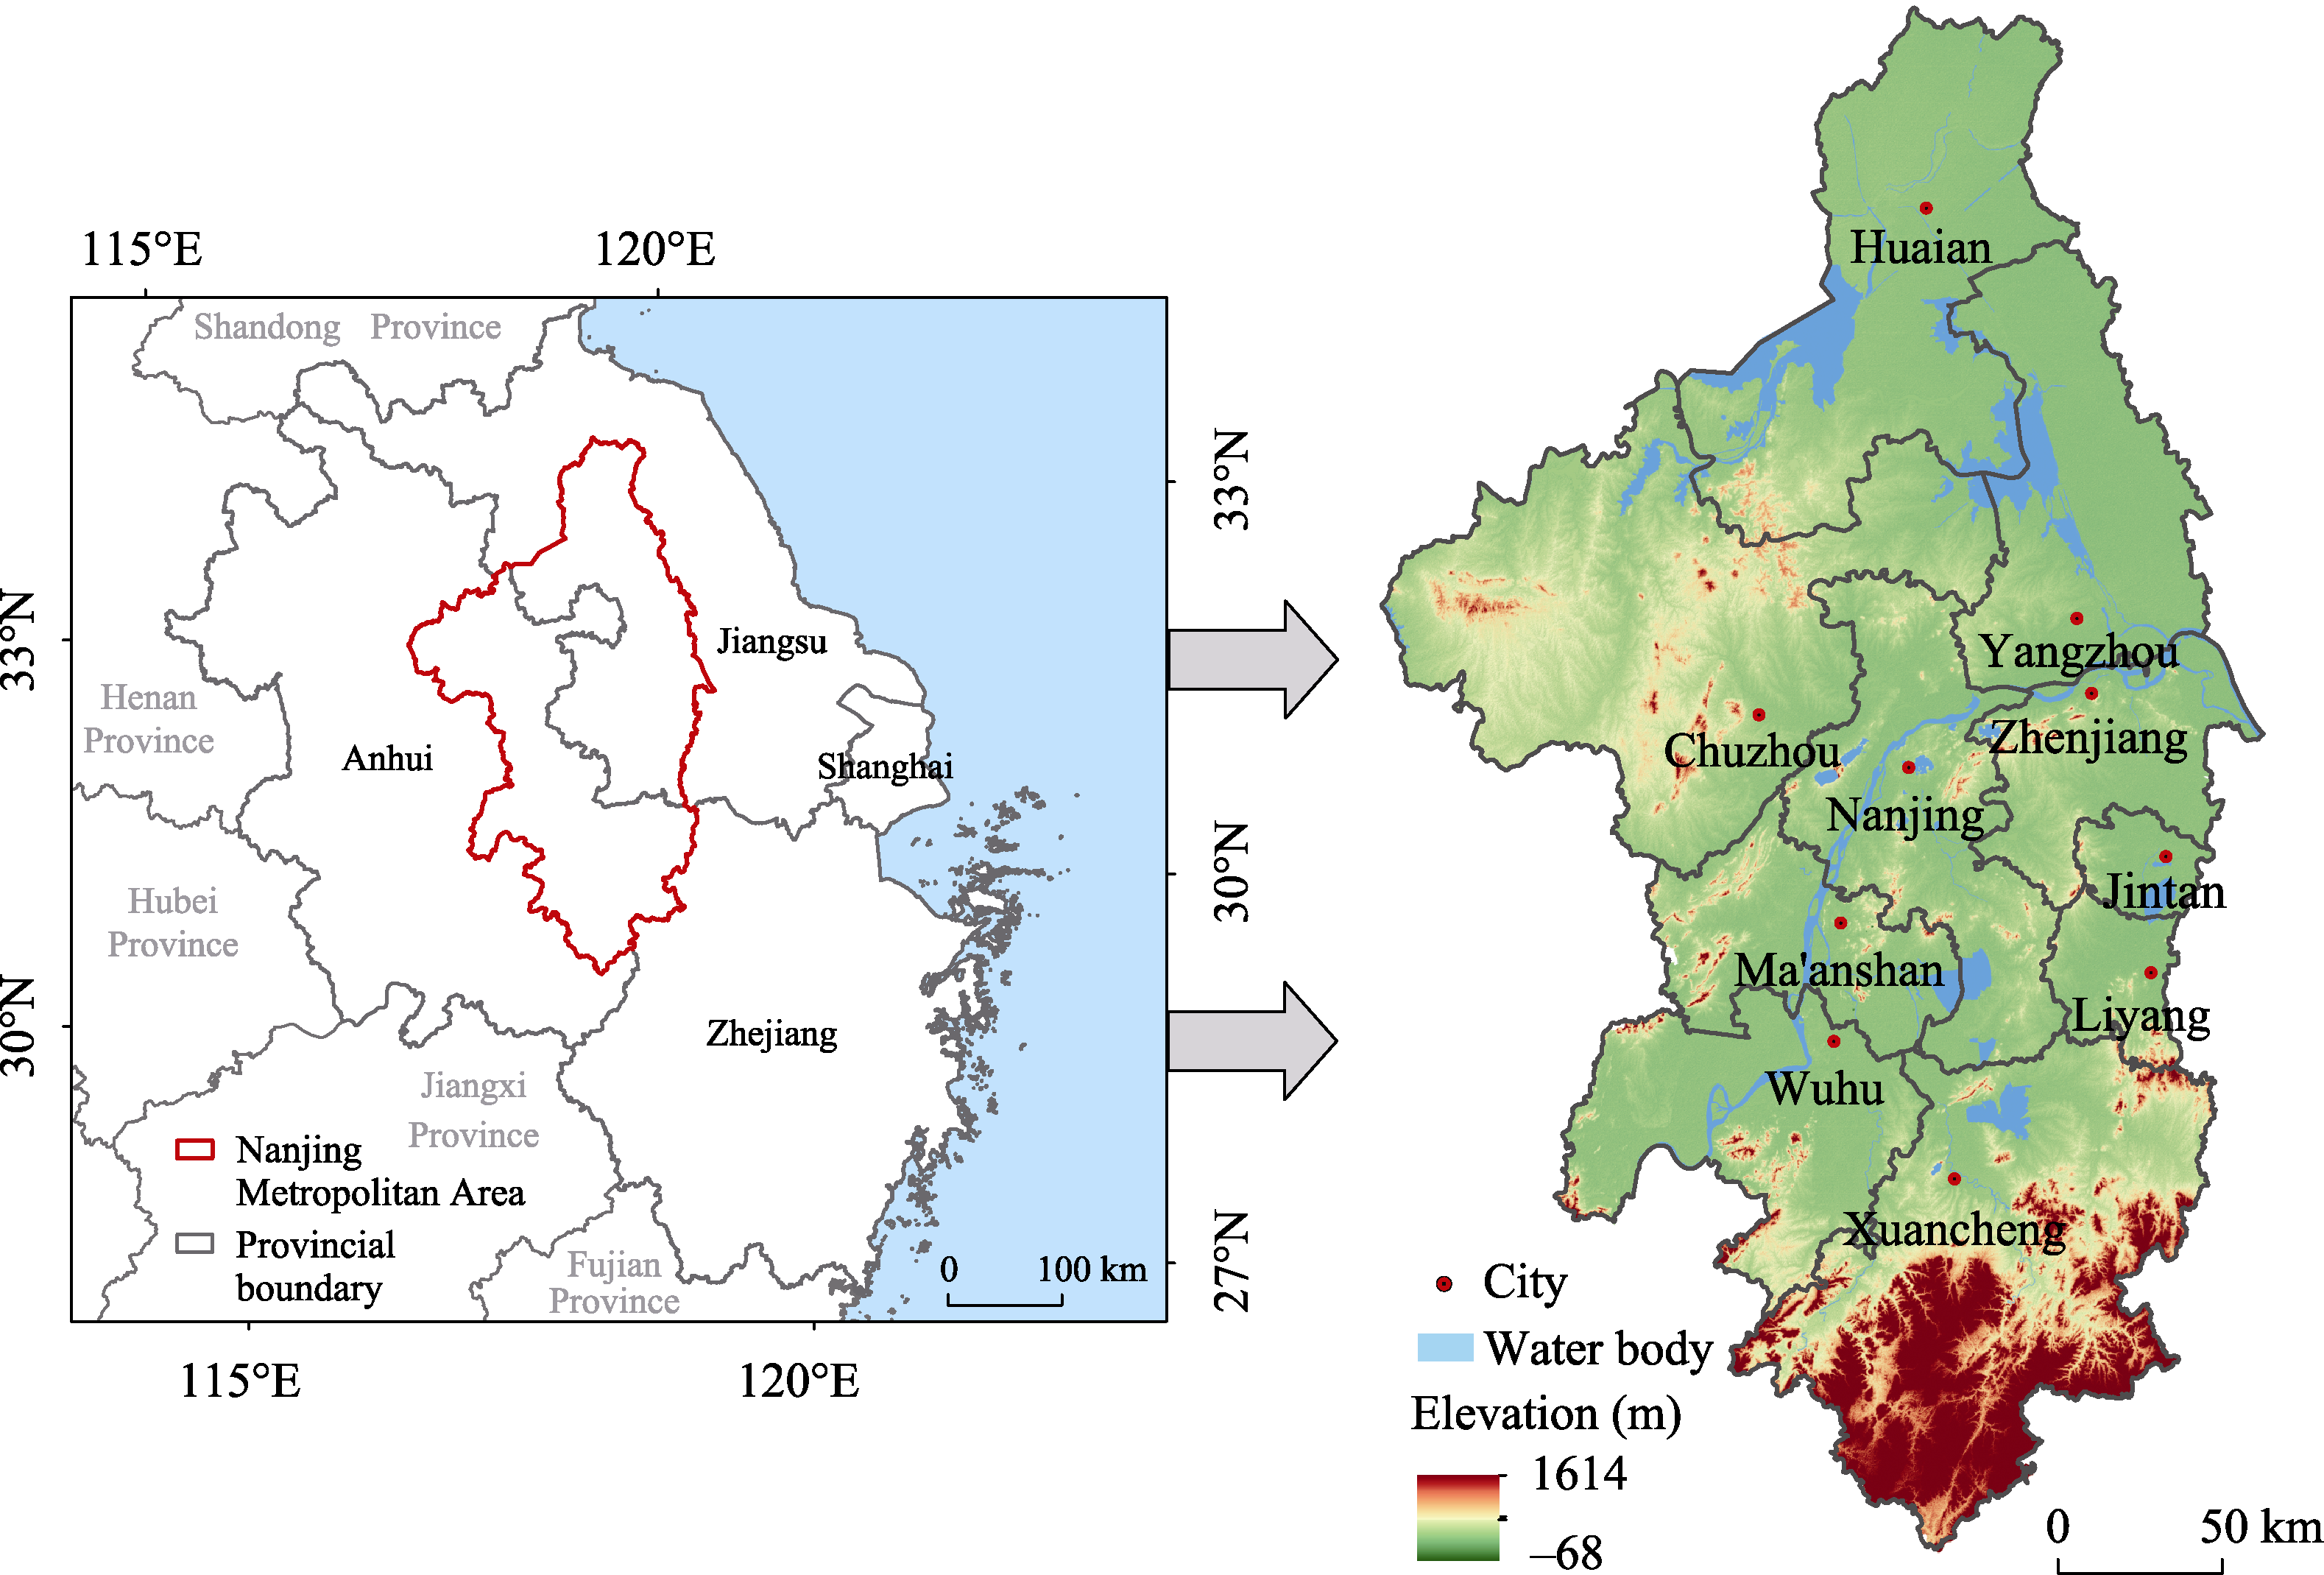
Figure 1
Administrative divisions and terrain of the study area (Nanjing Metropolitan Area)
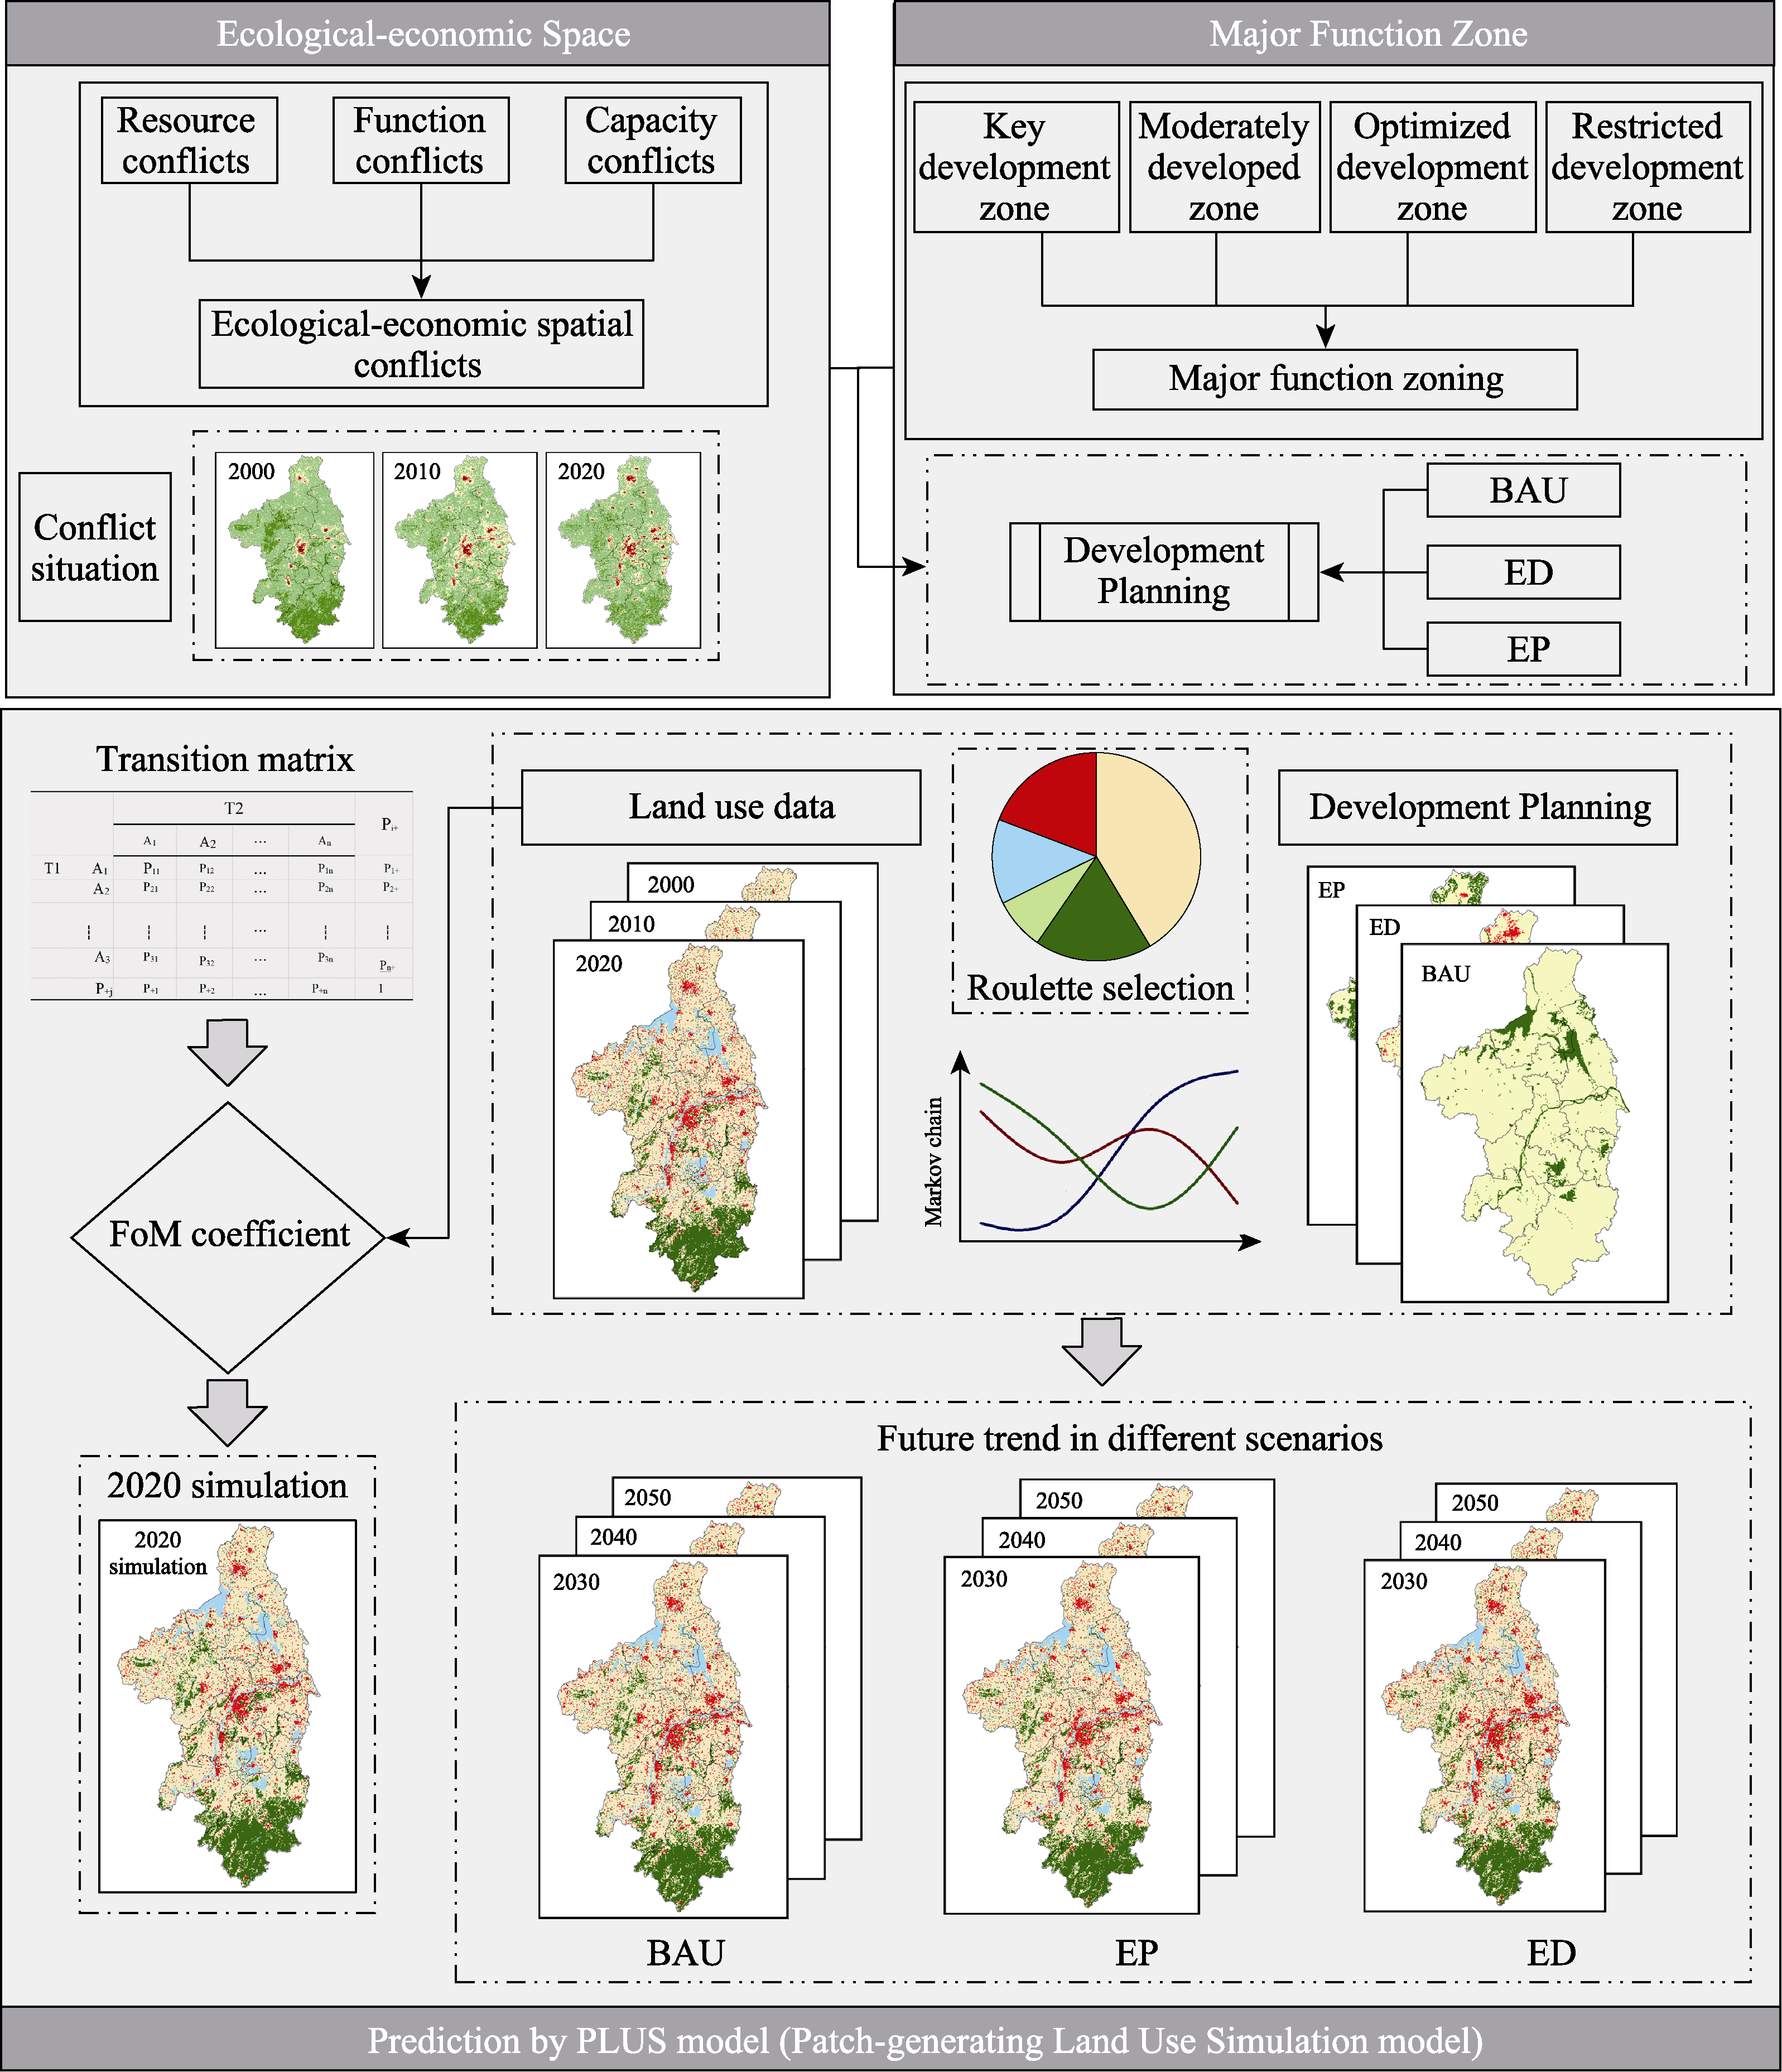
Figure 2
Research framework diagram
Table 1
Data sources
Table 2
EESC Indicators system
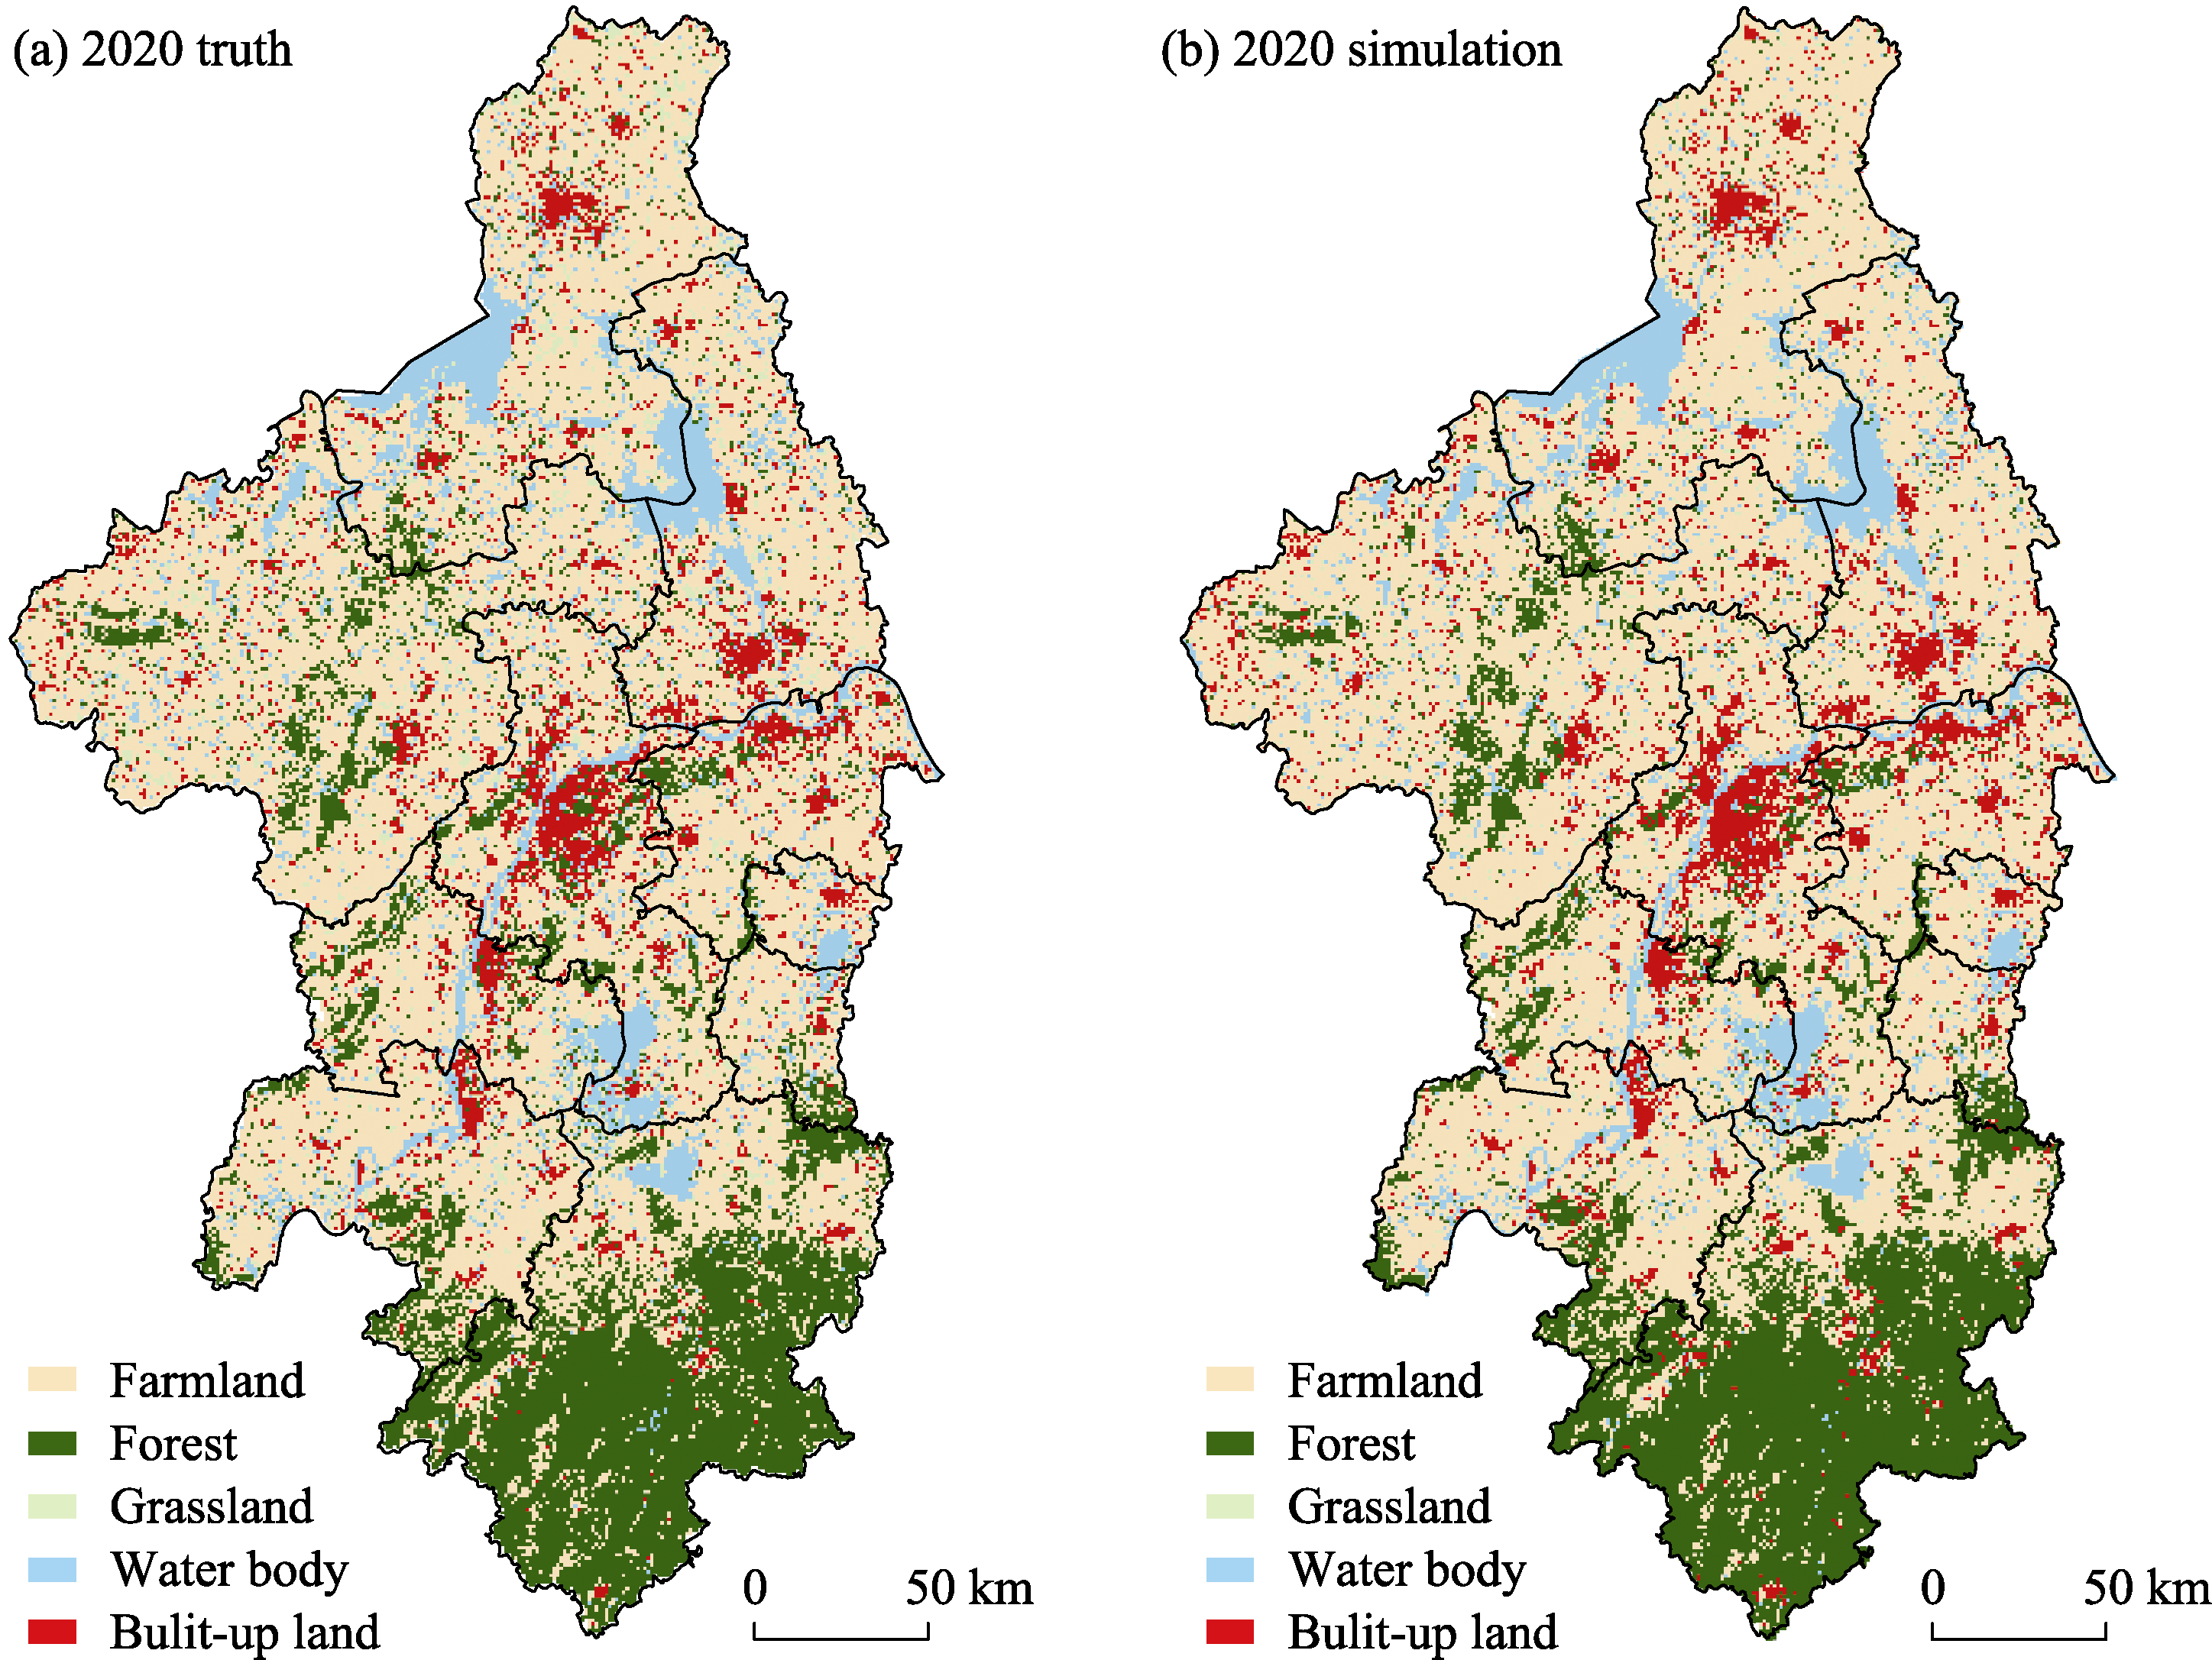
Figure 3
Forecast and reality comparison in Nanjing Metropolitan Area in 2020
Figure 4
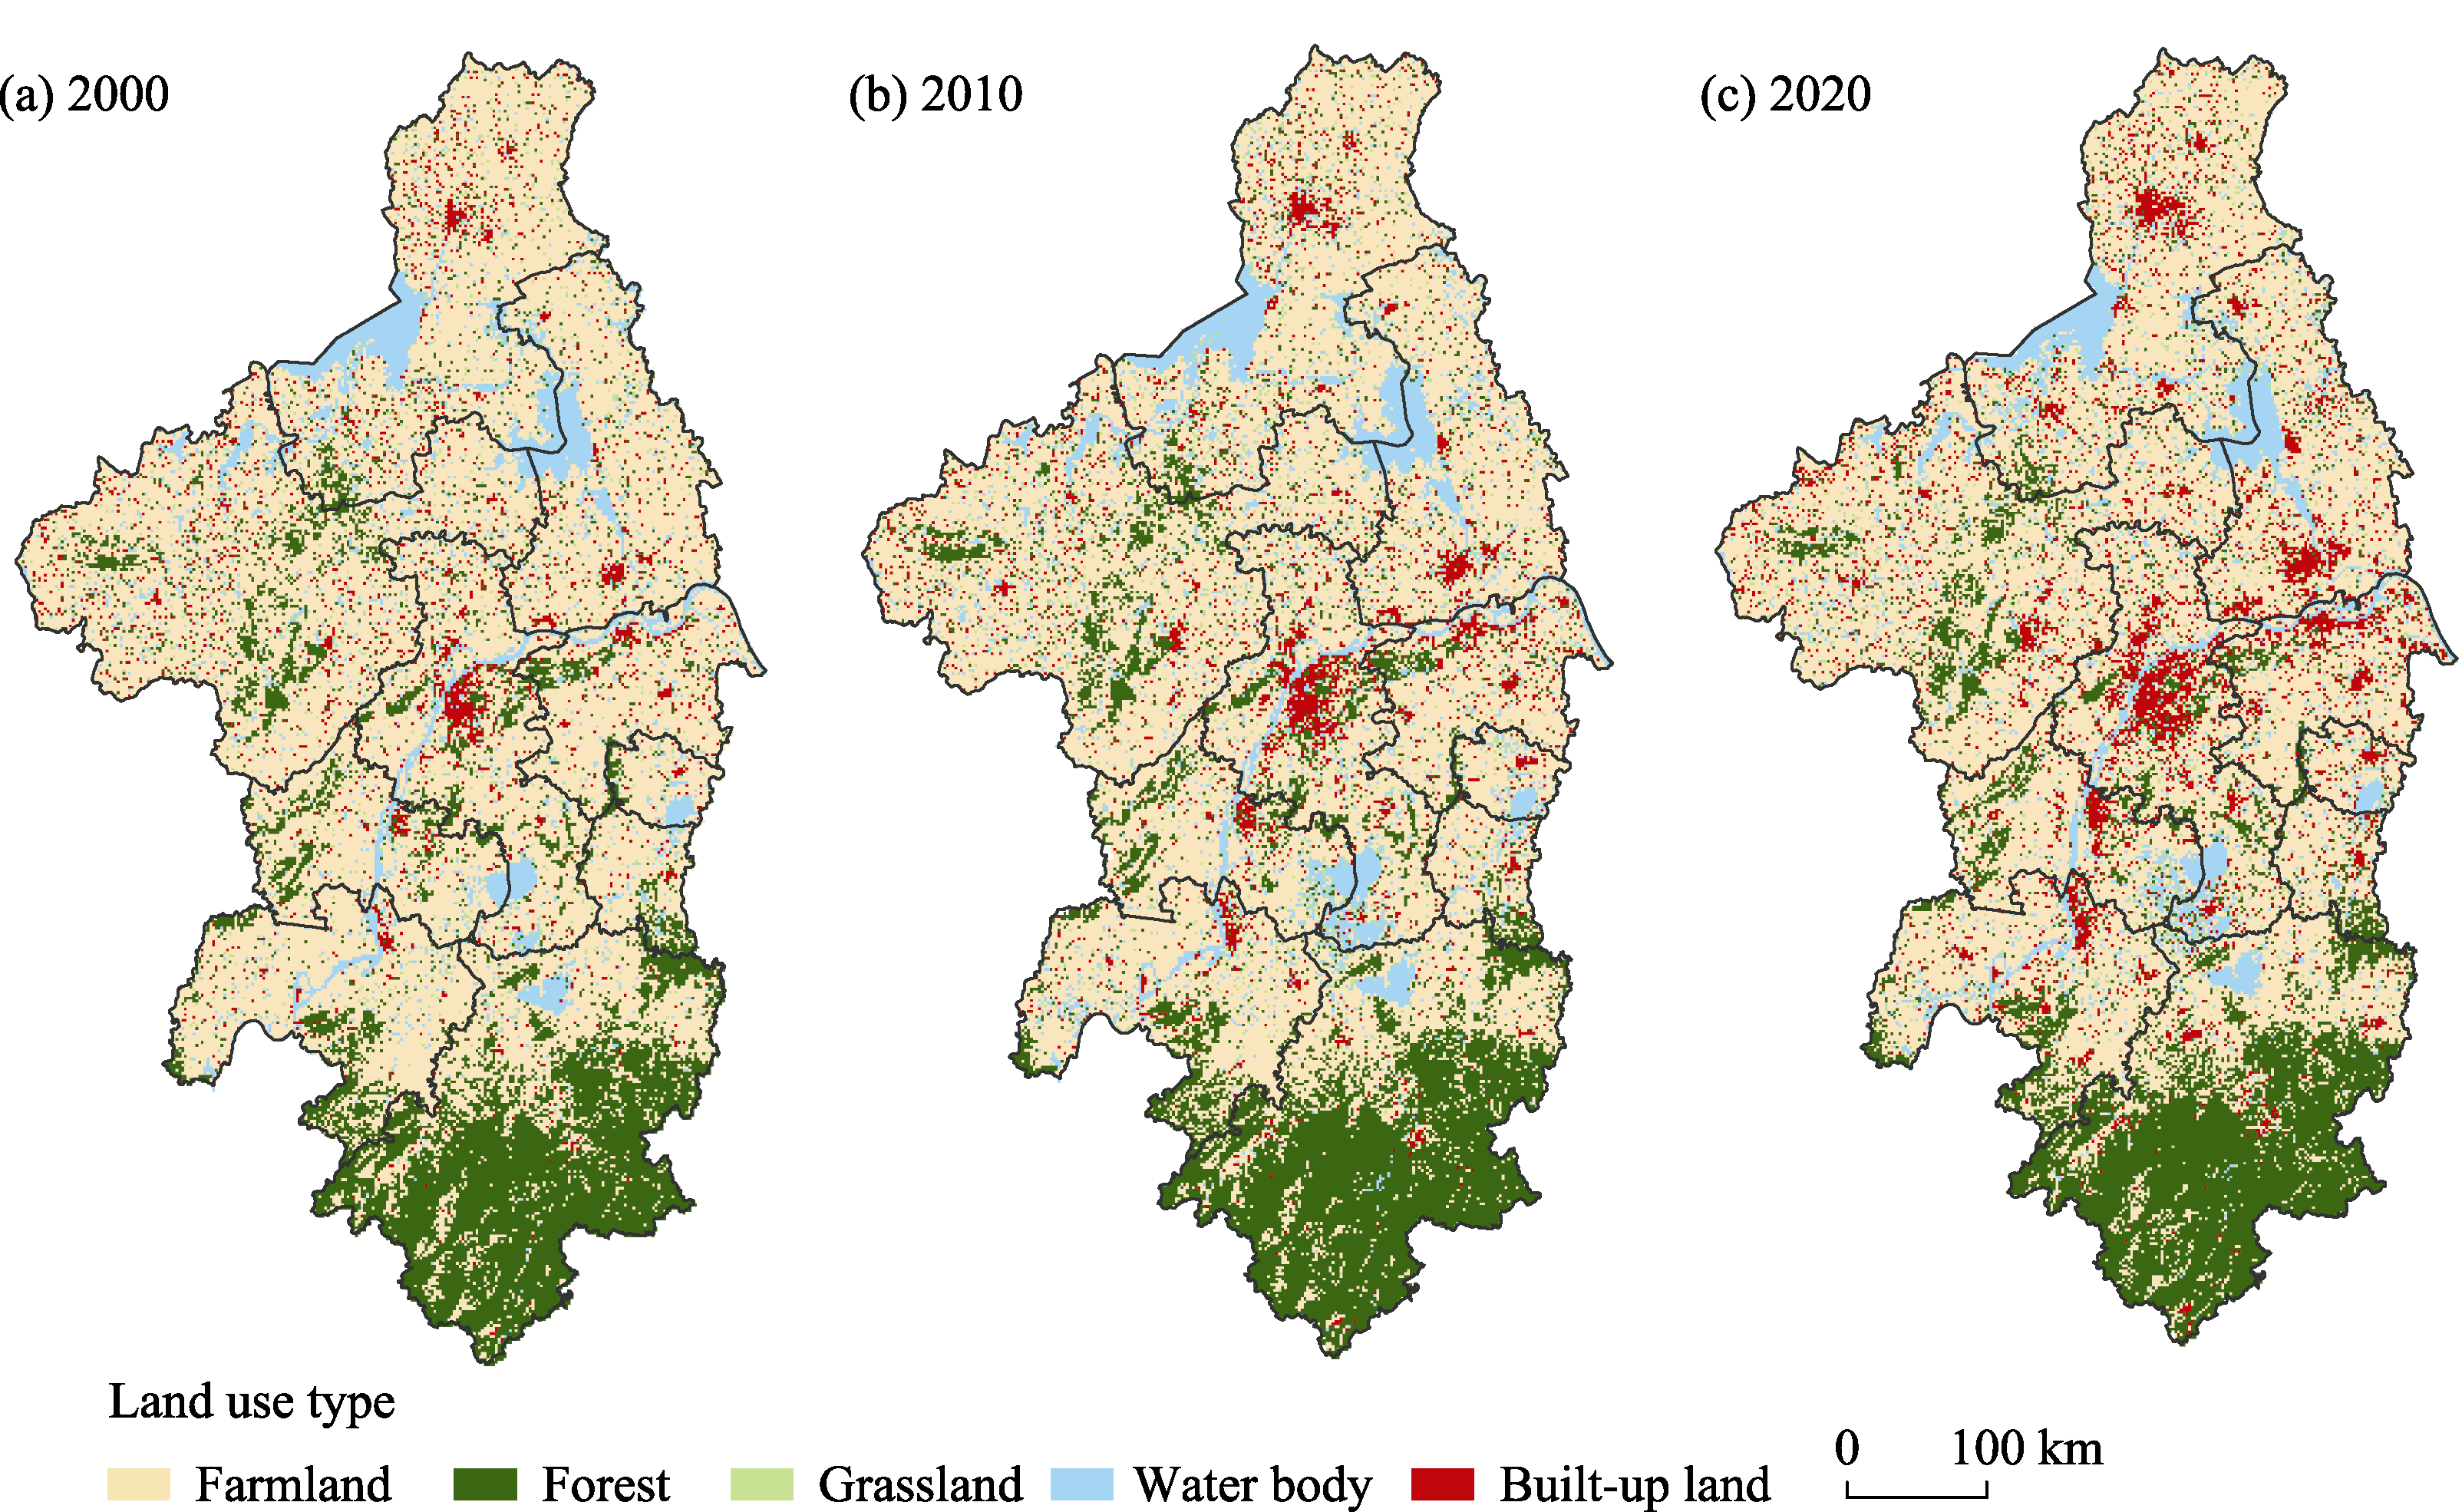
Land use in Nanjing Metropolitan Area (a. 2000; b. 2010; c. 2020)
Table 3
Area and proportion of each land use type in Nanjing Metropolitan Area
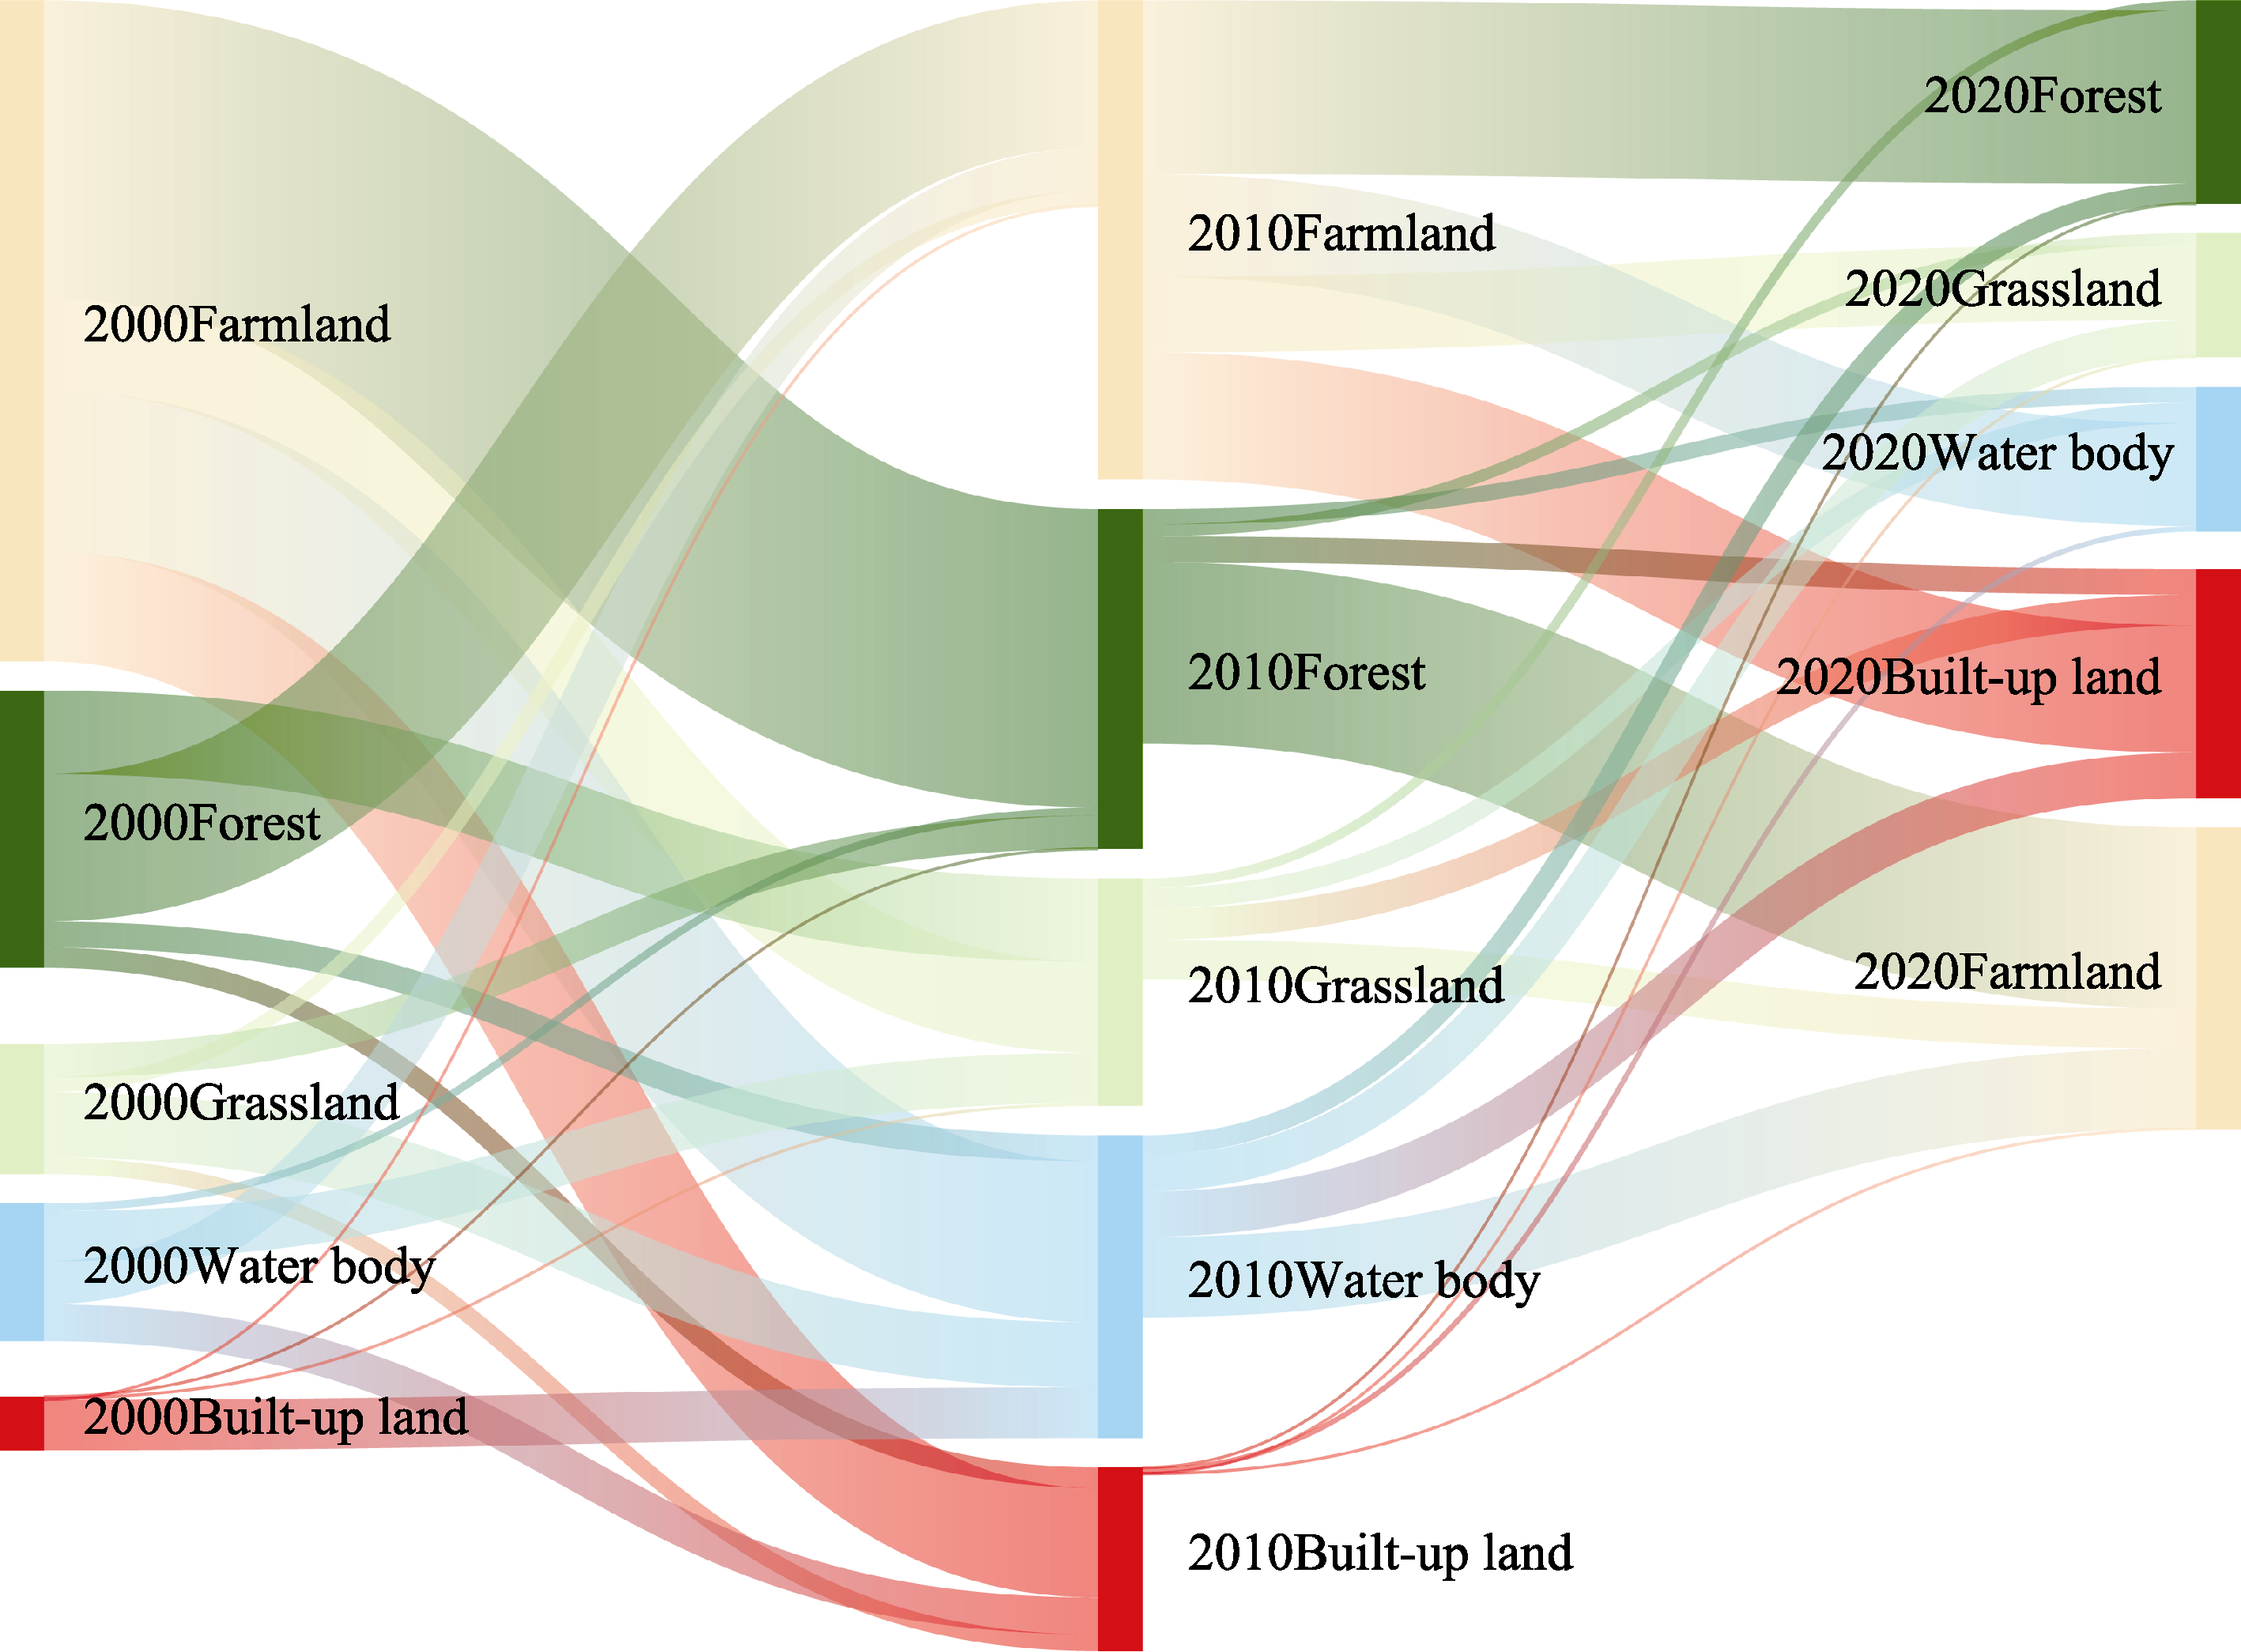
Figure 5
Transfer of land use change in Nanjing Metropolitan Area from 2000 to 2020
Table 4-1
Land use transfer in Nanjing Metropolitan Area from 2000 to 2010
Table 4-2
Land use transfer in Nanjing Metropolitan Area from 2010 to 2020
Figure 6
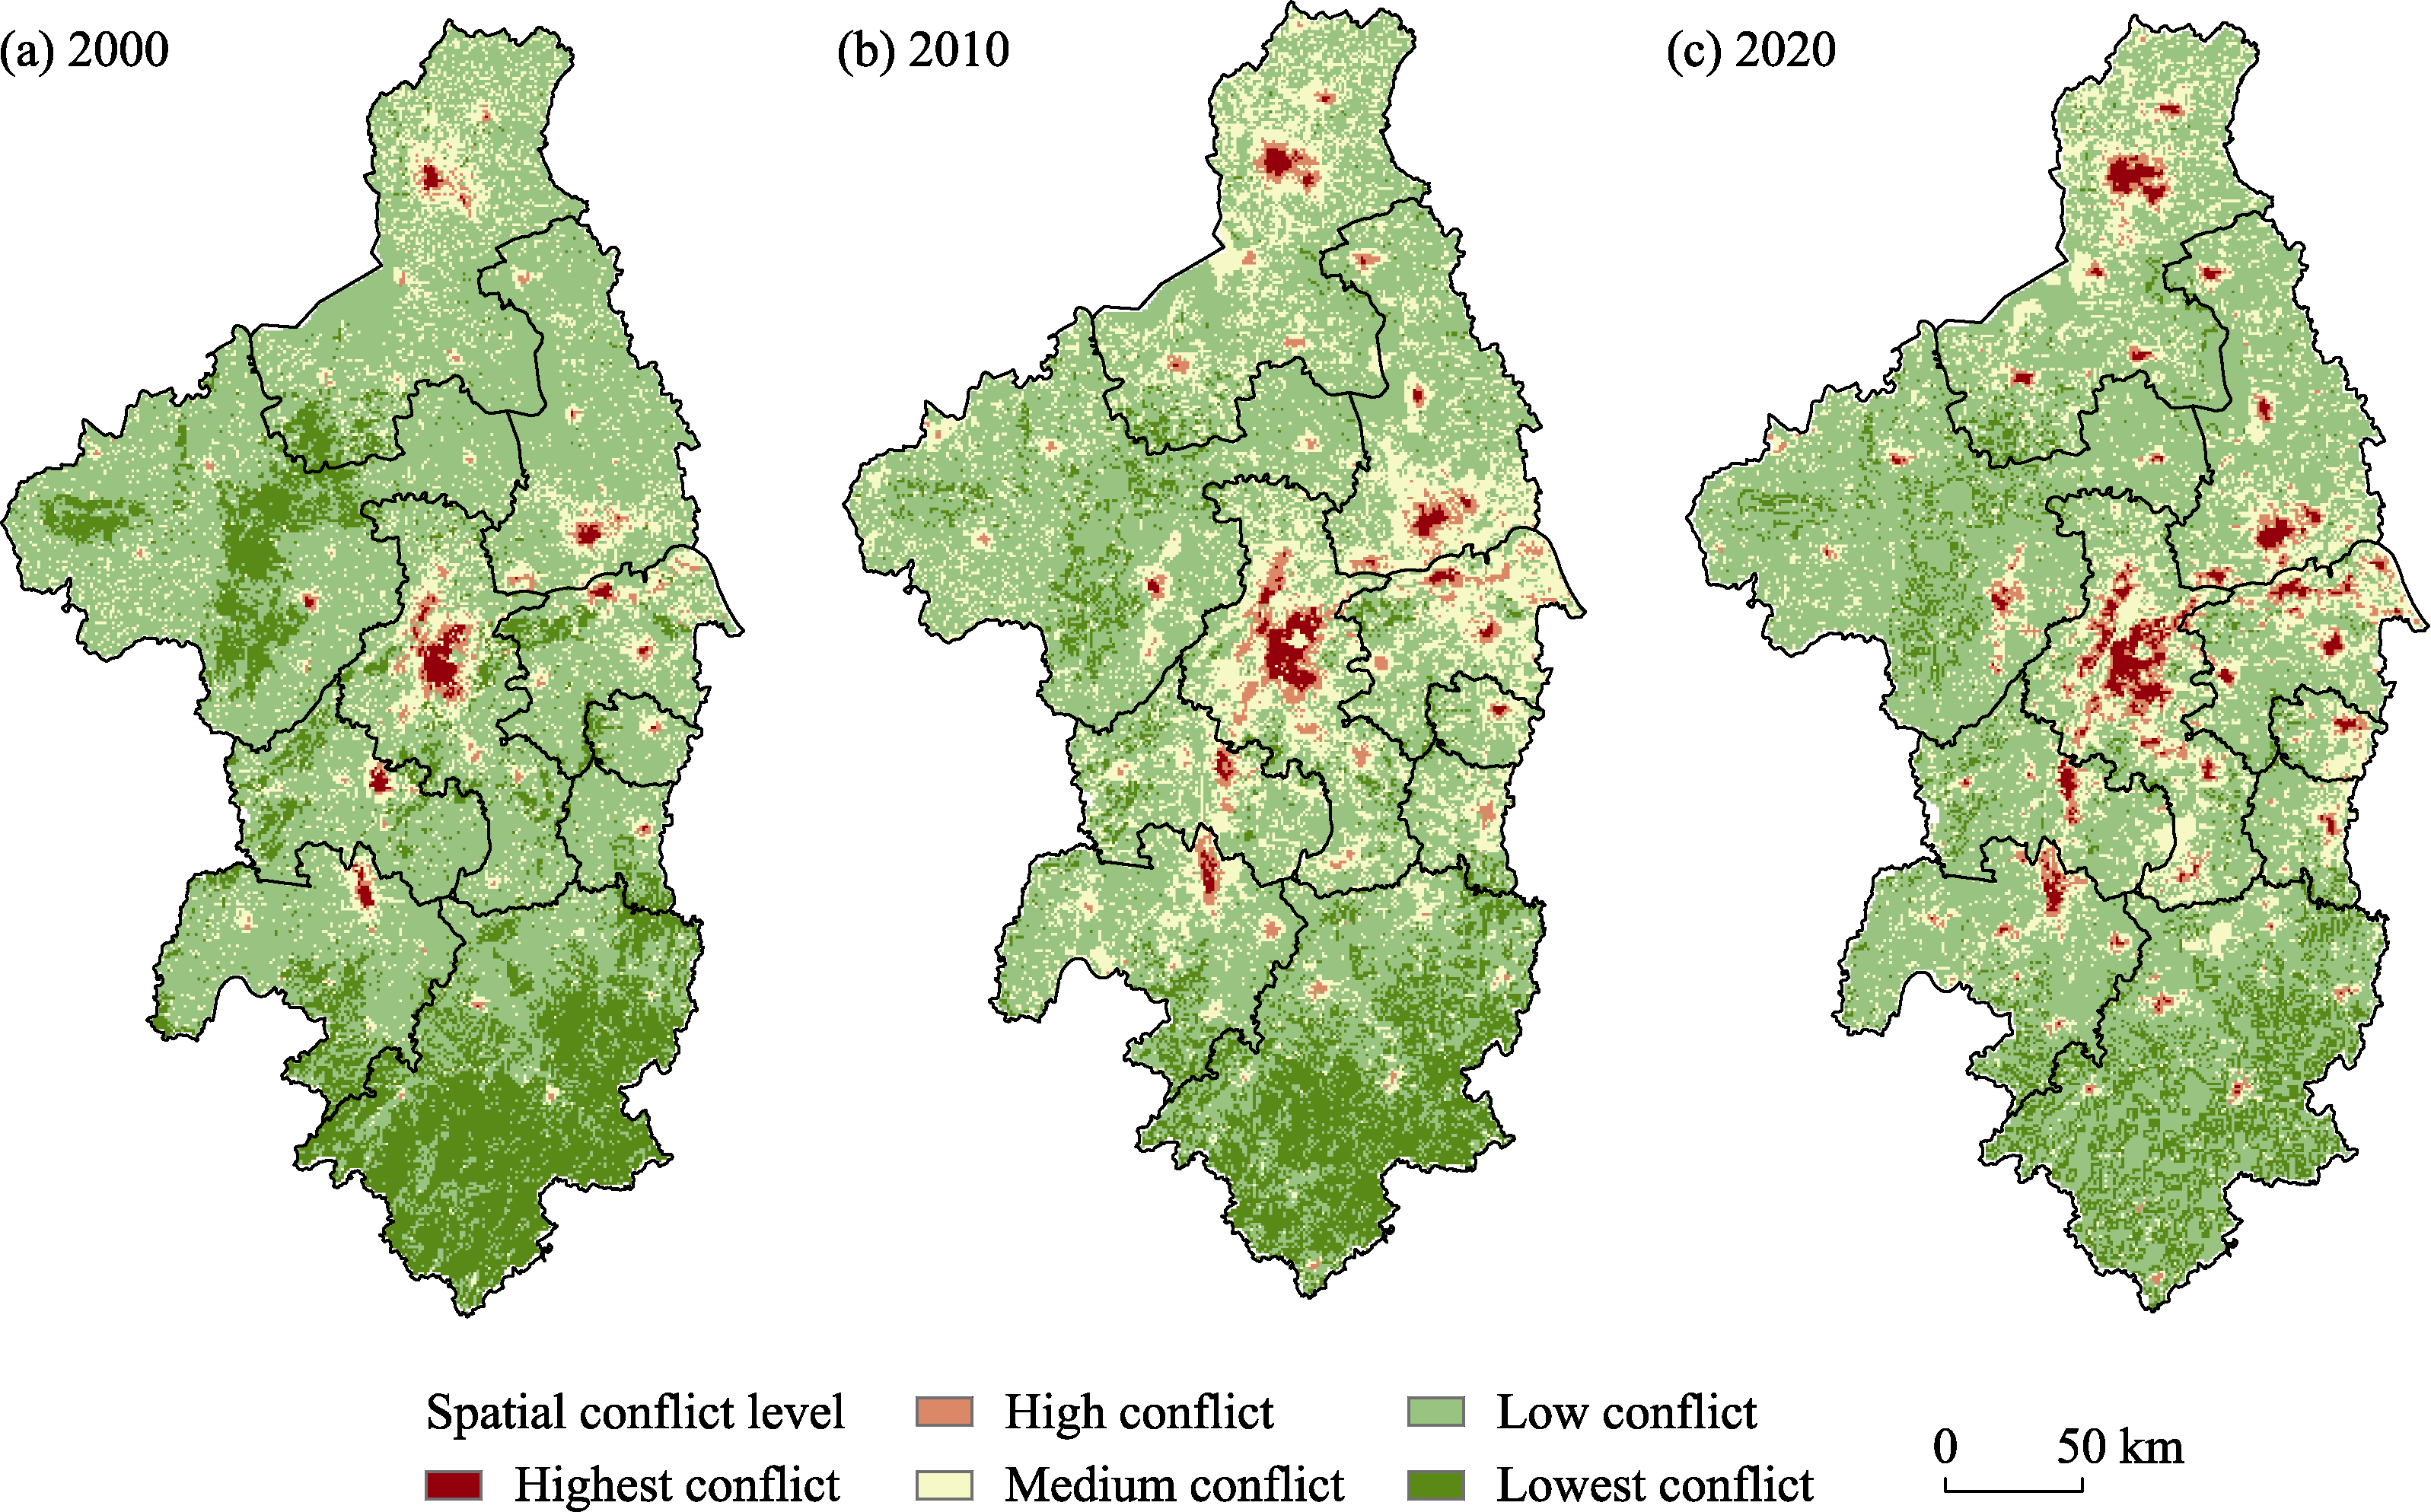
Distribution of ecological-economic spatial conflict in Nanjing Metropolitan Area (a. 2000; b. 2010; c. 2020)
Table 5
Area composition of different conflict types in Nanjing Metropolitan Area (%)
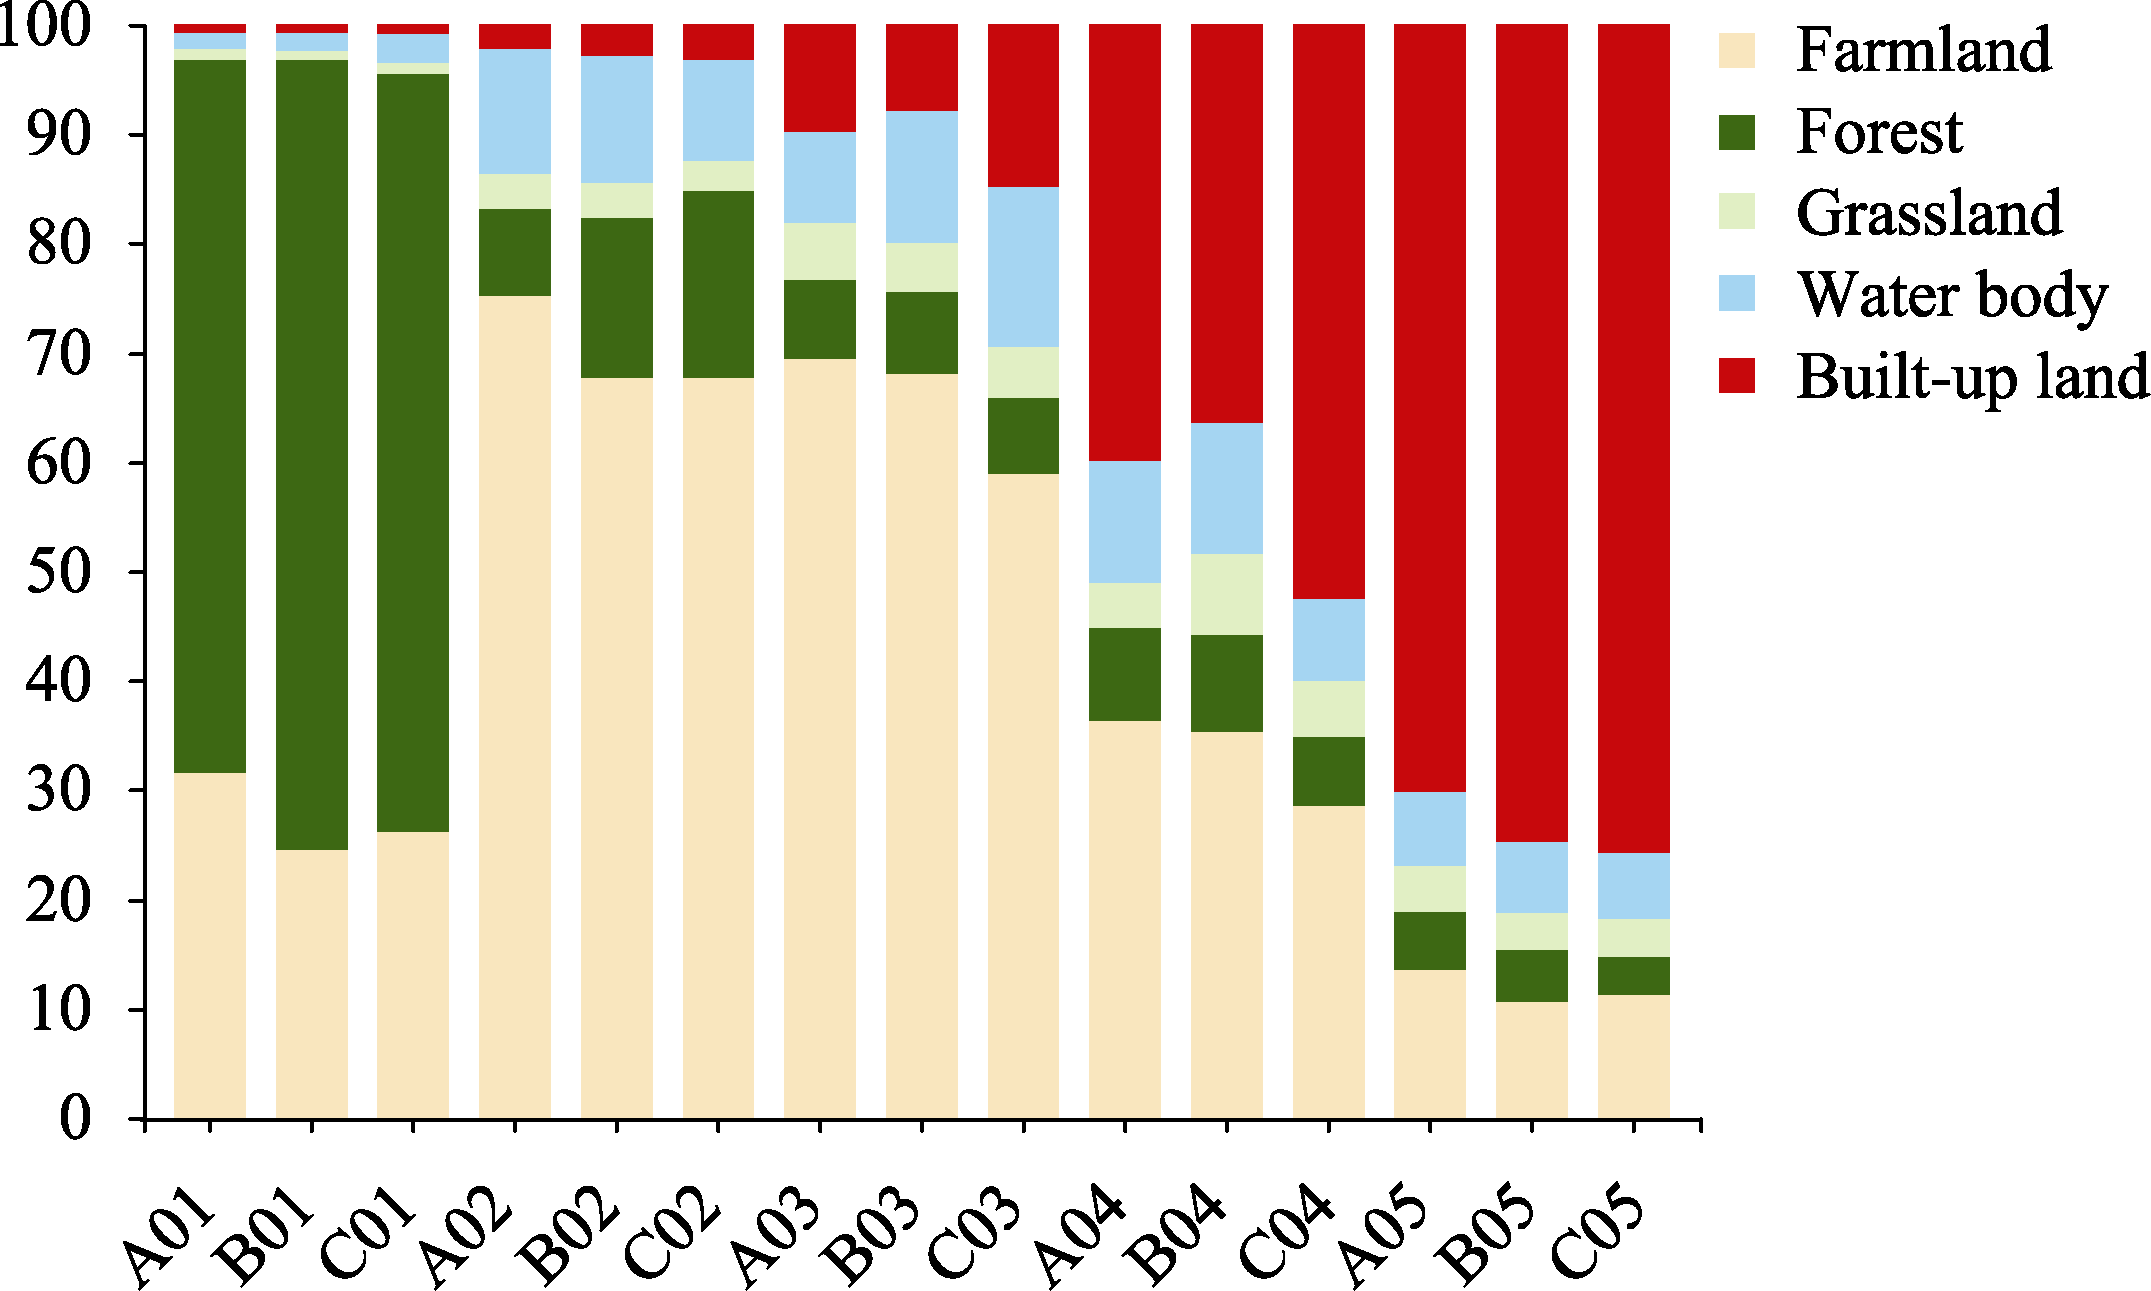
Figure 7
Composition of land use in different years of each conflict type in Nanjing Metropolitan Area
(A, B and C refer to 2000, 2010 and 2020; 01, 02, 03, 04 and 05 refer to lowest, low, medium, high, highest spatial conflict levels, respectively.)
Table 6
Area and proportion of each main functional area plan type in Nanjing Metropolitan Area
Table 7
The PLUS model development zone setting in Nanjing Metropolitan Area
Table 8
Description table of different scenario settings in Nanjing Metropolitan Area
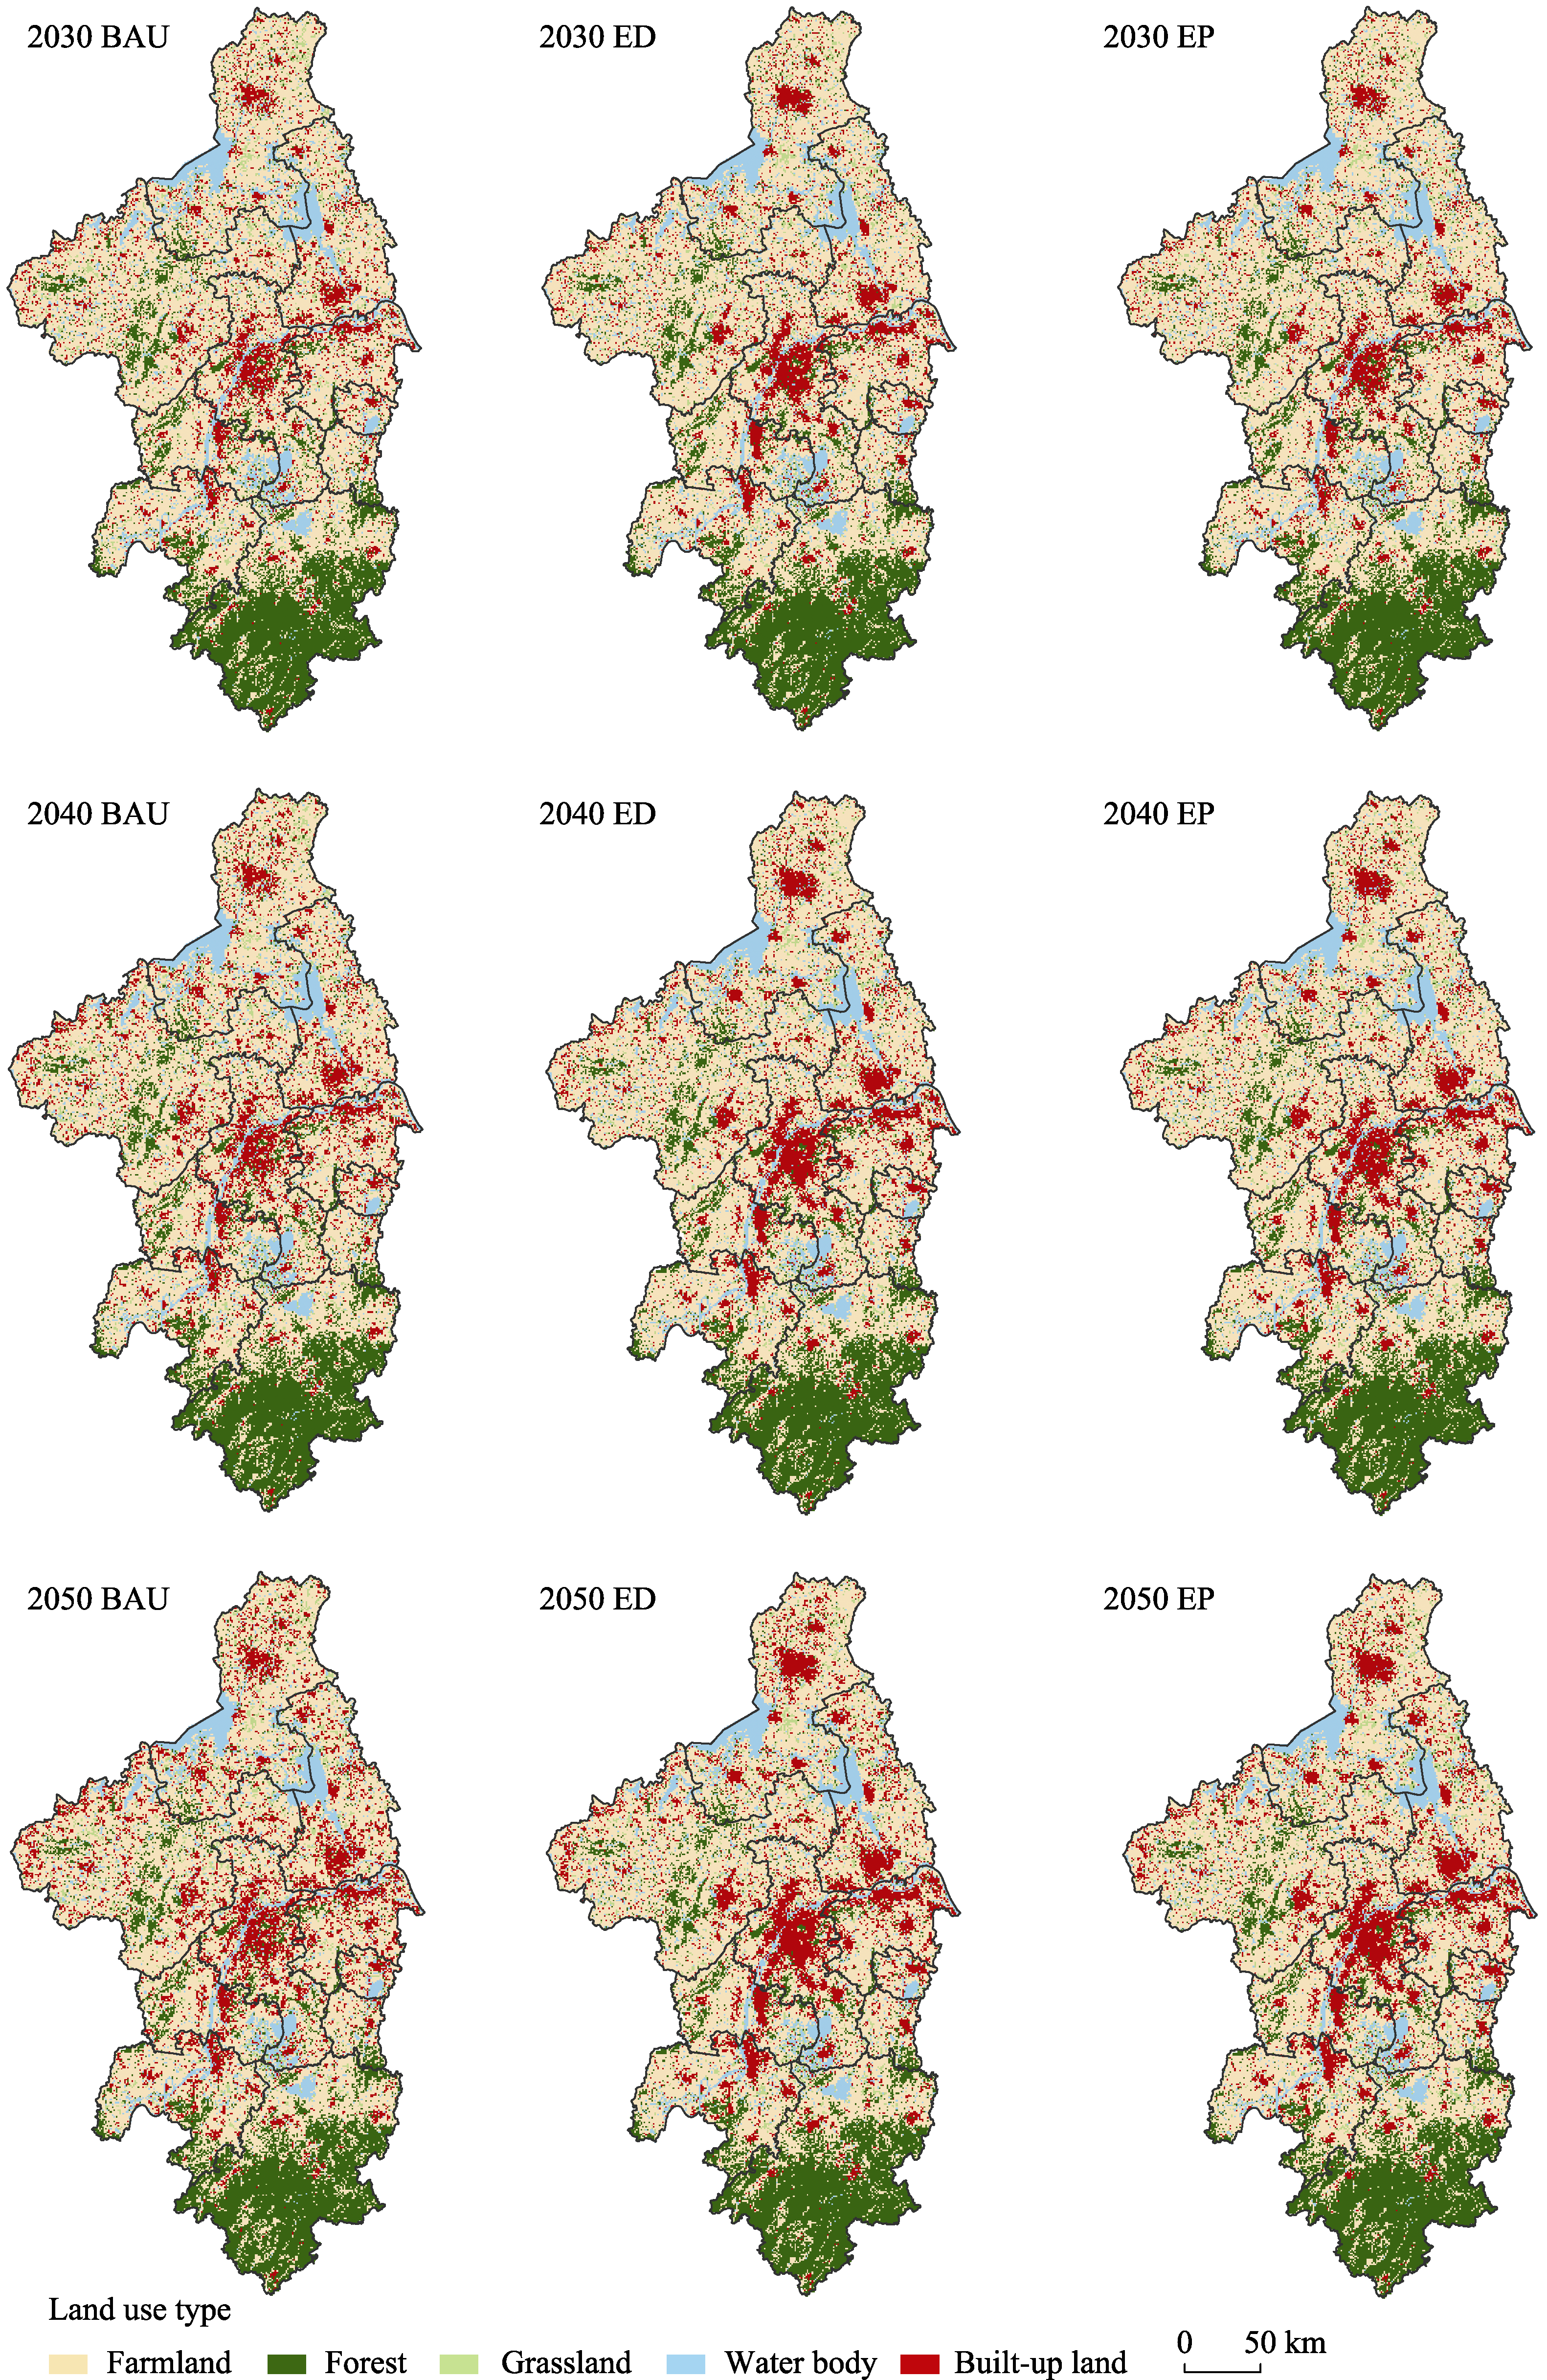
Figure 9
Land use of Nanjing Metropolitan Area under different scenarios in 2030-2050
Table 9
Land use prediction of Nanjing Metropolitan Area in different scenarios