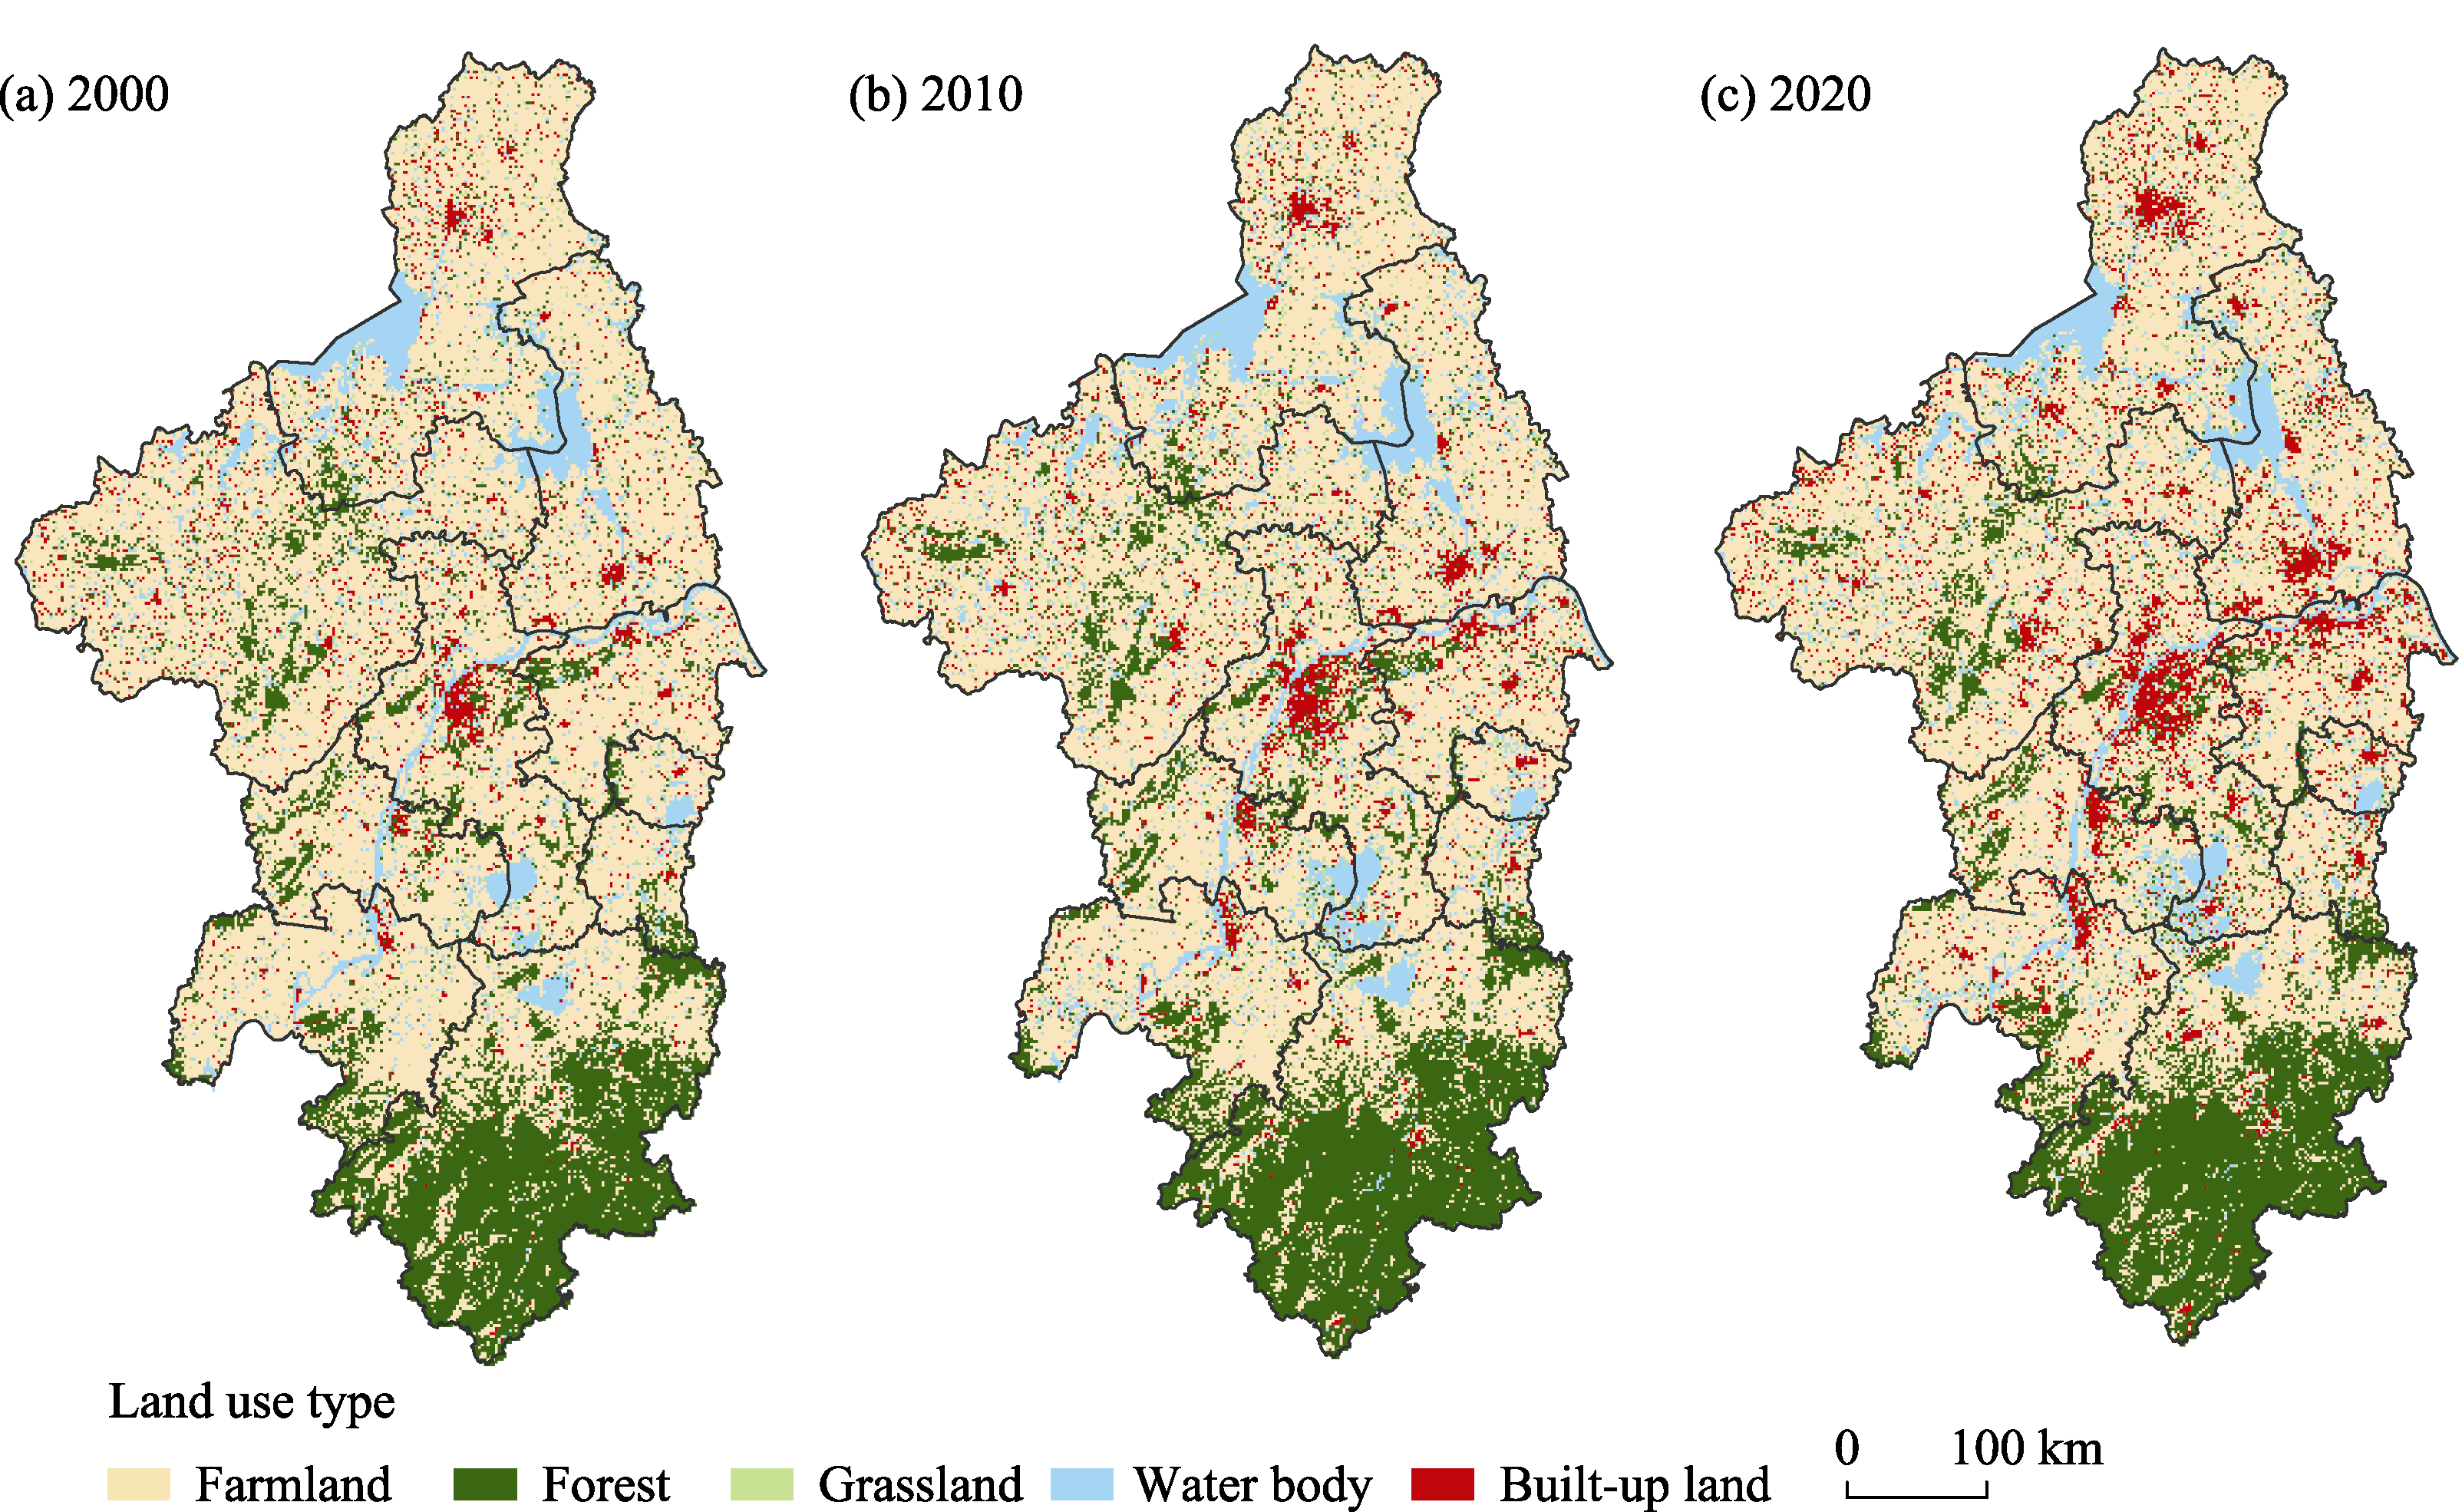
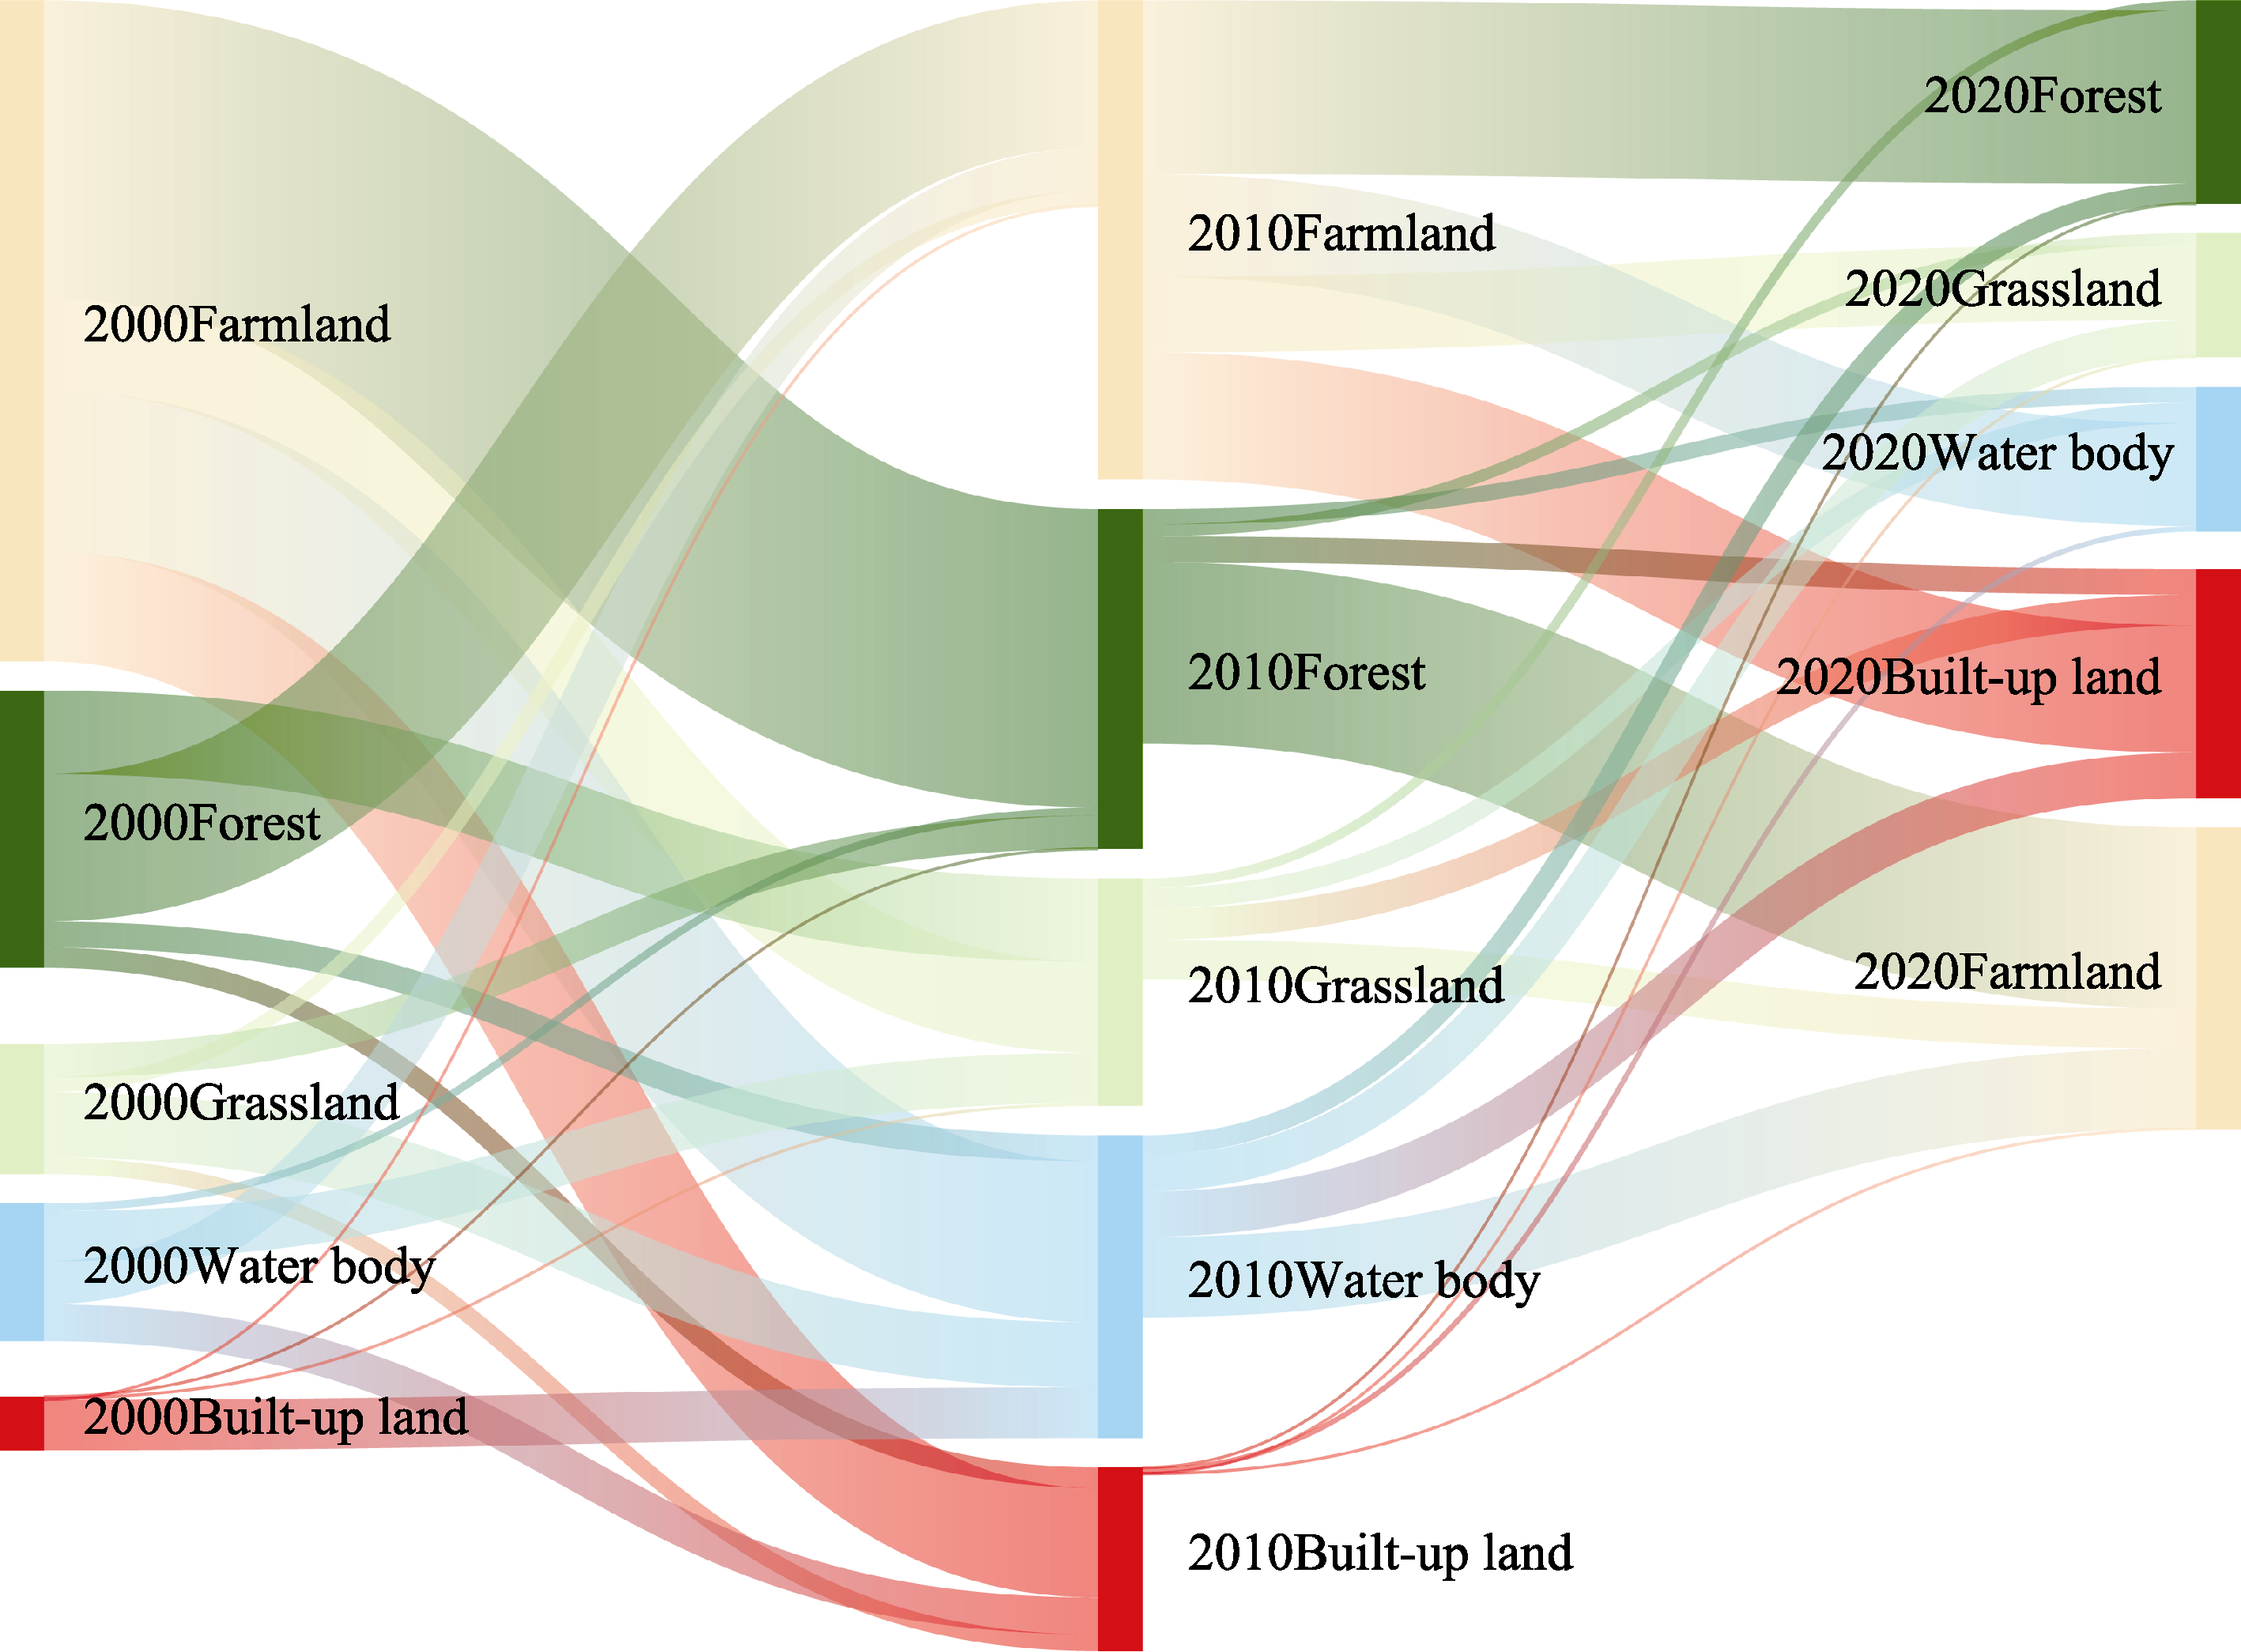
| Year | 2000 | 2010 | 2020 | |||
|---|---|---|---|---|---|---|
| Land-use types (km2) | Area Proportion (%) | Area Proportion (%) | Area Proportion (%) | |||
| Farmland | 42,791 | 65.40 | 39,790 | 60.8 | 38,620 | 59.0 |
| Forest | 12,696 | 19.40 | 13,088 | 20.0 | 12,883 | 19.7 |
| Grassland | 1493 | 2.28 | 2176 | 3.3 | 2329 | 3.6 |
| Water body | 5735 | 8.76 | 6812 | 10.4 | 6566 | 10.0 |
| Built-up land | 2725 | 4.16 | 3575 | 5.5 | 5043 | 7.7 |