×
模态框(Modal)标题
在这里添加一些文本
关闭
关闭
提交更改
取消
确定并提交
×
模态框(Modal)标题
×
期刊
文章
图表
检索
EN
中文
首页
关于期刊
期刊介绍
数据库收录
期刊荣誉
编委会
投稿指南
在线期刊
当期目录
优先出版
过刊浏览
推荐文章
专题
按栏目浏览
阅读排行
下载排行
引用排行
E-mail Alert
RSS
期刊订阅
广告合作
联系我们
EN
中文
图/表 详细信息
Simulation of frozen ground distribution in northeast China based on a surface frost number model
ZHAN Daqing, MAN Haoran, ZANG Shuying, LI Miao
地理学报(英文版), 2022, 32(
8
): 1581-1600. DOI:
10.1007/s11442-022-2011-8
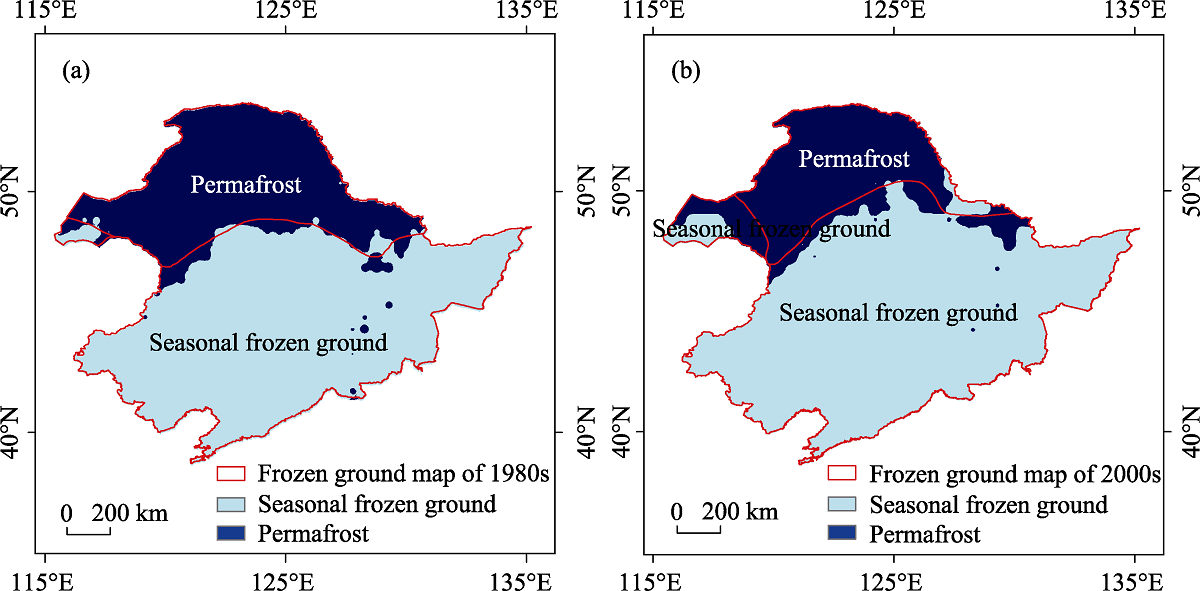
Figure 11
Spatial differences in permafrost distribution between the frozen ground map and simulation result for the 1980s (a) and the frozen ground map and simulation result for the 2000s (b) in the frozen ground region of northeast China
本文的其它图/表
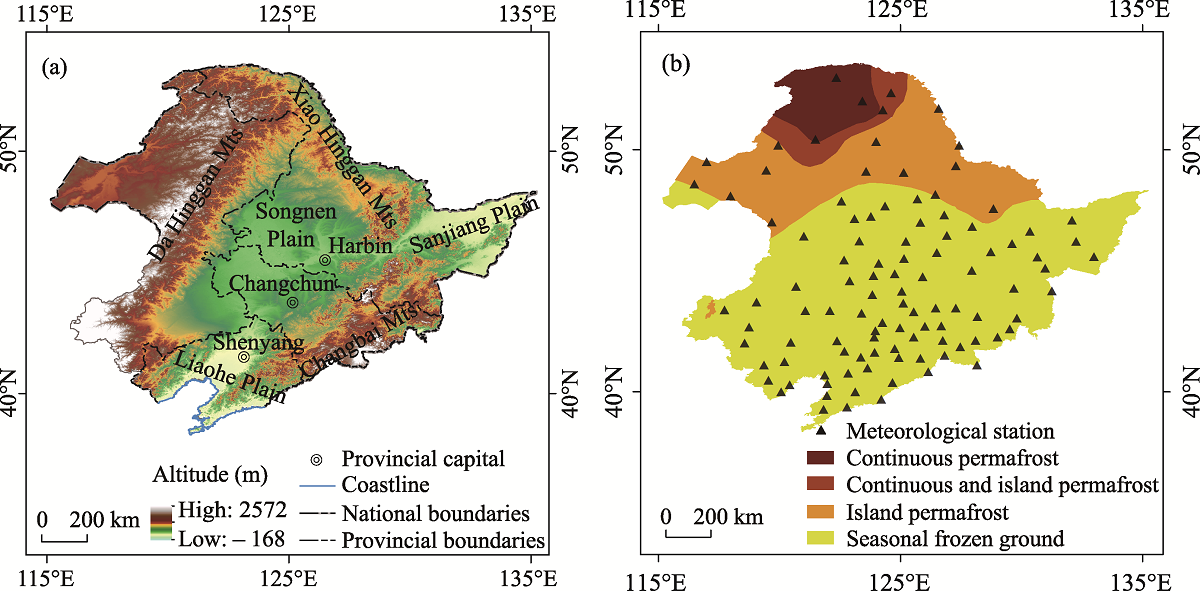
Figure 1
Location of the study area (a) and permafrost distribution (b) in the frozen ground region of northeast China
Table 1
Description of the datasets adopted in this study
Figure 2
Flowchart of research design
Table 2
N
f
/N
t
values of various land cover types in the frozen ground region of northeast China
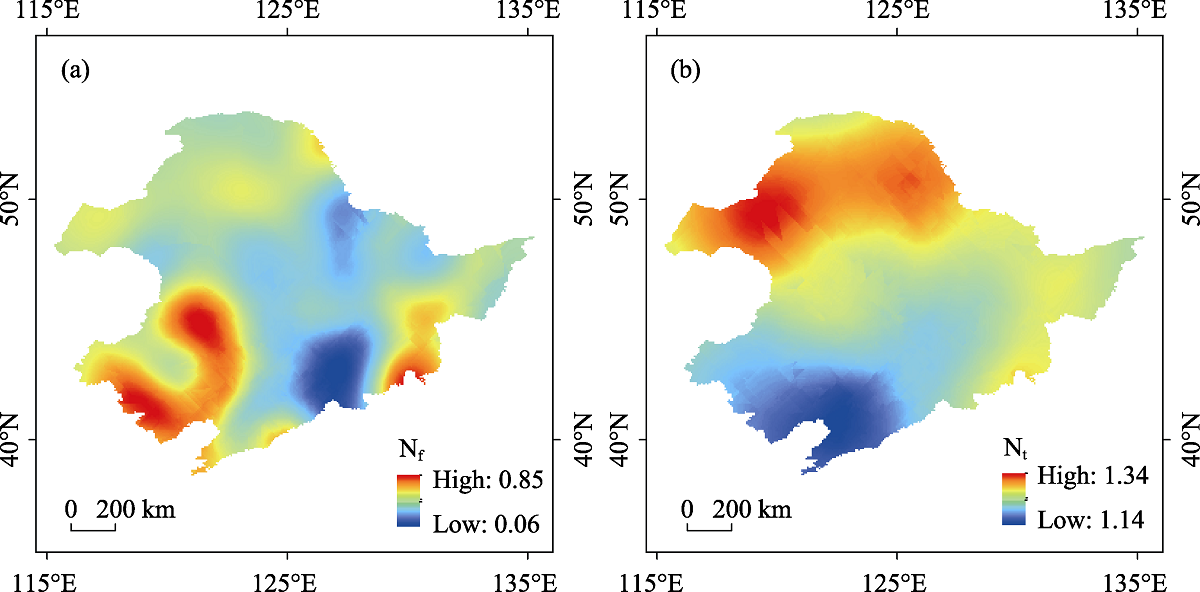
Figure 3
Spatial distribution of N
f
(a) and N
t
(b) in the frozen ground region of northeast China from 1977 to 2017
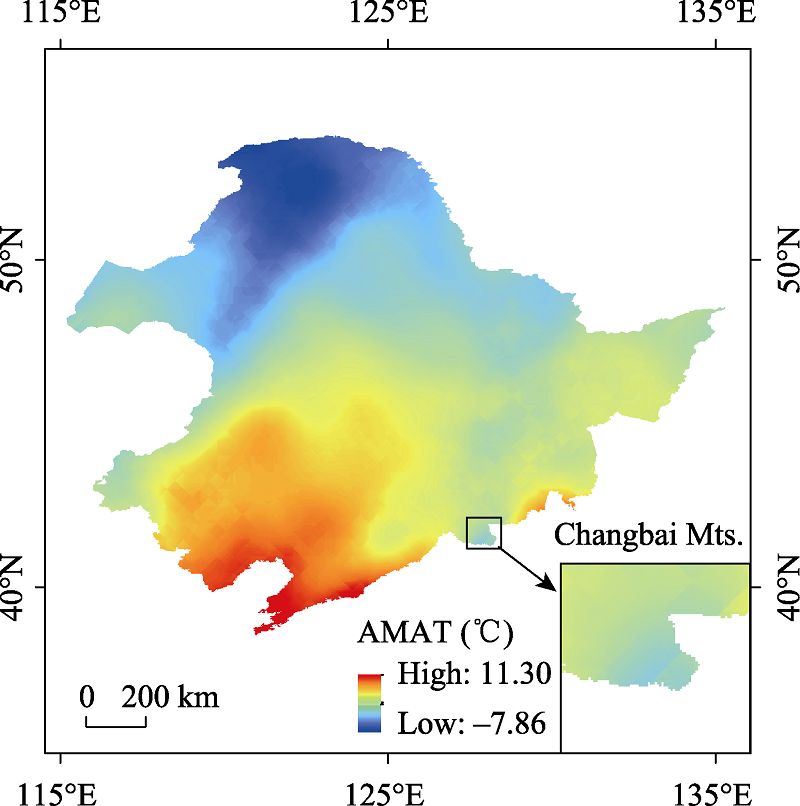
Figure 4
Spatial distribution of annual mean air temperature (AMAT) 1900-2017 in the frozen ground region of northeast China
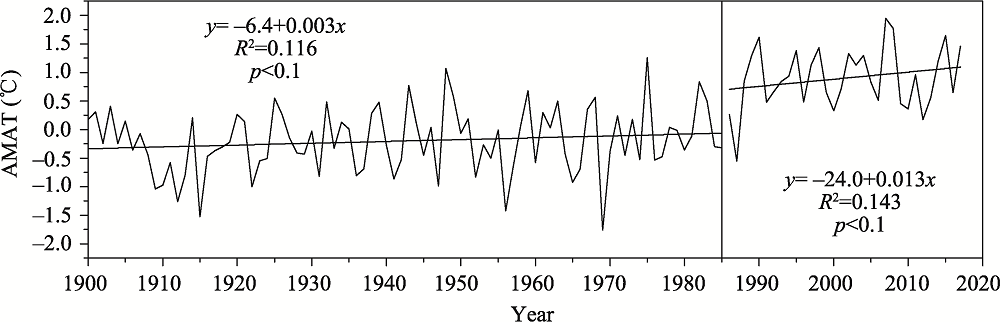
Figure 5
Annual mean air temperature (AMAT) in the frozen ground region of northeast China from 1900 to 2017 (marginally significant at the p<0.1 level, with a 90% confidence level)
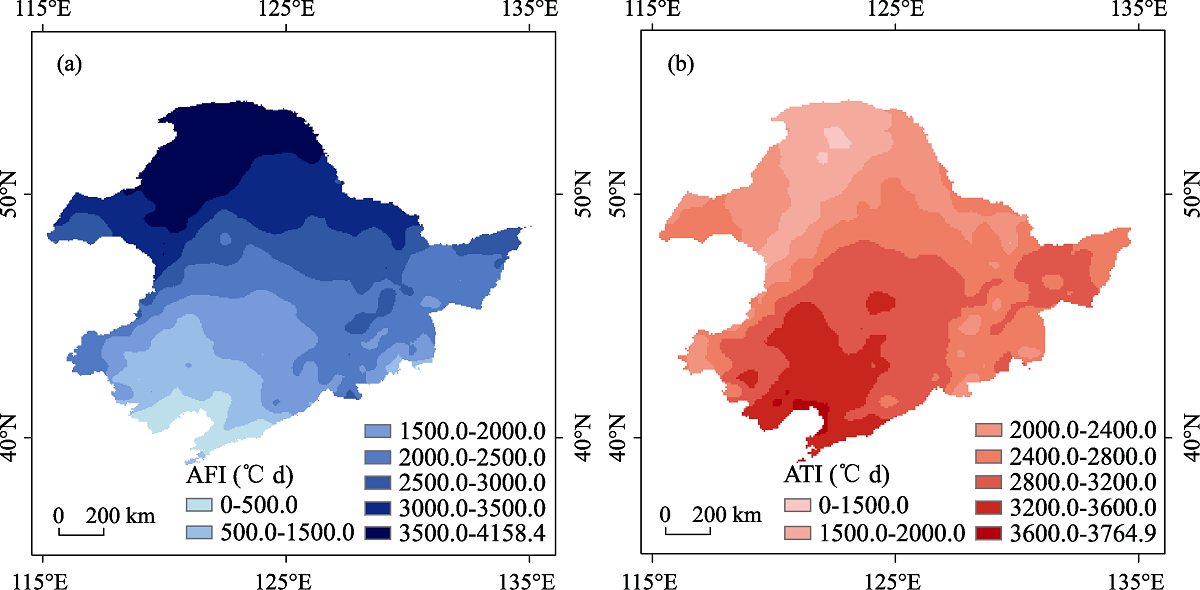
Figure 6
The average (a) air freezing index (AFI) and (b) air thawing index (ATI) (℃ d) over the period from 1900 to 2017 in the frozen ground region of northeast China
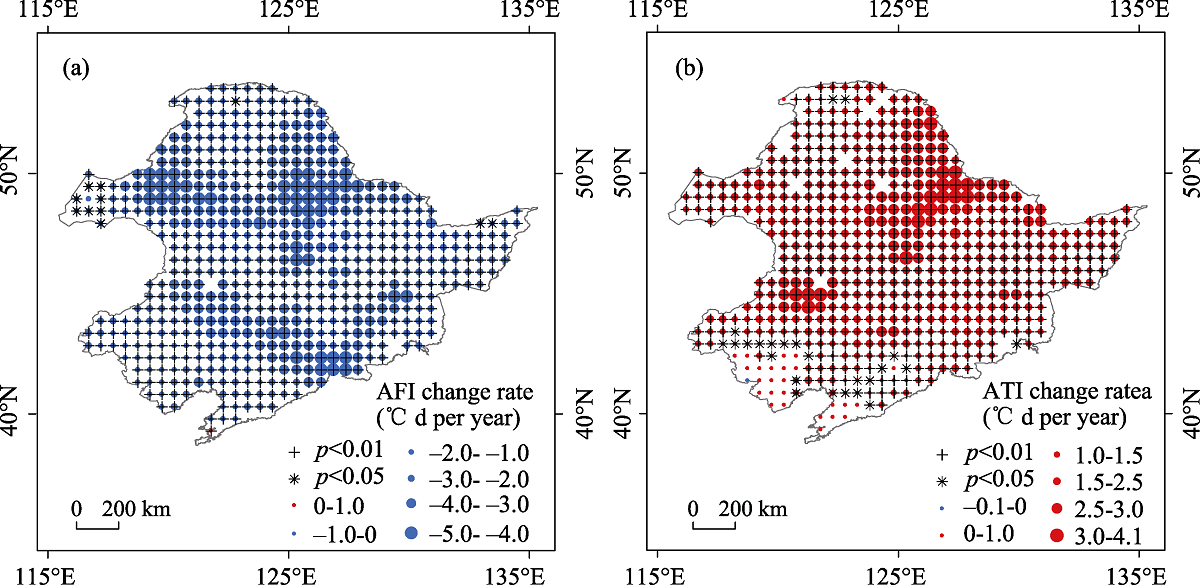
Figure 7
Spatial distribution of the rate of change in (a) air freezing index (AFI) and (b) air thawing index (ATI) over the period from 1900 to 2017 in the frozen ground region of northeast China (the plus sign indicates p<0.01 and the asterisk indicates p<0.05)
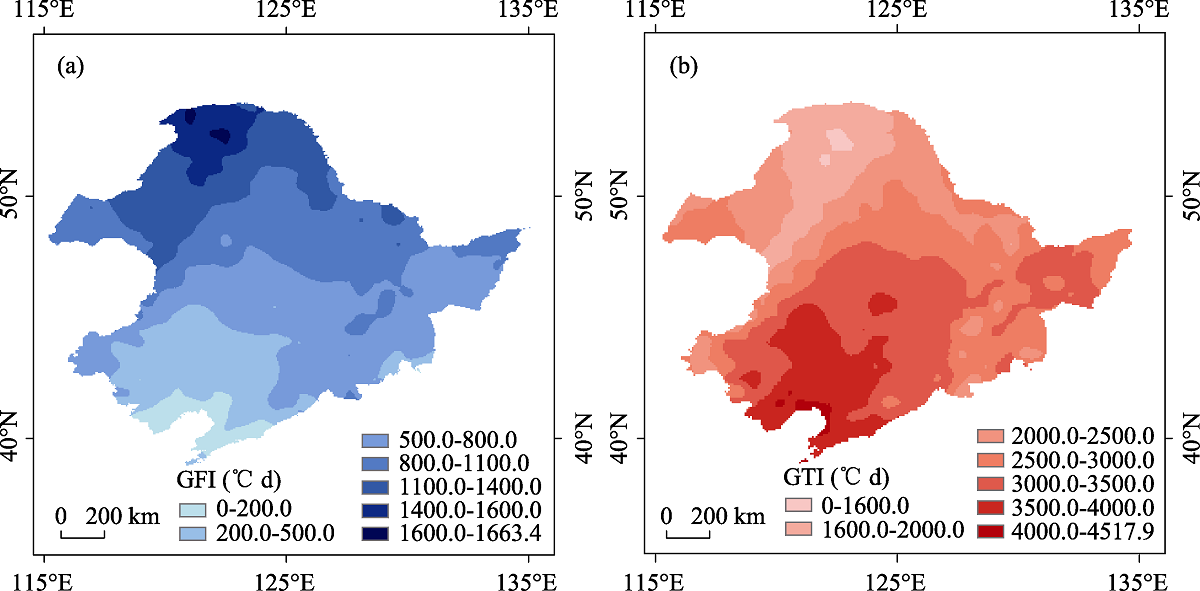
Figure 8
The average (a) ground surface freezing index (GFI) and (b) ground surface thawing index (GTI) (℃ d) over the period from 1900 to 2017 in the frozen ground region of northeast China
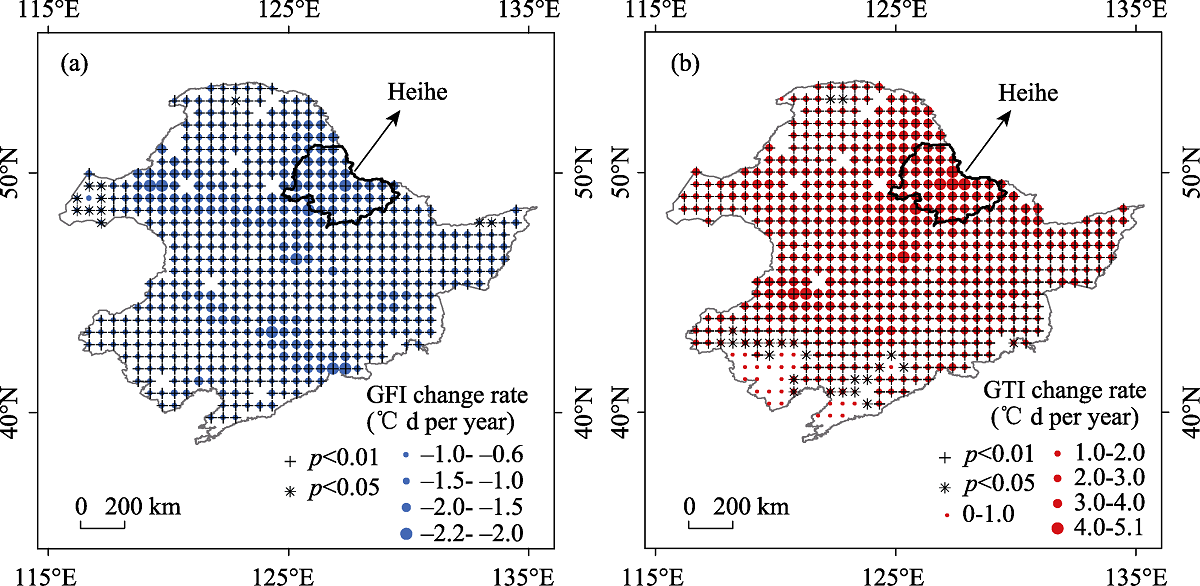
Figure 9
Spatial distribution of the rate of change in (a) ground surface freezing index (GFI) and (b) ground surface thawing index (GTI) over the period from 1900 to 2017 in the frozen ground region of northeast China (the plus sign indicates p<0.01 and the asterisk indicates p<0.05)
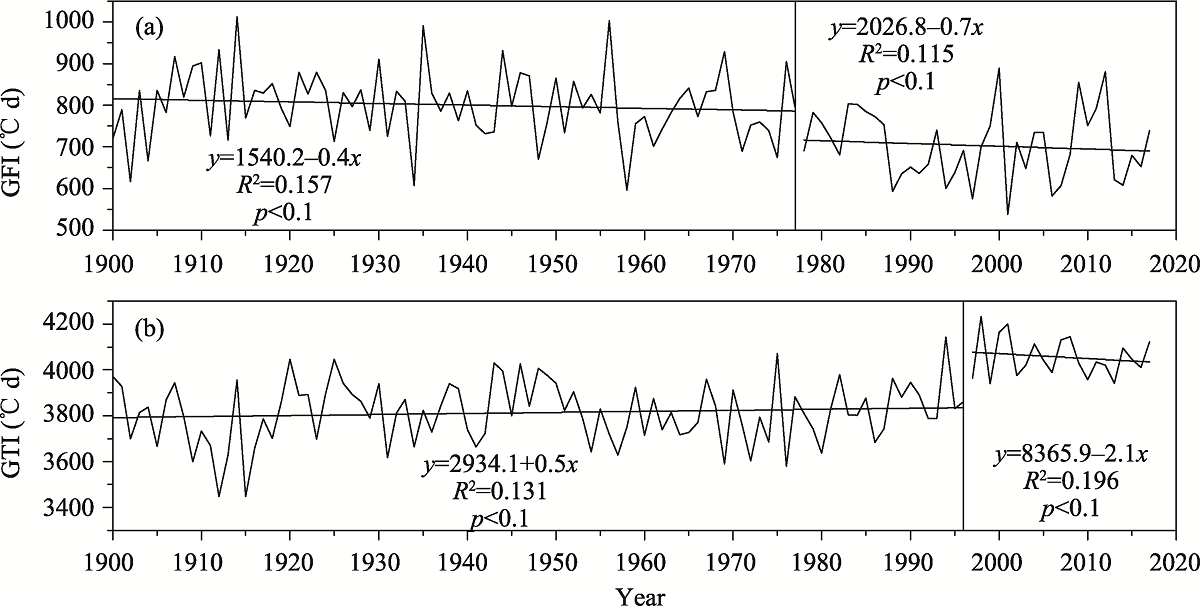
Figure 10
Time series of (a) ground surface freezing index (GFI) and (b) ground surface thawing index (GTI) during the period from 1900 to 2017 in the frozen ground region of northeast China (marginally significant at the p<0.1 level, with a 90% confidence level)
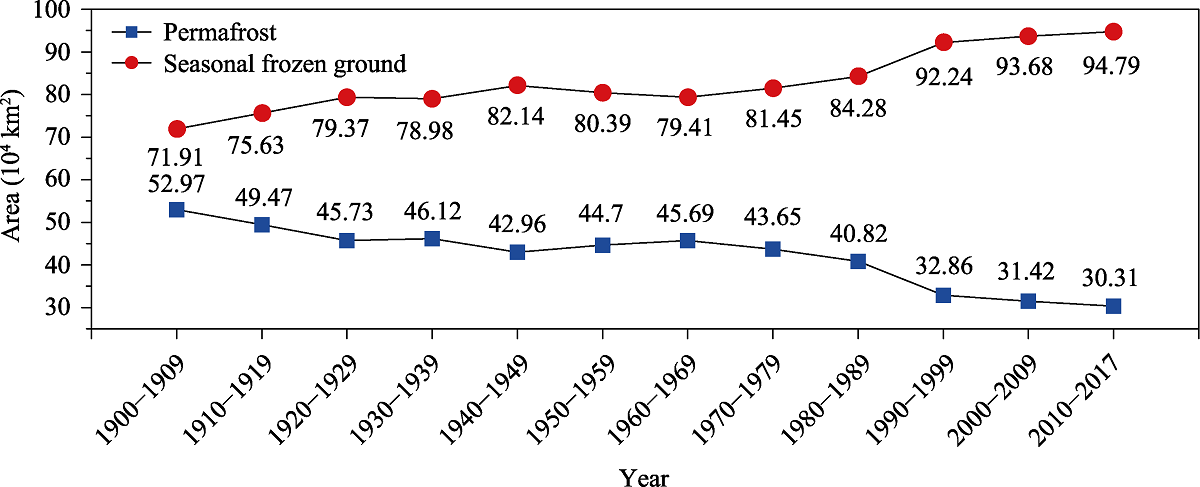
Figure 12
Changes in permafrost and seasonal frozen ground area in the frozen ground region of northeast China from 1900 to 2017
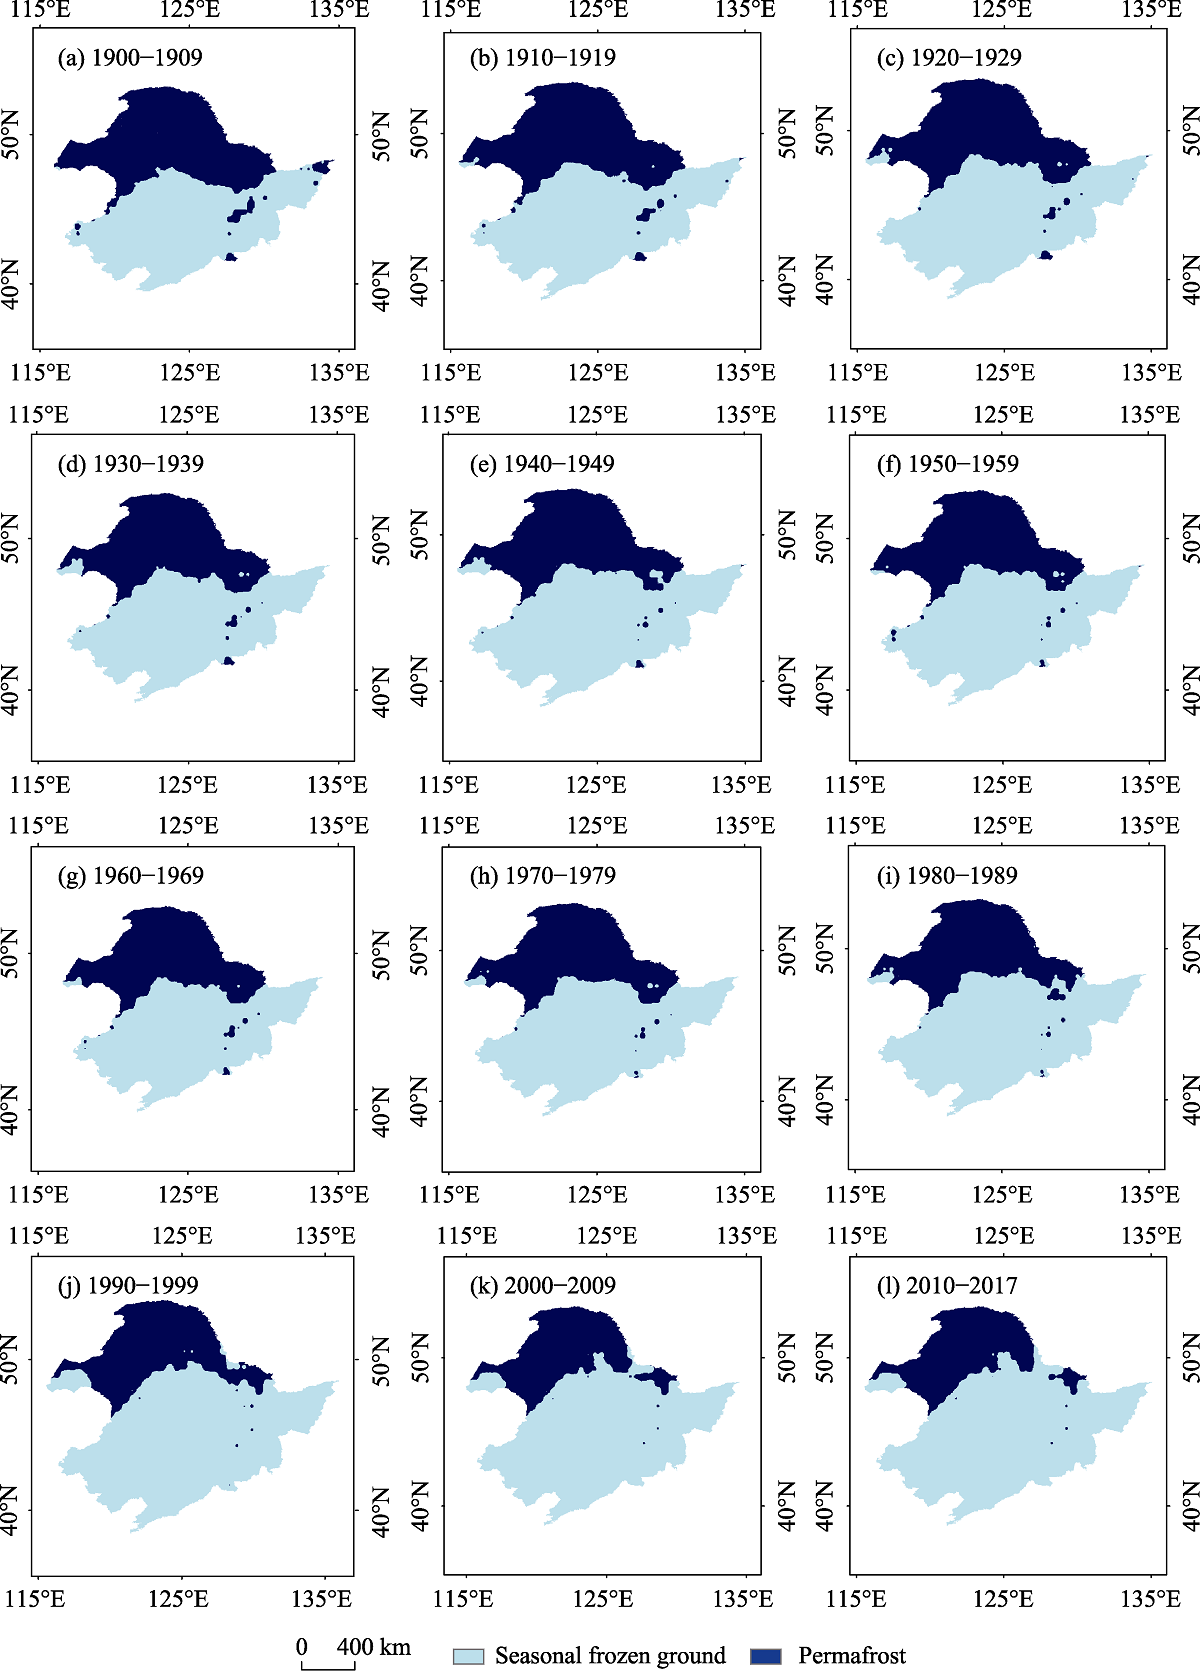
Figure 13
Decadal changes in permafrost in the frozen ground region of northeast China from 1900 to 2017
Table 3
Existing frozen ground map and simulated permafrost areas in the frozen ground region of northeast China
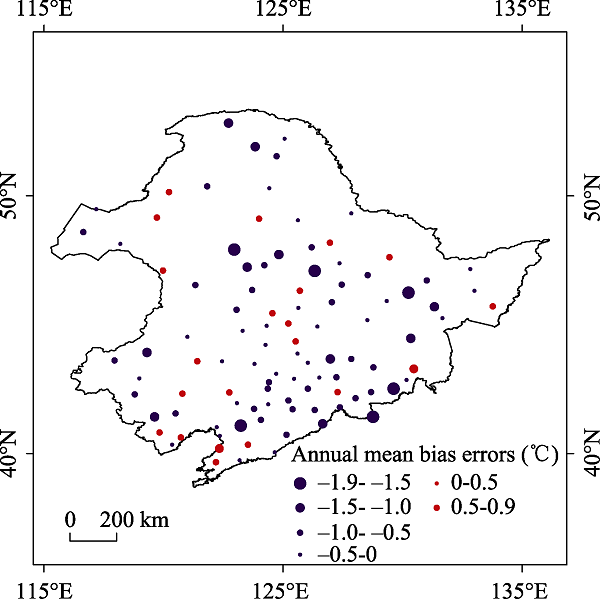
Figure A1
The spatial distribution of annual mean bias errors between the monthly air temperature reanalysis data and the meteorological station data in the frozen ground region of northeast China
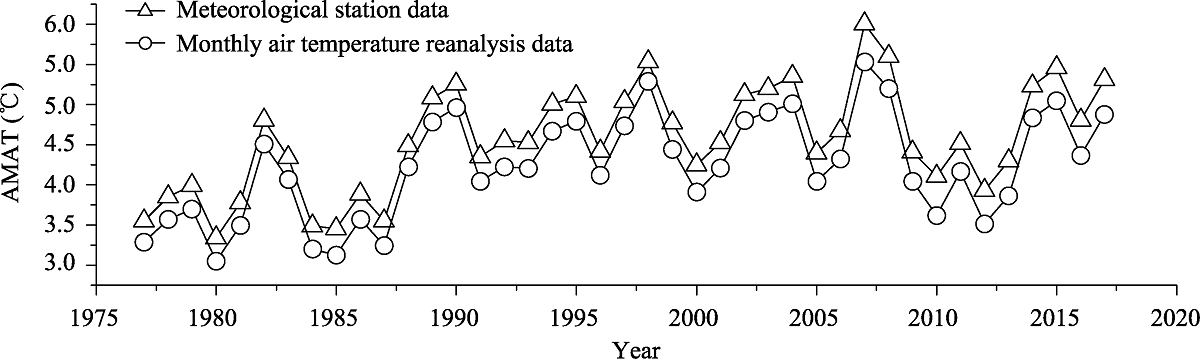
Figure A2
Changes in annual mean air temperature (AMAT) in the frozen ground region of northeast China from 1977 to 2017
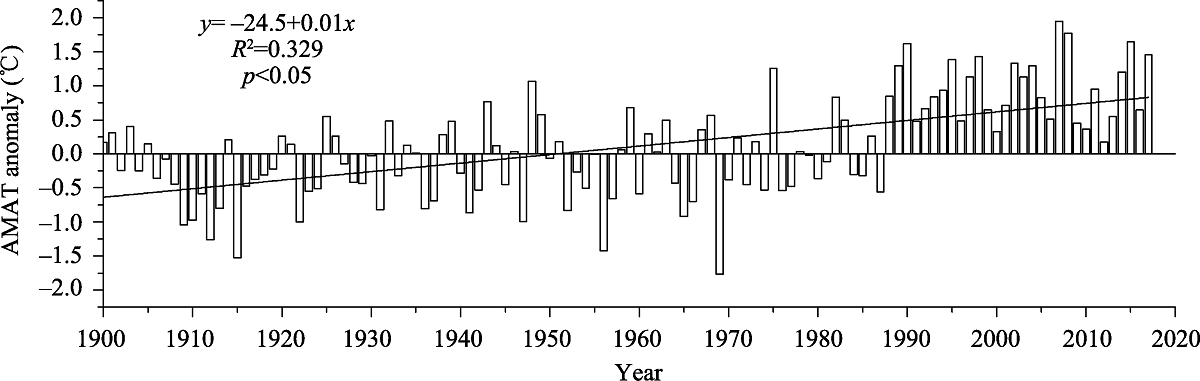
Figure A3
Time series of regional anomalies in annual mean air temperature (1900-2017) in the frozen ground region of northeast China
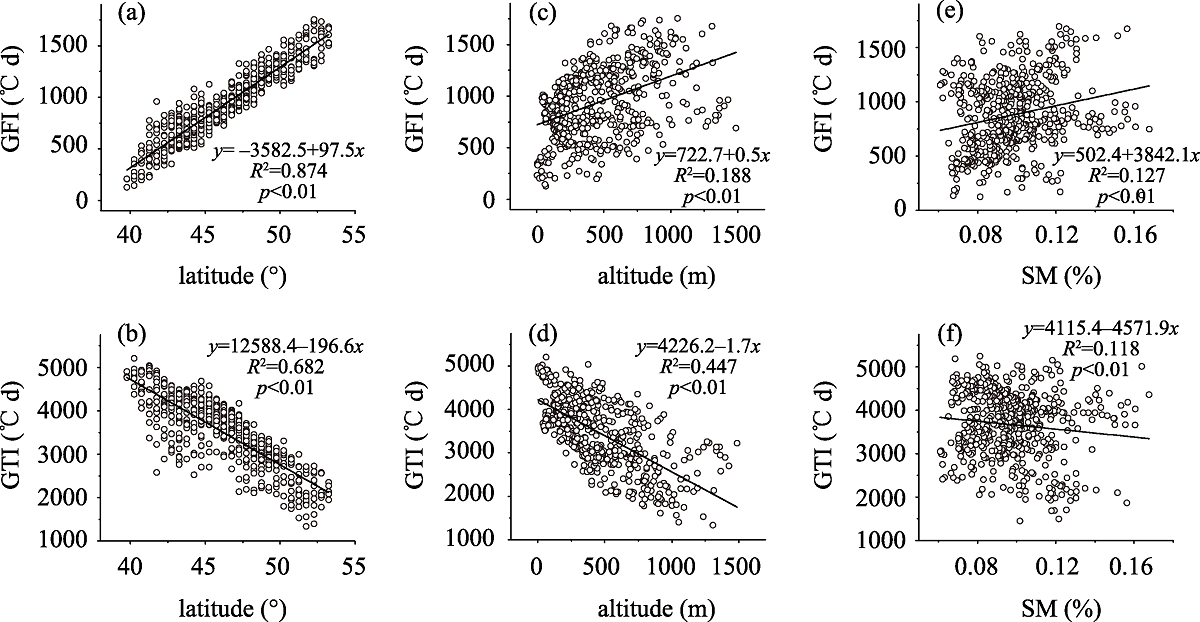
Figure A4
Correlation of GFI with latitude (a); correlation of GTI with latitude (b); correlation of GFI with altitude (c); correlation of GTI with altitude (d); correlation of GFI with SM (e); and correlation of GTI with SM (f)