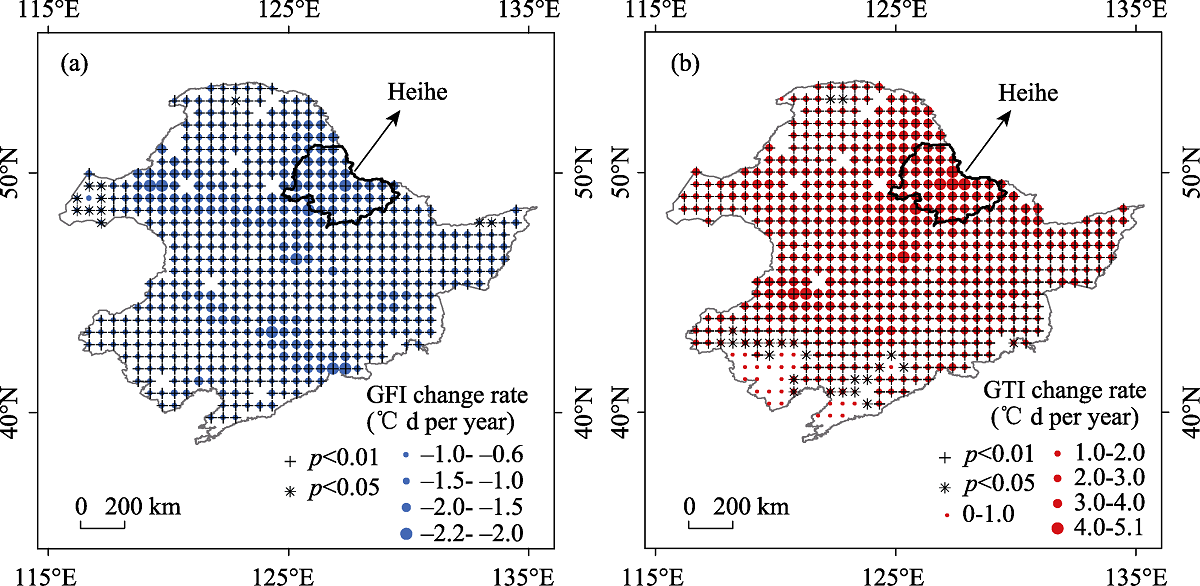
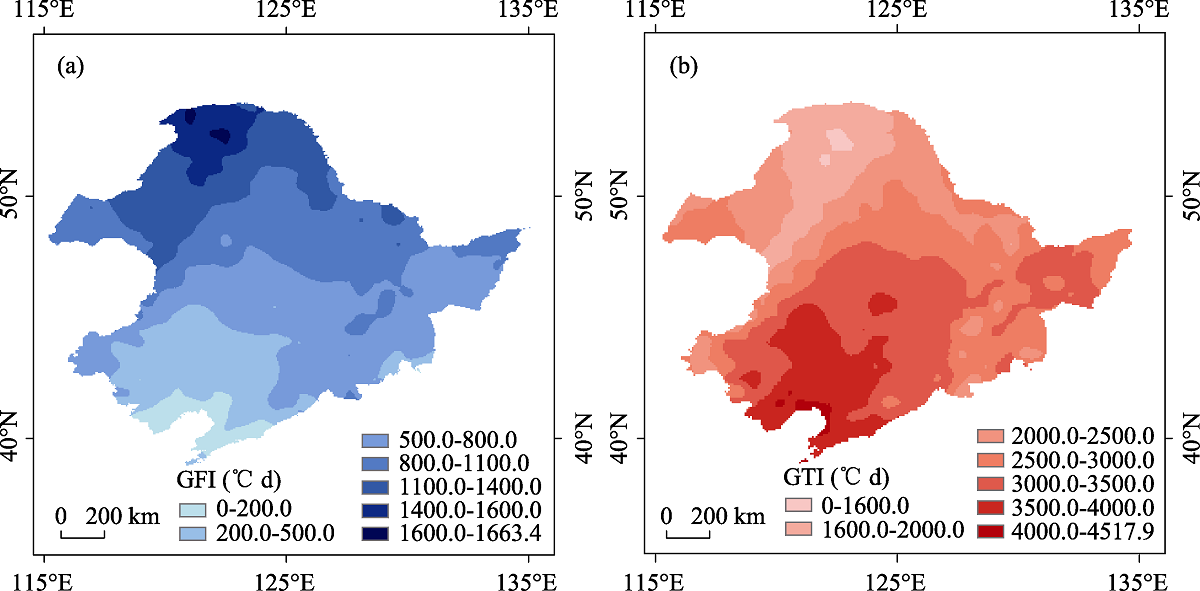
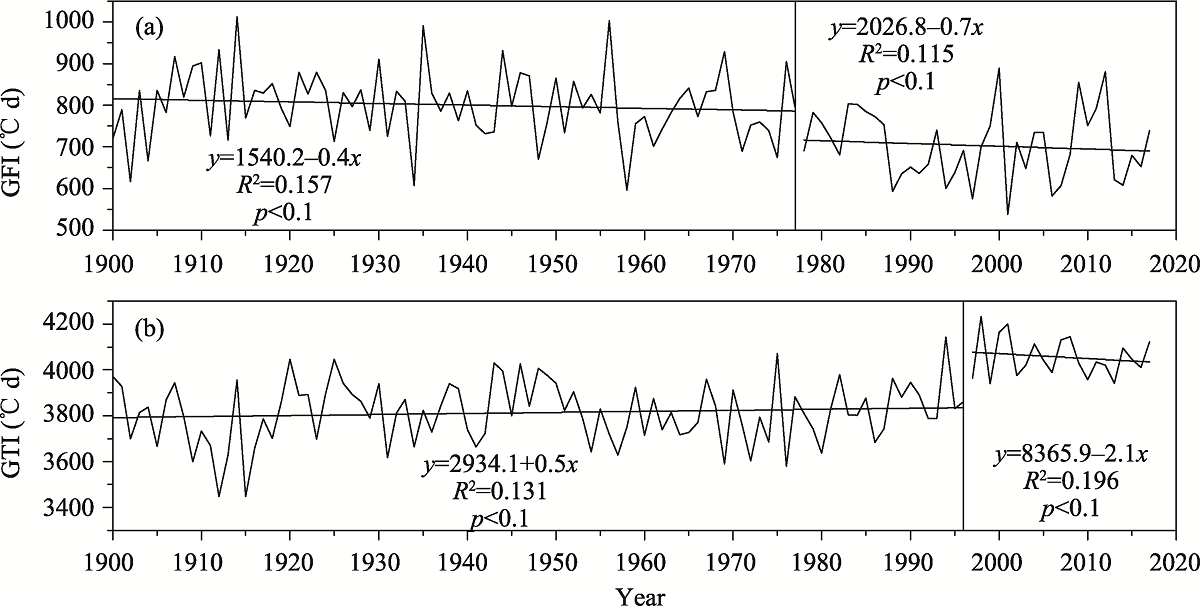
Figure 9 Spatial distribution of the rate of change in (a) ground surface freezing index (GFI) and (b) ground surface thawing index (GTI) over the period from 1900 to 2017 in the frozen ground region of northeast China (the plus sign indicates p<0.01 and the asterisk indicates p<0.05)
本文的其它图/表