×
模态框(Modal)标题
在这里添加一些文本
Close
Close
Submit
Cancel
Confirm
×
模态框(Modal)标题
×
Journal
Article
Figure
Search
EN
中文
Home
About Journal
About Journal
Indexed in
Awards
Editorial Board
Guide for Authors
Browse
Current Issue
Online First
Archive
Highlights
Topic
Archive by Subject
Most Viewed
Most Download
Most Cited
E-mail Alert
RSS
Subscribe
Advertisement
Contact us
EN
中文
Figure/Table detail
Multi-scale analysis of spatiotemporal evolution and driving factors of eco-environmental quality in a Ningxia irrigation district, China
LI Zequan, CHAI Mingtang, ZHU Lei, HE Junjie, DING Yimin, XU Fengkun, XU Xiyuan
Journal of Geographical Sciences
, 2026, 36(
2
): 471-493. DOI:
10.1007/s11442-026-2456-2
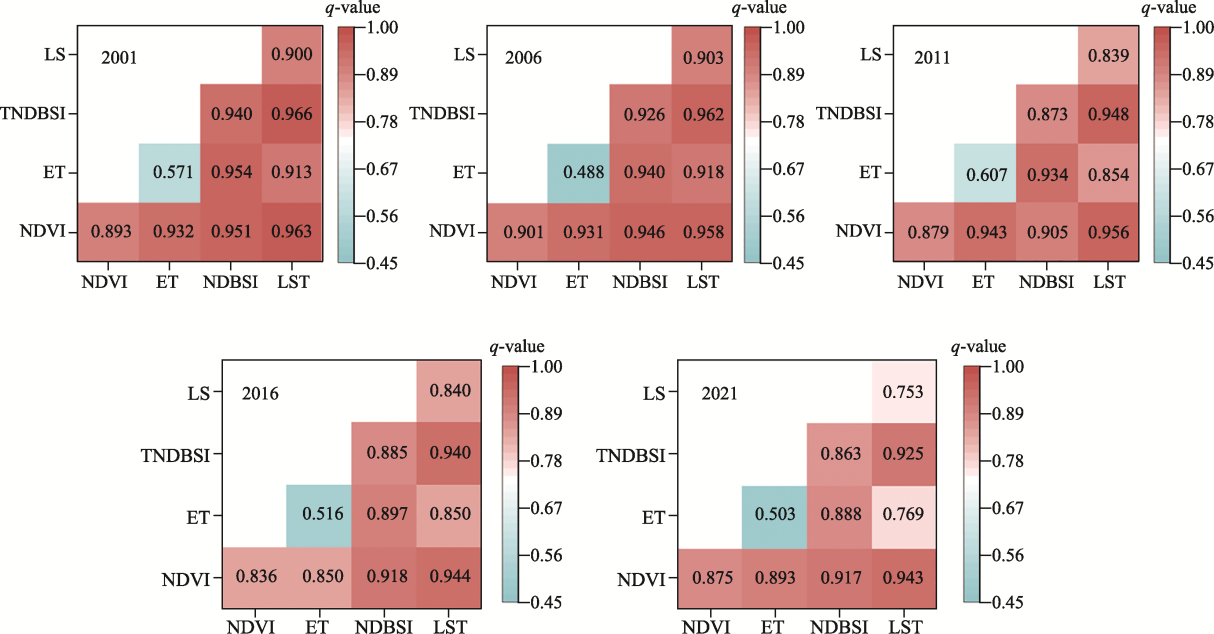
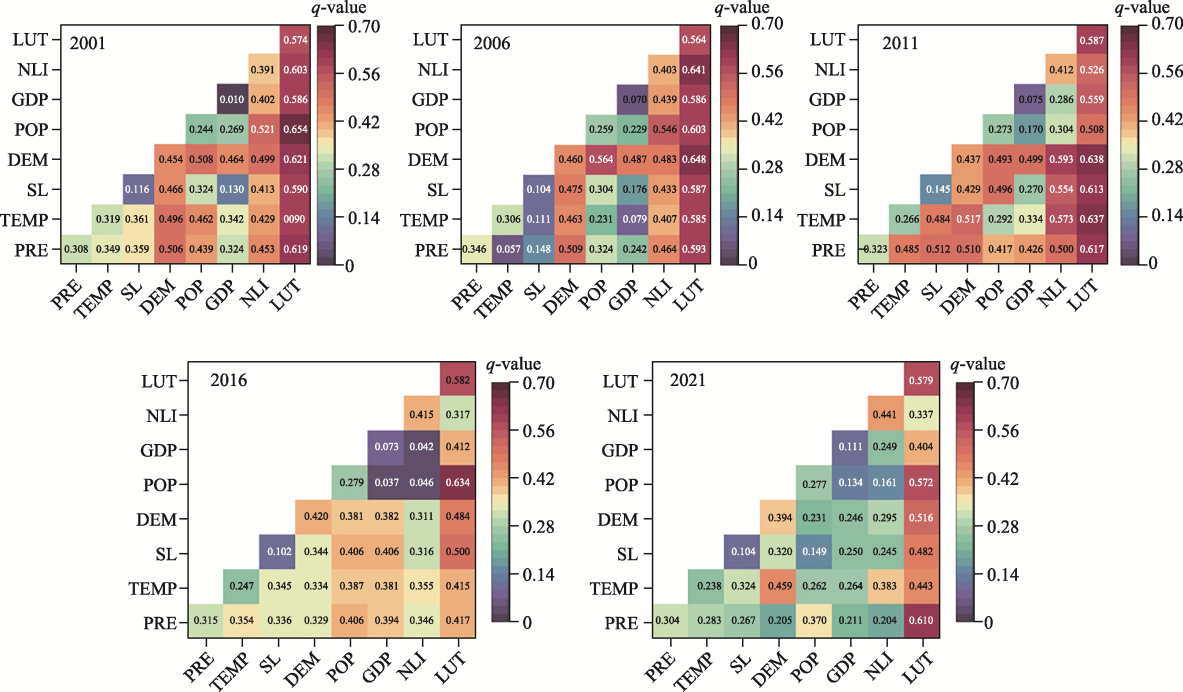
Figure 6
Results of interactive detection of ecological factors
Other figure/table from this article
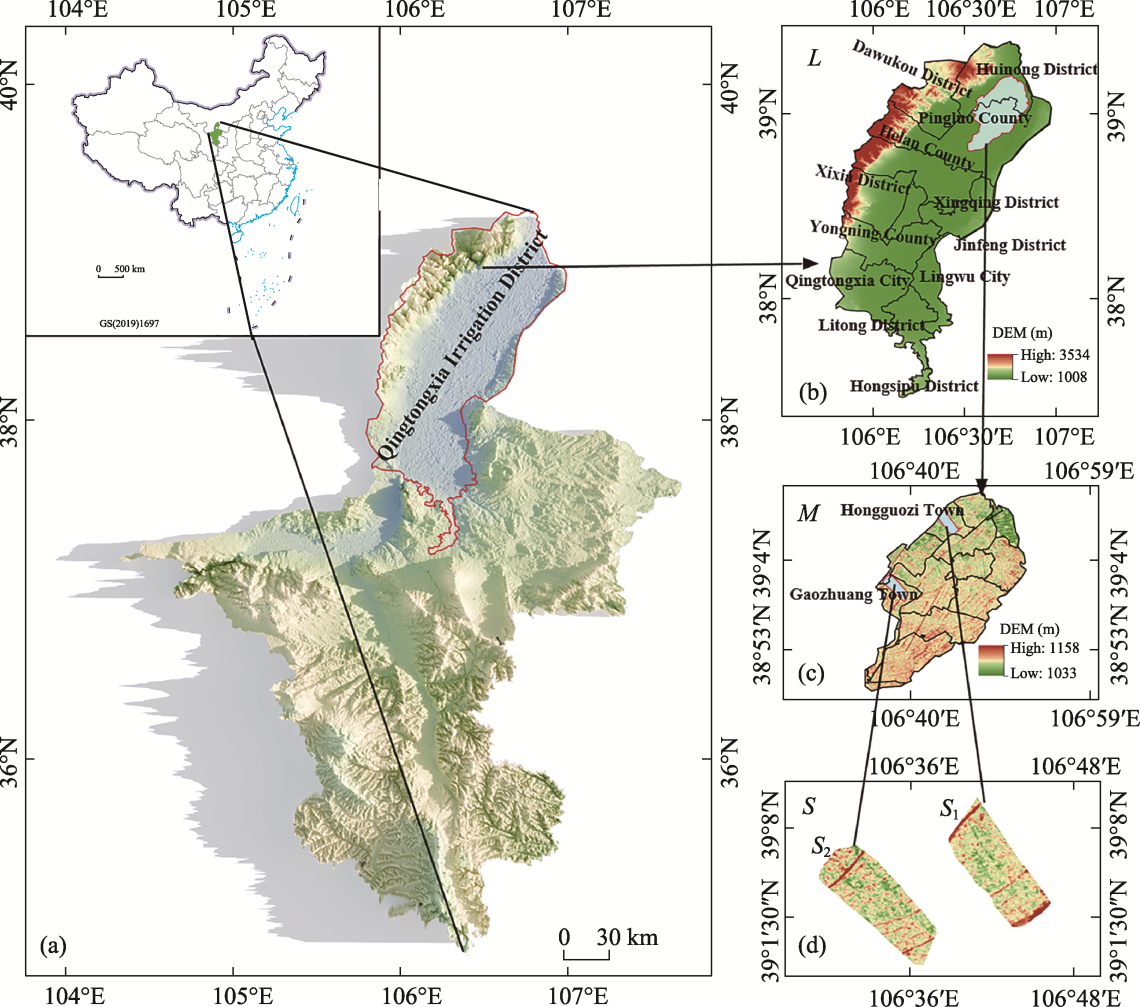
Figure 1
Location of Ningxia irrigation district (a: Ningxia; b: irrigation district; c: sub-irrigation district; d: landscape; L: large scale, which is irrigation district; M: medium scale, which is sub-irrigation district; S: small scale, which is landscape)
Table 1
Data main information and sources
Table 2
MRSEI calculation formula
Table 3
Results of factors interactions
Table 4
Load and contribution rate of the PC
l
in different years
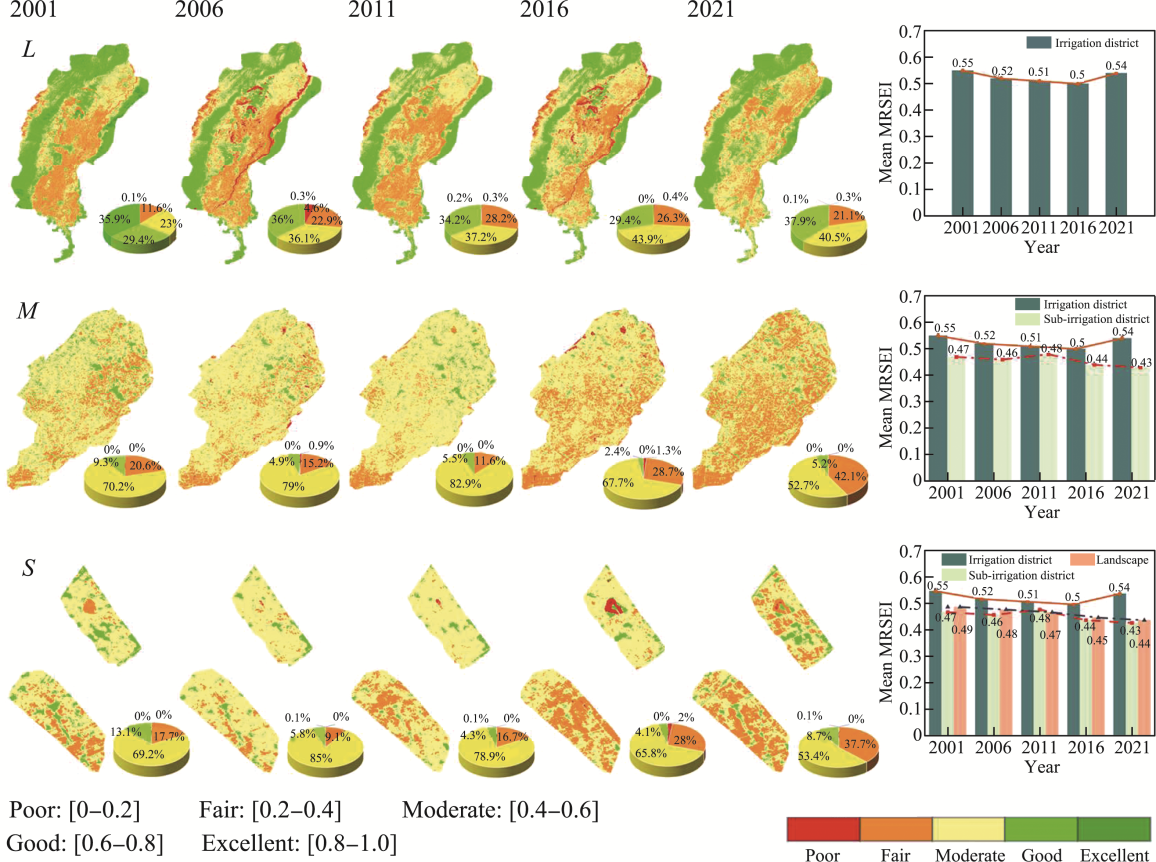
Figure 2
Classification of MRSEI index in Ningxia irrigation district of different scales (L, M and S are the same meaning in
Figure 1
.)
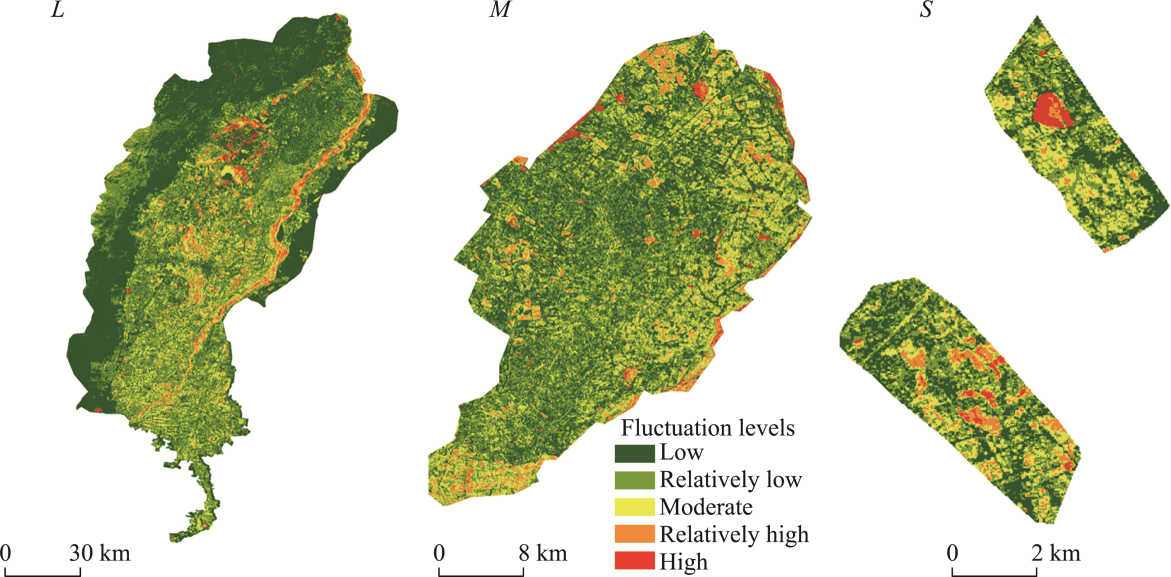
Figure 3
Variation and fluctuation levels of the MRSEI index across different spatial scales in Ningxia irrigation district (L, M and S are the same meaning in
Figure 2
.)
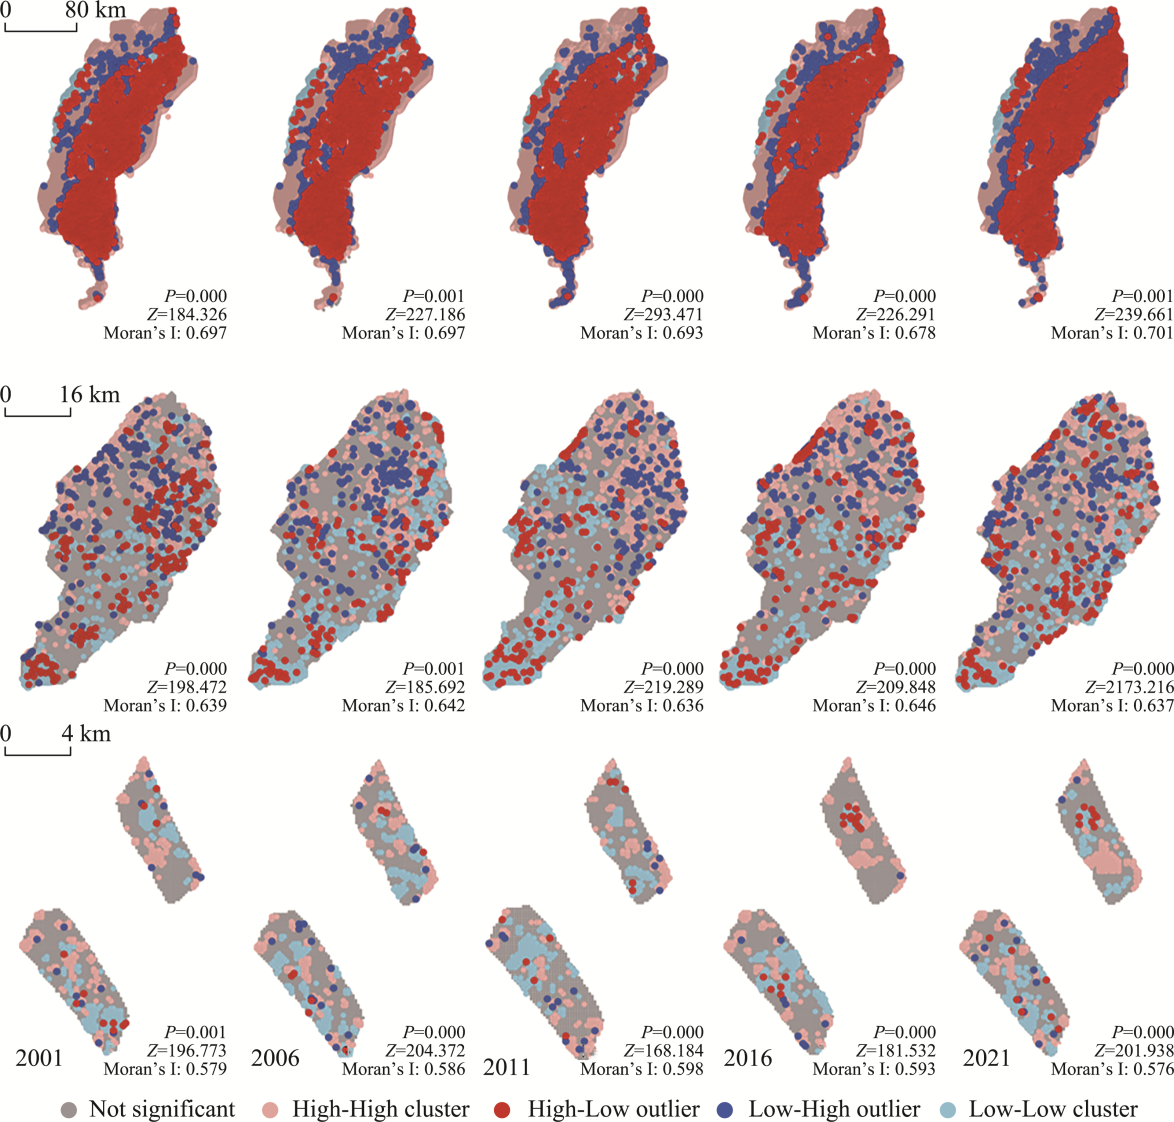
Figure 4
LISA clustering maps of MRSEI index in Ningxia irrigation district of different scales
Table 5
Theoretical models and their parameters for fitting semi-variance functions
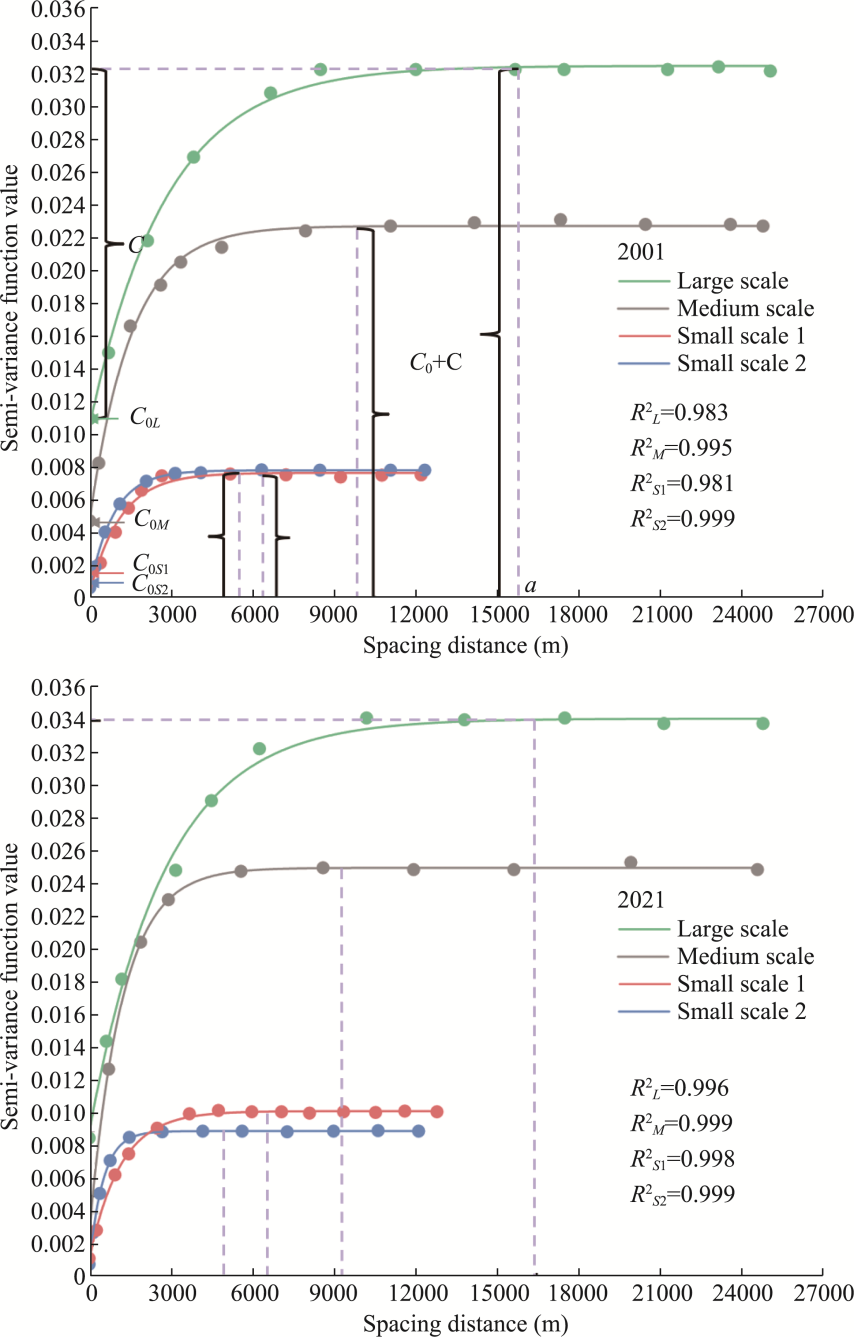
Figure 5
Optimal fitting curves for semi-variational functions at each scale (L, M and S are the same meaning in
Figure 3
)
Table 6
Irrigation district scale ecological factor singleton detection results
Table 7
Irrigation district scale ecological factor singleton detection results
Table 8
Sub-irrigation district scale ecological factor singleton detection results
Figure 7
Results of the interactive detection of irrigation district driving factors
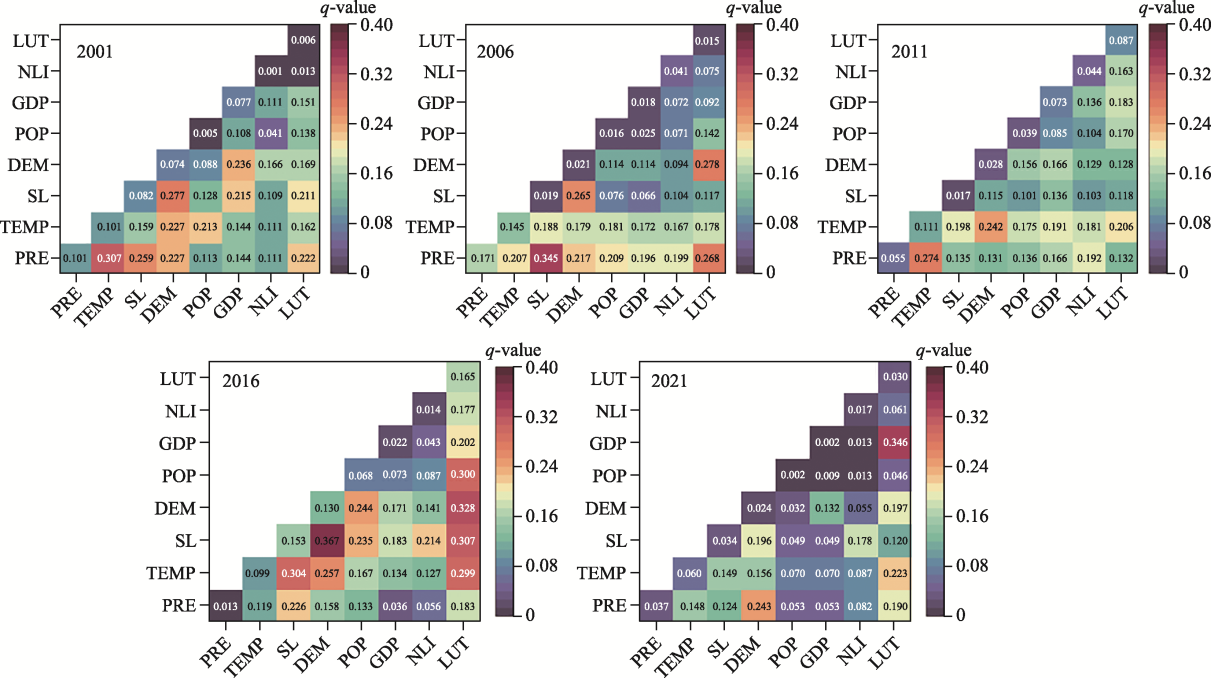
Figure 8
Results of the interactive detection of sub-irrigation district driving factors
Figure 9
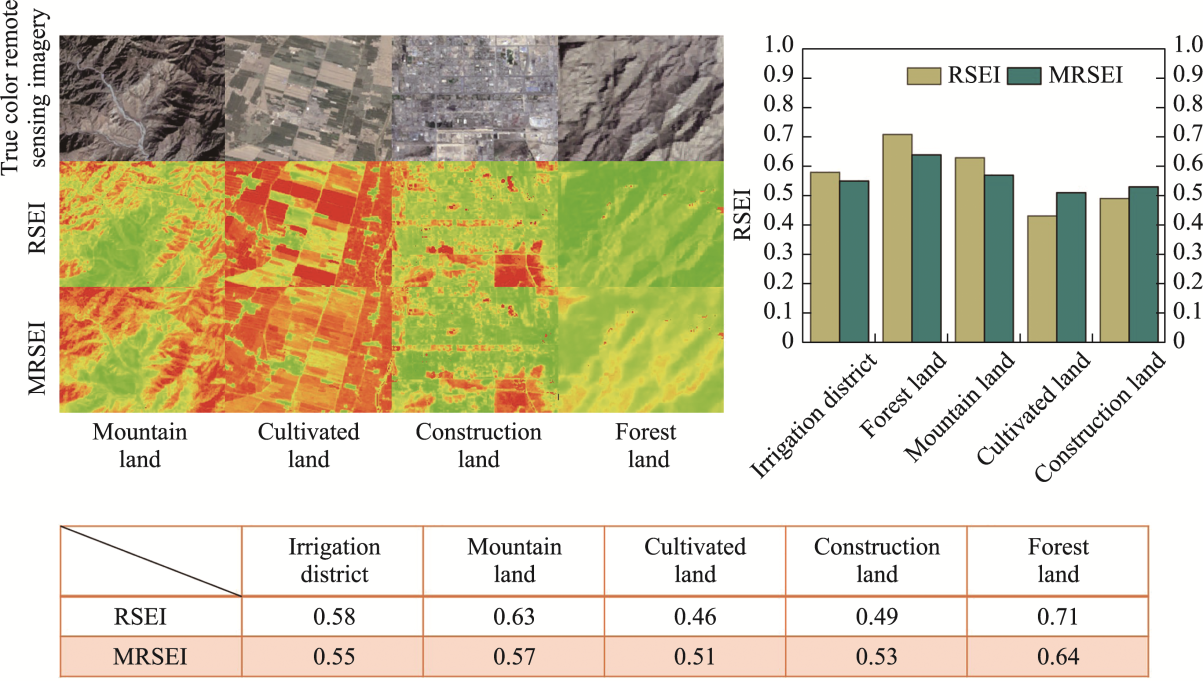
Local-scale detail comparison between MRSEI and RSEI
Figure 10
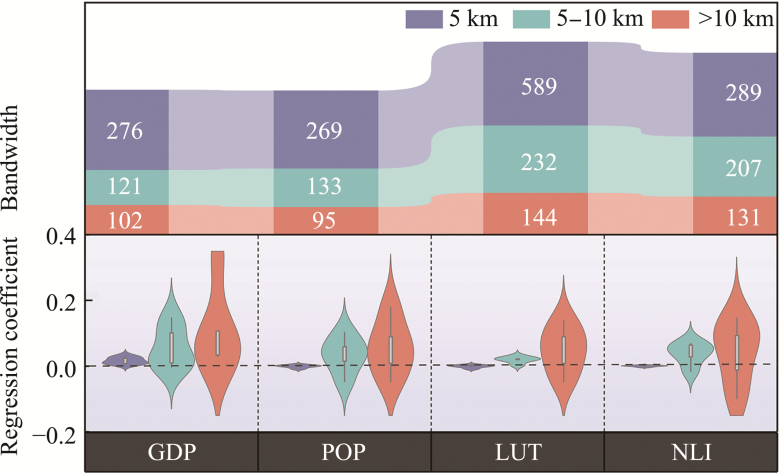
MGWR regression coefficients
Figure 11
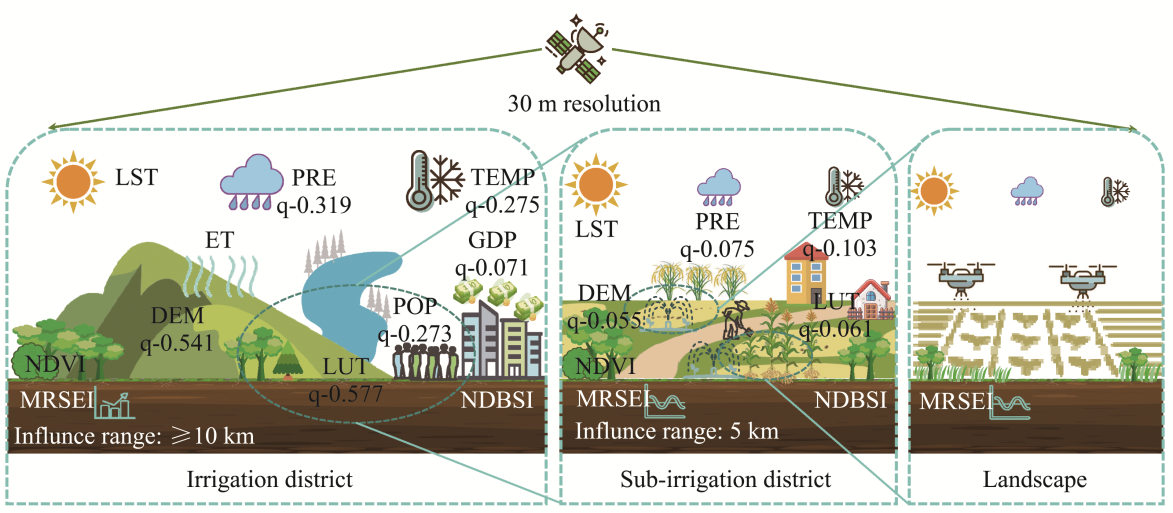
Diagram of driving process on ecological quality at different scales (L, M and S are the same meaning in
Figure 5
; NDVI: normalized difference vegetation index; ET: evapotranspiration; LST: land surface temperature; NDBSI: normalized difference built-up and soil index; PRE: precipitation; TEMP: temperature; LUT: land use type; GDP: gross domestic product; DEM: digital elevation model; POP: population)