Special Issue: Human-environment interactions and Ecosystems

Quantitative assessment of fire occurrence Dead Fuel Index threshold and spatio-temporal variation in different grassland types of China-Mongolia border area

  • CHAO Lumen , 1, 2 ,
  • BAO Yulong , 1, 3, * ,
  • ZHANG Jiquan 4, 5 ,
  • BAO Yuhai 1, 3 ,
  • MEI Li 1 ,
  • YUAN Zhihui 1
Expand
  • 1. College of Geographic Science, Inner Mongolia Normal University, Hohhot 010022, China
  • 2. College of Resources and Environment, Baotou Normal College, Science and Technology University of Inner Mongolia, Baotou 014030, Inner Mongolia, China
  • 3. Inner Mongolia Key Laboratory of Remote Sensing and Geographic Information Systems, Inner Mongolia Normal University, Hohhot 010022, China
  • 4. School of Environment, Northeast Normal University, Changchun 130024, China
  • 5. Key Laboratory for Vegetation Ecology, Ministry of Education, Changchun 130024, China
* Bao Yulong (1982-), Associate Professor, E-mail:

Chao Lumen (1990-), PhD Candidate, E-mail:

Received date: 2022-06-13

  Accepted date: 2023-03-22

  Online published: 2023-08-29

Supported by

The International (Regional) Cooperation and Exchange Programs of National Natural Science Foundation of China(41961144019)

The International (Regional) Cooperation and Exchange Programs of National Natural Science Foundation of China(4191101037)

The Inner Mongolia Natural Science Foundation(2021MS04016)

Abstract

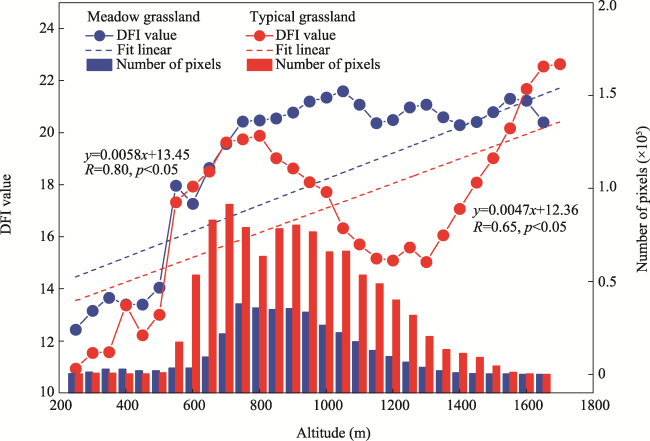
Climate change is manifesting rapidly in the form of fires, droughts, floods, resource scarcity, and species loss, and remains a global risk. Owing to the disaster risk management, there is a need to determine the Dead Fuel Index (DFI) threshold of the fire occurrence area and analyze the spatio-temporal variation of DFI to apply prevention measures efficiently and facilitate sustainable fire risk management. This study used the MODIS Burned Area Monthly L3 (MCD64A1), Landsat Global Burned Area (BA) products, and MODIS Surface Reflectance 8-Day L3 (MOD09A1) data from 2001 to 2020 to calculate the values of the DFI in the study area before the occurrence of fire. The results showed that: (1) The inversion of the meadow steppe DFI values in the fire area was distributed in the range of 14-26, and the fire rate was the highest in the range of 20-22. The inversion of the typical steppe DFI values in the fire area was distributed in the range of 12-26, and the fire rate was the highest in the range of 16-22. (2) Areas with high fire DFI values included Khalkhgol, Matad, Erdenetsagaan, Bayandun, Gurvanzagal, Dashbalbar in Mongolia, and scattered areas of the Greater Khingan Mountains (forest edge meadow steppe area), East and West Ujumqin Banner, and Xin Barag Right Banner. The highest fire probability of fire occurred during October and April. (3) The DFI values were sensitive to changes in altitude. The results of this study may provide useful information on surface energy balance, grassland carbon storage, soil moisture, grassland health, land desertification, and grazing in the study area, especially for fire risk management.

Cite this article

CHAO Lumen , BAO Yulong , ZHANG Jiquan , BAO Yuhai , MEI Li , YUAN Zhihui . Quantitative assessment of fire occurrence Dead Fuel Index threshold and spatio-temporal variation in different grassland types of China-Mongolia border area[J]. Journal of Geographical Sciences, 2023 , 33(8) : 1631 -1659 . DOI: 10.1007/s11442-023-2146-2

1 Introduction

Climate change is manifesting rapidly in the form of droughts, fires, floods, resource scarcity, and species loss, and remains a global risk (Zahidi, 2022). Without proper disaster risk management, the number of poor people worldwide will increase by 100 million in 2040. In particular, fires have a significant impact on the production and function of terrestrial ecosystems, carbon storage (Balshi et al., 2007; Dai et al., 2016; Yu, 2020), habitat and biodiversity (He et al., 2019), vegetation replacement patterns (Wang et al., 2015), and nutrient cycling. Fires also greatly influence local society, and the economy, and can cause significant ecological losses in ecosystems (Reid et al., 2016). “Grassland fire” is the phenomenon of grassland burning, referring to the rapid combustion of grasslands that occurs at certain temperatures. Grassland fire risk is a quantitative analysis of grassland fire hazards, and the consequences of them becoming a reality. The risk of grassland fires is quantified based on four factors: the danger of grassland fires occurrence, risk of exposure to grassland fires, vulnerability to grassland fires, and the ability to prevent and mitigate disasters. Grassland fire hazards can be understood as the degree of fire risk in a certain area, or the possibility of fire (Zhang et al., 2006; 2007; Carlson and Burgan, 2010). The level of potential danger of grassland fires depends on the fire sources (human and lightning strikes), fuel characteristics, meteorological factors (wind speed, temperature, number of sunny days, dryness, humidity, and precipitation), and terrain (slope, aspect, and position) (Zhang et al., 2007; 2013). Grassland fuel is the material basis and a prerequisite for the occurrence and development of grassland fires. The spread of fire can only occur when there is fuel on the ground, weather conducive to fire, or a source of fire (Zhou and Zhang, 1996).
The main characteristics of fuels include fuel type, fuel biomass, fuel water content, fuel height, fuel continuity, and fuel coverage (Seyin, 2002; Bao et al., 2011; French et al., 2011; Bao, 2013). Fuels are roughly divided into live and dead. Dead fuels are those that appear light to dark brown or gray with no remaining green chlorophyll pigment and stalks that break easily. Many dead fuel (non-photosynthetic vegetation) areas have the highest fire risk (Roberts et al., 2015). However, in recent decades, the frequency of fires has increased as a result of increasing temperatures linked to climate change, the increasing frequency of human activities (Kirchmeier Young et al., 2019; Li et al., 2021), and the significant increase in the amount of withered grass (Bao et al., 2014; Hong, 2016; Tong et al., 2018). The Dead Fuel Index (DFI) is an estimate of Dead Fuel (DF) coverage or coverage of non-photosynthetic vegetation, such as withered grass (Cao et al., 2010). The more favorable the combustible DFI, the more likely it is that grassland fires will occur under favorable weather conditions. The DFI affects the fire risk and influences fire behaviors. Therefore, an accurate assessment of the DFI index is vital.
Dead Fuel Index is a good indicator to represent combustibles. In the past, NDVI was used to represent combustibles (Liu et al., 2012). However, Dead Fuel Index can better express the material basis required for fire occurrence and combustibles in spring and autumn, when fire occurrence probability is high. DFI represents dead combustibles and therefore does not include fresh grass and plants, which are represented by NDVI. Ignition sources of fire are random and not easy to predict. Moreover, a variety of weather conditions is conducive to the occurrence of fire, but fire cannot occur in the absence of combustibles. Therefore, the accurate expression of combustibles is crucial for fire warning, and the accurate calculation of combustibles can provide data to support the real-time monitoring of fire risk. The distribution map of burnt areas on the Mongolian Plateau indicates that there are significant differences between the two sides of the border between China and Mongolia (Li et al., 2018) and that combustibles are the basis for the occurrence and development of fires. At present, there is a lack of real-time monitoring of combustibles and reliable data support. In order to build fire warning capabilities, it is necessary to quantify combustibles, which requires basic data. Most existing research focuses on weather-related fire risk warnings; however, research on combustible-related fire risk warnings is scarce (Claudia et al., 2019; Miguel et al., 2020; Nikolaos et al., 2022). Accurate calculation of DFI is crucial for grassland fire warnings (Chai et al., 2020). DFI-related studies focus primarily on the spatial and temporal distribution of DFI and the inversion of NPV (Wang et al., 2020; Bai et al., 2021), with few studies attempting to elucidate a relationship between DFI and fires. This study attempts to fill the gap by evaluating the relationship between DFI and fire.
In recent decades, remote sensing technology has made significant progress in many aspects of geography (Abera et al., 2022). Multispectral and hyperspectral indices for calculating non-photosynthetic vegetation have been established using spectral reflectance, such as the Normalized Difference Index (NDI), Normalized Difference Tillage Index (NDTI), Normalized Difference Senescent Vegetation Index (NDSVI) (Qi et al., 2002), Simple Tillage Index (STI), Short Wave Infrared Red (SWIR32) (Guerschman et al., 2009), Modified Soil-Adjusted Crop Residue Index (MSACRI), Dead Fuel Index (DFI), and Normalized Difference Vegetation Index-Cellulose Absorption Index (NDVI-CAI). However, considering the limitations of hyperspectral data, multispectral indices have been proposed and widely used in various satellite platforms. Cao et al. (2010) used multispectral MODIS data to estimate withered grass using DFI, which was better than NDI, Crop Residue Index Multiband (CRIM), Soil Adjusted Corn Residue Index (SACRI), and CAI Index (Nagler et al., 2003), and is considered to be the best index for estimating withered grass (Guo et al., 2021).
The Earth’s surface consists of photosynthetic vegetation, non-photosynthetic vegetation, and bare soil. Several studies have been conducted on photosynthetic vegetation (Tucker, 2001; Jeong et al., 2011; John et al., 2013; Bao et al., 2014; Chen et al., 2014). The spectral characteristics of non-photosynthetic vegetation and bare soil are similar and difficult to distinguish. Therefore, non-photosynthetic vegetation has not been studied as extensively as photosynthetic vegetation. In recent years, research on non-photosynthetic vegetation in sparse arid grasslands has gradually increased (Yue et al., 2020; Guo et al., 2021). Researchers of non-photosynthetic vegetation mainly use near-infrared wavelengths of 841-876 nm and short-wave infrared wavelengths of 1100-2500 nm. The 2100 nm SWIR absorption band, which is the lignocellulose absorption band of dry litter, may be caused by cellulose, hemicellulose, lignin, and/or other structural compounds (Elvidge, 2007). Therefore, the CAI was proposed using the 2000-2050, 2080-2130, and 2190-2240 nm bands, based on the 2100 nm absorption band. The CAI can be used to retrieve DF. However, because of the frequent use of hyperspectral images, a large range of CAI areas cannot be retrieved. The narrow wavelength ranges of 2.1, 2.0 and 2.2 mm in the CAI calculation are not available for multi-band satellite sensors, such as the MODIS and Landsat (Ren et al., 2018). Pigments (chlorophyll a, chlorophyll b, carotene, and lutein) in green vegetation near the 660 nm band, between 620 and 670 nm, have strong absorption, and the spectrum in the short-wave infrared 1100-2500 nm region is important for estimating vegetation water content or fuel water content (Ceccato et al., 2002). In the SWIR region, the reflectivity of the Dead Fuel (DF) is generally higher than that of green vegetation, except for a peak at 1600 nm. The reflectivity of the DF in the visible and near-infrared bands increases monotonically, parallel to and higher than that in the soil (Aase and Tanaka, 1991). In the 650-850 nm band, changes in DF and soil reflectance were more stable than those in photosynthetic vegetation (PV). In MODIS bands 6 and 7, the high and low orders of PV, DF, and soil were reversed, and the slope of DF was between those of PV and soil. In the samples (PV, DF, and soil), the spectral changes in bands 6 and 7 were almost synchronous and proportional (Cao et al., 2010). Therefore, DFI was calculated using 1 (visible: 620-670 nm), 2 (NIR: 841-876 nm), 6 (SWIR: 1628-1652 nm), and 7 (SWIR: 2105-2155 nm) band data. MODIS is better used in regional studies with long and relatively large time scales (Guerschman et al., 2009). Spectral unmixing of vegetation is better suited to arid regions greater, but less so in the arid and semi-arid Mongolian Plateau.
From 1994 to 1997, Mongolian cross-border witnessed over 20 grassland fires in China. In the last two decades, the frequency and scale of fires have increased globally (Li et al., 2018). Mongolia is sparsely populated, with weak firefighting capabilities, less precipitation in spring and autumn, dry weather, and frequent wind. The spatial distribution of the burned areas in the China-Mongolia border area from 2000 to 2014 showed that the total burned area of the Mongolian Plateau area was 8. 09 × 103 km2, 95% of which falls in Mongolia (7.68 × 10³ km2). The burned area in China amounted to 4.09 × 10² km2, or 5% of the total burned area (Li et al., 2016). On May 21, 2009, large areas of forest resource were lost in the spread of the fire (Yang and Dong, 2020). On April 7, 2012, strong winds affected high voltage lines, forming a short circuit. The East Ujumqin Mandubaolige town’s Erenbaolige, Taosennuoer, Aershanbaoli, Erengaobi and Mandubaolige Gacha in Xilingol league of Inner Mongolia autonomous region, including 120 households were affected, burned grassland area increased to 7.66 × 10⁴ ha. In recent years, one or two fires have occurred in the study area annually. Few studies have been conducted on non-photosynthetic vegetation in the grassland areas of the China-Mongolia border area. In the meadow steppe, because of good vegetation conditions and abundant fuel, species renewal and biomass increase occur rapidly after the fires, fuel accumulates again rapidly and causes another fire. Therefore, the burnt area and burning frequency are highest in the meadow steppe (Qu et al., 2010). Nevertheless, there are many studies on the real-time monitoring of grassland fires in the border areas of China and Mongolia (Li et al., 2018) and their spatio-temporal distributions (Bao et al., 2013; Li et al., 2017; Liu et al., 2017; Zhang et al., 2017). However, few studies have been conducted on DFI using MODIS images.
The objectives of this study were to: (1) determine the grassland types in the fire occurrence area of DFI threshold in the China-Mongolia border area and provide research basis for other regions, (2) analyze the spatio-temporal variation in DFI, and (3) provide parametric fuel index data for fire risk analysis. Work-related to the DFI in the China-Mongolia border area is part of the foundational research required for fire risk management. Moreover, it is important to study DFI well for fire risk management.

2 Materials and methods

2.1 Study area

The Mongolian Plateau (Inner Mongolia Autonomous Region of China and Mongolia) is a unique arid and semi-arid region, and various economic activities affect its ecosystem (Neupert, 1999; Feng et al., 2007; Liu et al., 2008; Zhang et al., 2009). The natural ecological environment is fragile and sensitive to global climate change (Bao et al., 2016). It is one of the largest grassland ecosystems worldwide, covering an area of 2.76 million square kilometers, with unique landscape and climate characteristics (Bao et al., 2021). Inner Mongolia accounts for 68% of the total of the China-Mongolia border, with a length of 3193 km (Li et al., 2018). The long-term changes in biomass in the Mongolian Plateau indicate great geographic differences, with non-significant changes in vegetation, which accounted for 35% in Inner Mongolia and 44% in Mongolia (Zhao et al., 2021). The Mongolian Plateau is located in the transition zone from the Gobi Desert in South Asia to the coniferous forests in northern Siberia (Hilker et al., 2014; Chen et al., 2018). It has a typical continental climate with hot summers and cold winters. Under the influence of climate differentiation, the vegetation showed obvious horizonal and vertical zonation. Most vegetation types in arid and semi-arid regions, such as forests, meadows, shrubs, typical desert steppes, Gobi vegetation, and grasslands, account for approximately 70% of the plateau (Bao et al., 2014). Fire protection is difficult in the border areas of China and Mongolia, and grasslands are widely distributed, Khalkgol, Matad, and Erdenetsagaan in Mongolia and East Ujumqin Banner in China have the highest frequency of grassland fires, and there are more fuels on the ground (Li et al., 2018). The study area of the boundary line of the 200 km buffer zone and elevation (a), land cover type (b), vegetation type (d), and the same-level administrative divisions in China’s banner (county) and Mongolia’s sumu (c) (Figure 1) are required in the border area between East Ujimqin Banner and Hulunbuir City in eastern Inner Mongolia, where fire rates are frequent. The study area happens to be the typical grassland and meadow grassland area with high vegetation biomass and vegetation coverage, the west is the desert grassland and where is with few fires (Qu et al., 2010). The fires in the region of the China-Mongolia border are often blown into Inner Mongolia (Li et al., 2016), the 200 km buffer zone border area on both sides of the border is chosen and the fact that most of the grassland on both sides of the border is covered, also are sheltered from agricultural and agro-pastoral ecotone. Mongolia has the lowest population density in the world at 2.2 people per square kilometer, and because of long-term nomadism, humans have less impact on the ecosystem (http://1212.mn/2021).
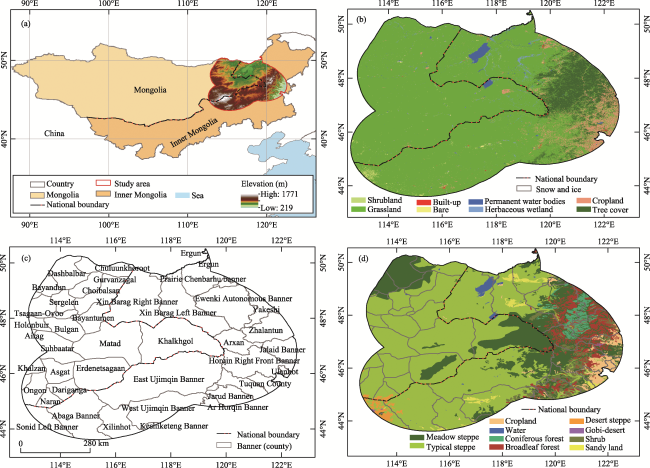
Figure 1 Location of the study area (China-Mongolia border area) and elevation (a); Land cover type (b); banner, county (c); grassland types of the study area (d)

2.2 Data

The MCD64A1 Burned Area Product is a monthly, Level-3 gridded 500 m product containing per-pixel burning and quality information, and tile-level metadata. Burn grid data show different parameters. Each 500-m grid cell has ordinal days of burn (1-366) (Table 1), with 0 = unburned land, -1 = unmapped due to insufficient data, and -2 = water (Louis, 2018), (https://ladsweb.modaps.eosdis.nasa.gov/search/) and an automated pipeline for generating 30 m resolution global-scale annual burned area maps utilizing Google Earth Engine was proposed the global 30 m spatial resolution Landsat Burned Area (BA) product (Long et al., 2019) (https://vapd.gitlab.io/post/gabam/) data from 2001 to 2020 were used; there were no fire track data in 2003 and 2011. The MCD64A1 is binary data classified by fire occurrence date and non-fire occurrence date, and Landsat burned area data is binary data classified by fire occurrence and non-fire occurrence. These data are used to determine and verify the statistics and occurrence of fire in the study area. MCD64A1 has a high usage rate and Landsat global Burned Area (BA) product has a high resolution. MOD09A1 provides MODIS band 1-7 surface reflectance at 500 m resolution. It is a level-3 composite of 500 m resolution MOD09GA. Each product pixel contains the best possible L2G observation during an 8-day period as selected on the basis of high observation coverage, low view angle, absence of clouds or cloud shadow, and aerosol loading (Table 2) (Vermote et al., 2015) (https:// ladsweb. modaps.eosdis.nasa. gov/search/) data from 2001 to 2020, including bands 1, 2, 6, and 7, were used to inverse the DFI. The DFI data were calculated using these bands.
Table 1 Day-of-year (DOY) of the first day of each calendar month
Month Non-leap year start DOY Leap year start DOY Month Non-leap year start DOY Leap year start DOY
January 1 1 July 182 183
February 32 32 August 213 214
March 60 61 September 244 245
April 91 92 October 274 275
May 121 122 November 305 306
June 152 153 December 335 336
Table 2 MOD09A1 band information
Bands Wavelength (nm) Resolution (m) Bands Wavelength (nm) Resolution (m)
Band1 620-670 500 Band5 1230-1250 500
Band2 841-876 500 Band6 1628-1652 500
Band3 459-479 500 Band7 2105-2155 500
Band4 545-565 500
The vegetation type map and vector map of the Mongolian Plateau were provided by the Key Laboratory of Remote Sensing and Geographic Information System of Inner Mongolia Autonomous Region. The 30 m DEM was obtained from https://appeears.Earthdatacloud.nasa.gov/. Livestock and population data were obtained from the Inner Mongolia Statistical Yearbook website (http://tj.nmg.gov.cn) for China and from http://1212.mn/ for Mongolia. In October 2021, WorldCover project team according to the European space agency (ESA) of Sentinel-1 and Sentinel-2 data of 2020 was released the first resolution of the global land cover map for 10 m, and we used it (https://worldcover2021.esa.int/). Temperature and precipitation data are available from http://www.nmic.cn/data/ and Mongolian Weather Bureaus.
The products of MCD64A1 and MOD09A1 were further processed using the MODIS reprojection tool (MRT Version 4.0) to convert the data format from HDF to GeoTIFF and projection from sinusoidal projection to WGS84/Albers projection, and to perform mosaicking, resampling, and clipping. The fire area vector is Visual interpretation from the MCD64A1 data. From 2001 to 2020, the burned area after the occurrence of fire was found every year on average, at least once per year, and at most three times per year in the China-Mongolia border area. Therefore, data on 33 fire-burned areas were collected at different dates and locations (Table 3 and Figure 2). Livestock and population data were statistically analyzed according to the banner (county) and sumu. The land cover type data was mosaicking and clipping. Vegetation type map and 30 m DEM were clipped from the study area. These data operations used the Python and MATLAB, and the Environmental Systems Research Institute (ESRI) software ArcGIS10.3 and ENVI5.2.
Table 3 Burned area information statistics
Year Area Date of fire Month DFI date Vegetation type
2001 East Ujimqin Banner 269 September 257 Meadow steppe
2001 Xin Barag Right Banner 256-259 September 249 Typical steppe
2002 Prairie Chenbarhu banner 132-133 May 129 Typical steppe
2004 Erdenetsagaan border 110-115 April 105 Typical steppe
2005 Khalkhgol border 284-288 October 281 Meadow steppe and broadleaf forest
2005 East Ujimqin Banner 289-290 October 281 Meadow steppe
2006 East Ujimqin Banner 267-268 September 265 Meadow steppe and typical steppe
2006 Ewenki Autonomous Banner 136-138 May 129 Meadow steppe
2006 Khalkhgol border 150 May 145 Meadow steppe and typical steppe
2007 Xin Barag Left Banner 121-127 May 113 Typical steppe
2007 Khalkhgol border 160-170 June 153 Meadow steppe
2008 Xin Barag Left Banner border 92-102 April 89 Typical steppe
2009 Prairie Chenbarhu Banner border 149-151 May 145 Meadow steppe and typical steppe
2009 Khalkhgol border 305-309 November 297 Meadow steppe and broadleaf forest
2010 Khalkhgol 247-248 September 241 Meadow steppe and typical steppe
2012 Khalkhgol 107-114 April 105 Meadow steppe and typical steppe
2013 Xin Barag Right Banner border 279-280 October 273 Typical steppe
2013 East Ujimqin Banner 271-273 September 265 Typical steppe
2013 Khalkhgol and Matad 133-136 May 129 Meadow steppe and typical steppe
2014 Khalkhgol and Matad 86-89 March 81 Typical steppe
2015 Khalkhgol 80-82 March 73 Meadow steppe
2015 Khalkhgol 83 March 81 Meadow steppe
2016 Khalkhgol border 188 July 185 Typical steppe
2016 Khalkhgol 112-113 April 105 Meadow steppe
2017 Ewenki Autonomous Banner 169-170 June 161 Typical steppe
2017 Choibalsan 176-181 June 169 Typical steppe
2017 Choibalsan 177-180 June 169 Typical steppe
2018 Xin Barag Left Banner border 123-129 May 121 Typical steppe
2019 Manzhouli border 110-113 April 105 Typical steppe
2019 Xin Barag Left Banner border 110-113 April 105 Typical steppe
2019 Khalkhgol border 271-276 October 265 Typical steppe
2020 Tsagaan-Ovoo 289-292 October 281 Typical steppe
2020 East Ujimqin Banner 265-267 September 257 Typical steppe
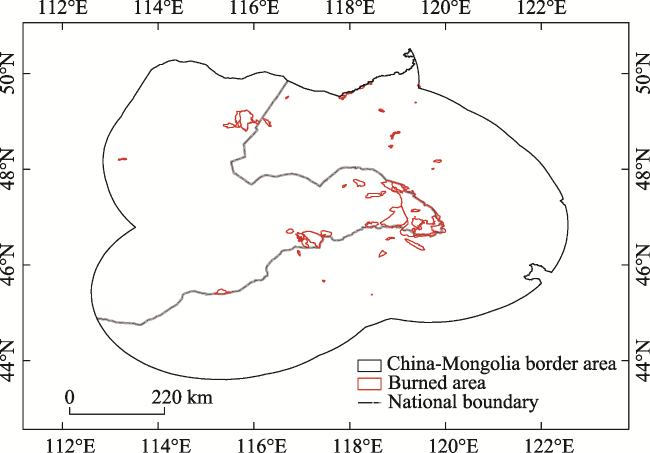
Figure 2 Burned area information of 2001-2020

2.3 Method

2.3.1 DFI

The DFI was summarized according to the MODIS band range and the spectral characteristics of PV, DF, and soil. The formula used is as follows:
$DFI=100\times \left( 1-\frac{~SWIR2}{~SWIR1} \right)\times \frac{Red}{NIR}$
where SWIR1, SWIR2, Red, and NIR represent bands 6, 7, 1, and 2 of the MODIS, respectively. The DFI has good potential for estimating DF coverage in grassland areas (Yue and Tian, 2020).

2.3.2 Accuracy verification

Landsat data were used the base data, and MODIS data as the predicted data. Binary classification data divided instances into positive (P) and negative (N) classes and subdivided them into true positive (TP), false positive (FP), true negative (TN), and false negative (FN) classes. Precision, accuracy, recall, F1, over prediction rate (OPR), unpredicted presence (UPR), Matthews correlation coefficient (MCC), sensitivity, and specificity were selected to verify data accuracy (Rong et al., 2020). The binary classification data were verified using precision, recall (sensitivity), specificity, accuracy, and AUC for comprehensive verification. The higher the precision value, the better the discriminative ability of the positive sample. The F1 value was more sensitive to negative samples; therefore, the validation for the non-fire areas was better. The accuracy value is the result of the validation of the entire sample. The AUC value can be used as an objective area to indicate the proportion of accurate classification, and the closer the value is to 1, the higher the recognition degree.
Accuracy, also known as the correct rate, is the proportion of the total number of correct classifications.
$~Precision=\frac{TP}{TP+FP}$
$~Accuracy=\frac{TP+TN}{TP+TN+FP+FN}$
Recall rate is the ratio of TP examples to all positive examples or sensitivity.
$~Recall=\frac{TP}{TP+FN}$
The receiver operating characteristic (ROC) curve is a commonly used method to evaluate landslide prediction models. It is plotted based on “Sensitivity” and “1—Specificity.” The sensitivity and specificity were calculated as follows:
$~Sensitivity=\frac{TP}{TP+FN}$
$~Specificity=\frac{TN}{TN+FP}$
The validation can be determined by calculating the area under the curve (AUC) (Luis et al., 2011). The threshold for AUC values is 0.5-1; the closer it is to 1, the more accurate the model.

2.3.3 Mann-Kendall test

The Mann-Kendall statistical test (MK) is a non-distribution (also known as non-parametric statistical) test (Douglas et al., 2000; Partal and Kahya, 2006), in which the dataset does not need to be in a particular order and is not affected by outliers. The MK test of the time series was computed using Equations 7-10:
$S=\underset{i=1}{\overset{n-1}{\mathop{\mathop{\sum }^{}}}}\,\underset{j=i+1}{\overset{n}{\mathop{\mathop{\sum }^{}}}}\, \text{sgn} ({{x}_{j}}-{{x}_{i}})$
$\text{sgn} (\theta )=\left\{ \begin{matrix} 1, & \theta >0 \\ 0, & \theta =0 \\ -1, & \theta <0 \\ \end{matrix} \right\}$
$Var(S)=\frac{n(n-1)(2n+5)-\underset{i=1}{\overset{n}{\mathop{\mathop{\sum }^{}}}}\,{{t}_{i}}(i-1)(2i+5)}{18}$
where xi and xj are the time-series data values at times i and j, respectively; n is the length of the time series; and t is the number of ties for the value. In cases where the sample size is n>10, the standard normal variable Zc is computed using Equation 10:
${{Z}_{c}}=\left\{ \begin{matrix} \frac{s-1}{\sqrt{Var(S)}}, & S>0 \\ 0, & S=0 \\ \frac{s+1}{\sqrt{Var(S)}}, & S<0 \\ \end{matrix} \right\}$
Positive values of Zc indicate increasing trends, whereas negative values of Zc indicate decreasing trends.

3 Result

3.1 Fire statistics and validation

The MCD64A1 fire site data were used to determine the date of occurrence and area, the DFI value of the date before the fire occurrence was calculated based on the study area range.
To verify and determine the fire occurrence along the China-Mongolia border from 2001 to 2020 (no data in 2003 and 2011), the MCD64A1 fire data were used to verify the Landsat global burned area (BA) data. The precision, recall (sensitivity), specificity, accuracy, and AUC values of 74,632 sample points in 33 study areas were all high (Table 4 and Figure 3), reaching the accuracies required for data verification and proving that the image of fire areas obtained represented a realistic fire zone.
Table 4 The MCD64A1 burned area validation with Landsat burned area results
Year Date Test dataset Validation method Result Year Date Test dataset Validation method Result
2001 256-259 TP Precision 0.95 2007 121-127 TP Precision 0.71
TN Recall 0.95 TN Recall 0.75
FP Specially 0.97 FP Specially 0.88
FN Accuracy 0.96 FN Accuracy 0.85
AOC 0.96 AOC 0.82
2001 269 TP Precision 0.77 2007 160-170 TP Precision 0.83
TN Recall 0.47 TN Recall 0.87
FP Specially 0.83 FP Specially 0.85
FN Accuracy 0.64 FN Accuracy 0.86
AOC 0.65 AOC 0.86
2002 132-133 TP Precision 0.78 2008 92-102 TP Precision 0.91
TN Recall 0.79 TN Recall 0.91
FP Specially 0.74 FP Specially 0.87
FN Accuracy 0.77 FN Accuracy 0.89
AOC 0.77 AOC 0.89
2004 110-115 TP Precision 0.80 2009 149-151 TP Precision 0.80
TN Recall 0.95 TN Recall 0.88
FP Specially 0.87 FP Specially 0.83
FN Accuracy 0.90 FN Accuracy 0.85
AOC 0.91 AOC 0.85
2005 284-288 TP Precision 0.93 2009 305-309 TP Precision 0.87
TN Recall 0.99 TN Recall 0.95
FP Specially 0.95 FP Specially 0.93
FN Accuracy 0.97 FN Accuracy 0.94
AOC 0.97 AOC 0.94
2005 289-290 TP Precision 0.90 2010 247-248 TP Precision 0.80
TN Recall 0.98 TN Recall 0.82
FP Specially 0.97 FP Specially 0.76
FN Accuracy 0.97 FN Accuracy 0.79
AOC 0.97 AOC 0.79
2006 136-138 TP Precision 0.88 2012 107-114 TP Precision 0.73
TN Recall 0.93 TN Recall 0.75
FP Specially 0.83 FP Specially 0.82
FN Accuracy 0.89 FN Accuracy 0.79
AOC 0.88 AOC 0.78
2006 150 TP Precision 0.71 2013 133-136 TP Precision 0.78
TN Recall 0.65 TN Recall 0.79
FP Specially 0.78 FP Specially 0.86
FN Accuracy 0.72 FN Accuracy 0.83
AOC 0.71 AOC 0.86
2006 267-268 TP Precision 0.93 2013 271-273 TP Precision 0.90
TN Recall 0.85 TN Recall 0.80
FP Specially 0.96 FP Specially 0.99
FN Accuracy 0.92 FN Accuracy 0.95
AOC 0.90 AOC 0.96
2013 279-280 TP Precision 0.89 2017 177-180 TP Precision 0.74
TN Recall 0.96 TN Recall 0.75
FP Specially 0.95 FP Specially 0.87
FN Accuracy 0.95 FN Accuracy 0.83
AOC 0.95 AOC 0.81
2014 86-89 TP Precision 0.77 2018 123-129 TP Precision 0.73
TN Recall 0.94 TN Recall 0.77
FP Specially 0.83 FP Specially 0.77
FN Accuracy 0.82 FN Accuracy 0.77
AOC 0.81 AOC 0.77
2015 80-82 TP Precision 0.94 2019 110-113 Manzhouli TP Precision 0.85
TN Recall 0.96 TN Recall 0.87
FP Specially 0.94 FP Specially 0.92
FN Accuracy 0.94 FN Accuracy 0.91
AOC 0.94 AOC 0.90
2015 83 TP Precision 0.86 2019 110-113 East Chenbaerhu TP Precision 0.94
TN Recall 0.96 TN Recall 0.94
FP Specially 0.88 FP Specially 0.94
FN Accuracy 0.92 FN Accuracy 0.94
AOC 0.92 AOC 0.94
2016 188 TP Precision 0.77 2019 271-276 TP Precision 0.93
TN Recall 0.85 TN Recall 0.83
FP Specially 0.73 FP Specially 0.72
FN Accuracy 0.76 FN Accuracy 0.79
AOC 0.76 AOC 0.78
2016 112-113 TP Precision 0.94 2020 289-292 TP Precision 1.00
TN Recall 0.94 TN Recall 1.00
FP Specially 0.92 FP Specially 1.00
FN Accuracy 0.88 FN Accuracy 1.00
AOC 0.88 AOC 1.00
2017 169-170 TP Precision 0.77 2020 265-267 TP Precision 0.93
TN Recall 0.94 TN Recall 0.96
FP Specially 0.91 FP Specially 0.95
FN Accuracy 0.92 FN Accuracy 0.95
AOC 0.92 AOC 0.96
2017 176-181 TP Precision 0.79
TN Recall 0.79
FP Specially 0.74
FN Accuracy 0.77
AOC 0.77
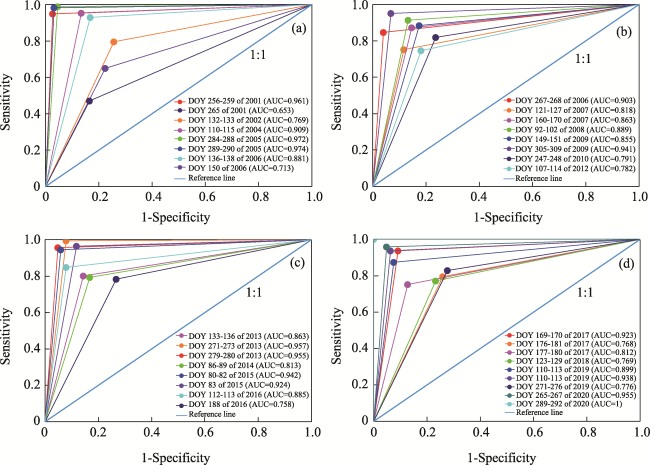
Figure 3 ROC curve of the sampling area

3.2 Determination of DFI thresholds for fire occurrence areas

The MOD09A1 data before the occurrence of fire in the China-Mongolia border area from 2001 to 2020 were selected to invert the DFI values. The average and standard deviation of the DFI histogram in each fire occurrence area were calculated. Grassland fires occurred on the meadow and typical steppes. The meadow steppe DFI minimum value for the fire occurrence area was 13.97, with a maximum value of 25.89, and a 95% confidence level obtained from 59979 sample points in 33 sample areas over 20 years. The lower limit of the meadow steppe DFI was 15.59, with an upper limit of 24.88, and a mean of 20.40. Therefore, it can be concluded that the DFI values of the fire occurrence area were distributed between 14 and 26. The DFI values were classified into the following grades: 14-16, 16-18, 18-20, 20-22, 22-24, and 24-26. The distribution of fire occurrence probability from highest to lowest was as follows: 20-22, 22-24, 18-20, 16-18, 14-16, and 24-26. These probabilities, given as percentages, were 31.0%, 21.5%, 17.5%, 13.1%, 6.2%, and 5.7%, respectively (Figure 4a).
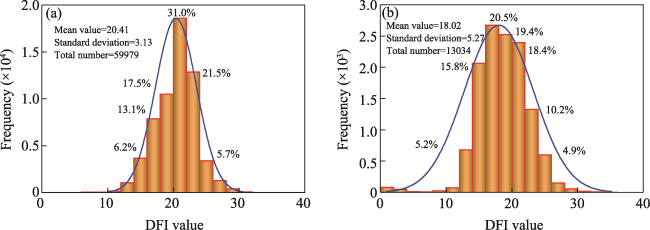
Figure 4 Histogram of DFI values distribution in fire occurrence area (a. meadow steppe; b. typical steppe)
The typical steppe DFI minimum value of the fire occurrence area was 11.93, with a maximum value of 25.89. The data had a 95% confidence level obtained from 13034 sample points in 33 sample areas over 20 years. The data had a lower limit of 12.23, an upper limit of 24.16, and a mean of 18.03. Therefore, the DFI value of the fire occurrence area was distributed between 12 and 26. The classification grades of the typical steppe DFI values were 12-14,14-16, 16-18, 18-20, 20-22, 22-24, and 24-26. The distribution of fire occurrence probability from highest to lowest was as follows: 16-18, 18-20, 20-22, 14-16, 22-24, 12-14, and 24-26. These probabilities as percentages were 20.5%, 19.4%, 18.4%, 15.8%, 10.2%, 5.2%, and 4.9%, respectively (Figure 4b).

3.3 DFI value distribution characteristics

3.3.1 Spatial variation features

Among the 6 grades of the meadow steppe DFI distribution, the 20-22 grade (which represented approximately 15,112.16 km2) had the highest probability of fire occurrence and was mainly distributed in Khalkhgol, Erdenetsagaan, Bayandun, Gurvanzagal, Dashbalbar in Mongolia and scattered in the Greater Khingan Mountains (forest edge meadow steppe area). The 22-24 and 24-26 (approximately 18,342.48 km2 and 13,333.11 km2, respectively) were similar in distribution in Khalkhgol, the border area of Arxan in China, the northeast and southeast of East Ujumqin Banner, the sporadic part of West Ujimqin Banner, and Xin Barag Left Banner. Other grades of DFI, 14-16 (approximately 1033.47 km2), 16-18 (approximately 4330.90 km2), and 18-20 (approximately 8498.66 km2) were all spread around the grades of 20-22. In addition, Arxan, Horqin Right Front Banner, Jarud Banner, Horqin Right Middle Banner, Jalaid Banner, Zhalantun, and West Ujimqin Banner (Figure 5).
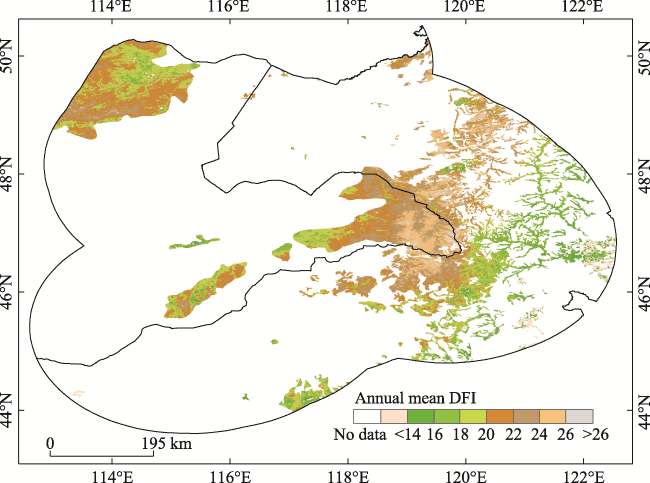
Figure 5 Spatial distributions of annual mean DFI for the meadow steppe of the China-Mongolia border area between 2001 and 2020
Among the 7 grades of the typical steppe DFI distribution, the 16-18 grade (covering approximately 22,622.15 km2) had the highest probability of fire occurrence and was mainly distributed in Matad, Khalkhgol, Erdenetsagaan, Suhbaatar, Asgant, Dariganga, Khalzan, and Bulgan in Mongolia and scattered in Manzhouli, Xin Barag Right Banner, Xin Barag Left Banner, East Ujumqin Banner, West Ujimqin Banner, southern Xilinhot, and northern Abaga Banner. The 18-20 and 20-22 grades (approximately 39,376.58 km2 and 55,707.22 km2, respectively) were similar in distribution in comparison to the 16-18 grade, and were distributed in Holonbuir, Tsagaan-Ovoo, Bayantumen, Sergelen, Choibalsan, Gurvanzagal and Chuluunkhoroot in Mongolia, East Ujumqin Banner, West Ujimqin Banner, Xin Barag Right Banner, Xin Barag Left Banner, Prairie Chenbarhu Banner, and Ewenki Autonomous Banner in China Inner Mongolia. Other grades of DFI, 14-16 and 12-14 (approximately 22,191.70 km2 and 3330.00 km2, respectively), were mainly distributed in Naran, Ongon, Abaga Banner, Xilinhot and Western East Ujumqin Banner, Southwest Xin Barag Right Banner. The 22-24 and 24-26 (approximately 39,160.50 km2 and 16,147.56 km2, respectively) were spread in the Prairie Chenbarhu Banner, and Ewenki Autonomous Banner (Figure 6).
Figure 6 Spatial distributions of annual mean DFI for the typical steppe of the China-Mongolia border area between 2001 and 2020
The meadow steppe DFI group with the highest fire probability (20-22) mainly occurred in April and October. The largest area that this group of DFI values were distributed in, occurred in October, (covering approximately 20-22, 19,606.19 km2) (Table 5) in Khalkhgol, Erdenetsagaan, Bayandun, Gurvanzagal, Dashbalbar in Mongolia and scattered in the Greater Khingan Mountains (forest edge meadow steppe area). After April, however, the DFI value group 20-22 was mainly distributed in the forest margin meadow steppe area of the Greater Khingan Mountains, Khalkhgol in Mongolia on both sides of the China-Mongolia border, northeastern Ujumqin in East China, the Khingan Arxan, and Bayandun and Dashbalbar in Mongolia. The high DFI values (20-22) in March (covering approximately 3230.54 km2) were mainly distributed in the east of the Greater Khingan Mountains, scattered in Xilinhot, and in Dashbalbar, Mongolia. The distribution of DFI values in group 20-22 in May and September (covering approximately 326.48 km2 and 18.22 km2, respectively) were similar to, but slightly lower than, the value distribution in April. The higher value distribution in November (group 20-22, approximately 3424.12 km2) was the result of an adjustment to snow. In June, the DFI value group 20-22, was distributed, covering approximately 11.58 km2 (Table 5 and Figure 7).
Table 5 The meadow steppe area of each grade in each month (per km2)
Month
Area
Level
March April May June September October November
(14, 16) 1095.64 11767.36 26000.39 11669.39 36650.02 4085.66 172.35
(16, 18) 1377.54 19295.78 16757.01 338.70 1053.62 12208.74 561.43
(18, 20) 1932.75 15686.02 3281.13 24.87 40.30 23546.51 1594.91
(20, 22) 3230.54 8809.07 326.48 11.58 18.22 19606.19 3424.12
(22, 24) 4604.22 4539.69 65.38 8.15 9.86 8929.97 3300.85
(24, 26) 5083.33 1568.97 7.29 4.07 7.07 1275.50 2917.13
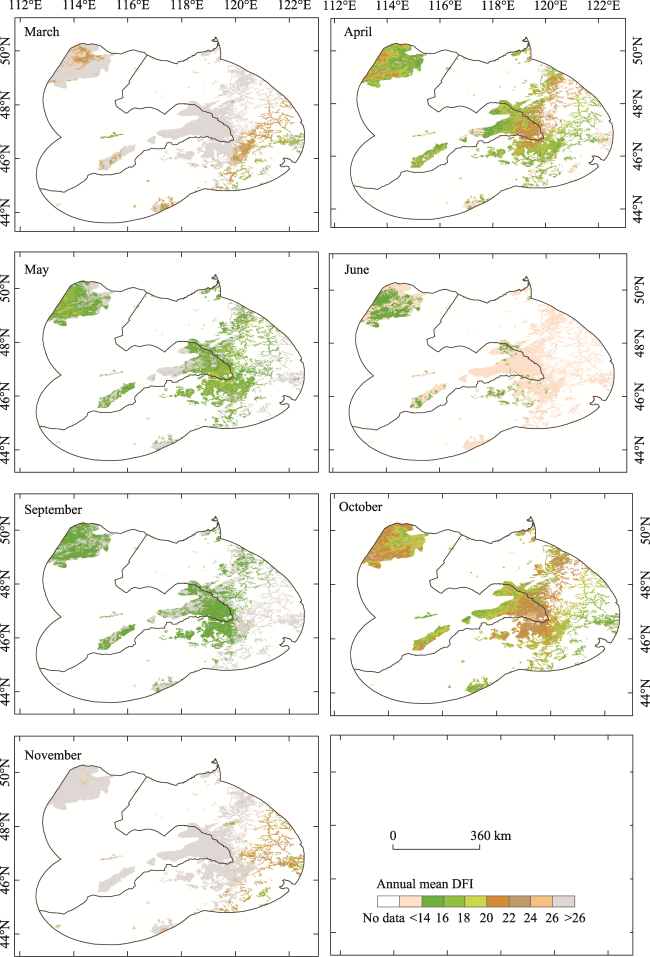
Figure 7 Spatial distributions of meadow steppe monthly mean DFI during the fire prevention period in the China-Mongolia border area between 2001 and 2020
The typical steppe DFI groups with the highest fire probability (16-18), (18-20), (20-22) were mainly distributed throughout October. The largest area that each of these three DFI groups were occurred in September (group 16-18, approximately 62,280.20 km2) and October (group 18-20, approximately 53,837.06 km2 and group 20-22, approximately 19,267.70 km2) (Table 6). These distributions largely in the typical steppe, except the Ongon, Naran, Bayandelger and little of Matad in Mongolia, and Abaga Banner, Xilinhot, West of East Ujumqin Banner, Northwest West Ujimqin Banner, Southwest Xin Barag Right Banner, West of Xin Barag Left Banner, scattered in the typical steppe area. In April the 16-18, 18-20, and 20-22 DFI groups covered approximately 34,989.52 km2, 14,609.68 km2, and 20-22, 3237.19 km2, respectively. These DFI groups were mainly distributed in the Tsagaan-Ovoo, Holonbuir, Bayantumen, Sergelen, Choibalsan, Gurvanzagal, Chuluunkhoroot, Matad and Erdenetsagaan in Mongolia, Middle Northeast Ujumqin Banner, Southeast West Ujumqin Banner, Northwest Xin Barag Right Banner, Prairie Chenbarhu Banner, and Ewenki Autonomous Banner in Inner Mongolia. The high DFI value groups in March, covering approximately 12,161.37 km2, 10,899.16 km2 and 10,983.41 km2, respectively, were mainly distributed in the middle of Matad, Northern Erdenetsagaan, Naran, Ongon and Asgat in Mongolia, Middle of Abaga Banner and scattered in East Ujumqin Banner and West Ujumqin Banner. The DFI groups 16-18, 18-20, and 20-22 covered 12,417.97 km2, 1794.27 km2, and 466.47 km2) in May, and approximately 1794.27 km2, 284.04 km2, and 97.97 km2 in September, respectively. These groups were distributed in the middle of Matad, Tsagaan-Ovoo, and Choibalsan in Mongolia, scattered in East Ujumqin Banner and West Ujumqin Banner. The higher values in November 2831.81 km2, 8052.56 km2, and 11,030.14 km2, respectively, were mainly observed in Naran, Ongon in Mongolia, Abaga Banner, Xilinhot and West of East Ujumqin Banner. In June, these groups had the smallest coverage, with approximately 1875.94 km2, 160.56 km2, and 60.88 km2, respectively (Table 6 and Figure 8).
Table 6 The typical steppe area of each grade in each month (per km2)
Month
Area
Level
March April May June September October November
(12, 14) 10295.07 44575.89 66123.62 93450.52 116313.19 23861.41 113.19
(14, 16) 12305.64 49211.83 45419.00 29100.59 60913.38 38803.79 584.80
(16, 18) 12161.37 34989.52 12417.97 1875.94 1794.27 62280.20 2831.81
(18, 20) 10899.16 14609.68 1784.41 160.56 284.04 53837.06 8052.56
(20, 22) 10983.41 3237.19 466.47 60.88 97.97 19267.70 11030.14
(22, 24) 12779.18 750.72 220.37 36.66 52.95 3275.34 14193.80
(24, 26) 16259.03 289.18 68.81 16.51 34.73 334.42 16869.77
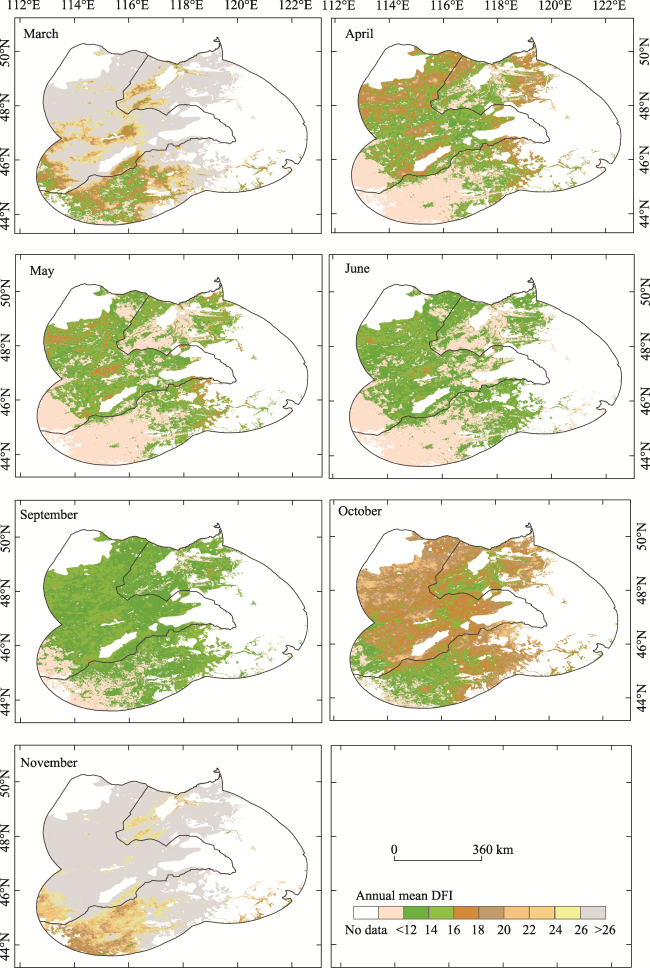
Figure 8 Spatial distributions of typical steppe monthly mean DFI during the fire prevention period in the China-Mongolia border area between 2001 and 2020
The meadow steppe DFI values were sensitive to a change in altitude because the DFI values varied gently with altitude changes between 250 and 500 m, and between 800 to 1650 m, while varying rapidly between 550 and 800 m. At altitudes greater than 700 m, there were higher fire probability values (Figure 9).
Figure 9 The relationship between DFI and elevation
The typical steppe DFI values were sensitive to a change in altitude because the DFI values varied gently with altitude changes between 250 and 500 m, and varied rapidly between 550 and 1650 m. With DFI values between 600 and 1100 m, and between 1400 and 1600 m, fire occurrences were more likely (Figure 9).

3.3.2 Temporal variation features

The temporal variation in the meadow steppe DFI showed a significant increase of 7.90% (approximately 5595.89 km²) at a significance level of 0.05, distributed in the central and northern parts of East Ujumqin Banner, the central part of Xilinhot City, Horqin Right Middle Banner, Tuquan County, Central Matad, and small Central and Southeast parts of Khalzan in Mongolia. Further, there was a significant decrease of 15.05% (approximately 10,700.66 km²), distributed in the central and northeastern parts of Arxan in Inner Mongolia, the southern part of the Ewenki Autonomous Banner, the sporadic parts of Zhalantun, Central Erdenetsagaan in Mongolia, and northern Chuluunkhoroot. A non-significant increase of 30.55% (21,726.94 km²) was observed in Dashbalbar in northern Mongolia, and there was sporadic distribution in Gurvanzagal and Khalkhgol, and Ewenki Autonomous Banner and Horqin Right Front Banner. A non-significant decrease of 46.53% (33,093.21 km²) was observed mostly in Khalkhgol, Gurvanzagal, Chuluunkhoroot, Erdenetsagaan, Dashbalbar, Bayandun, and a small section of Xin Barag Left Banner (Figure 10a). The DFI values were highest in November, decreasing to their lowest in June and September. There was an increase, from September to November, and a decrease from November to June. This was consistent with the increase and decrease observed in the withered grass (Figure 11).
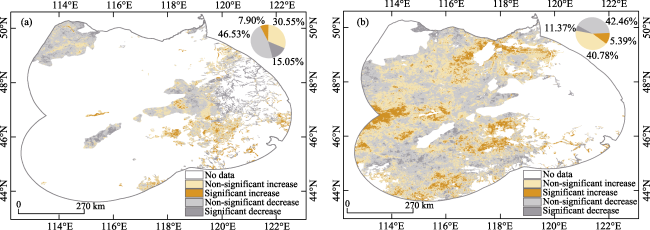
Figure 10 Temporal distribution of DFI in the China-Mongolia border area between 2001 and 2020: (a) meadow steppe (b) typical steppe
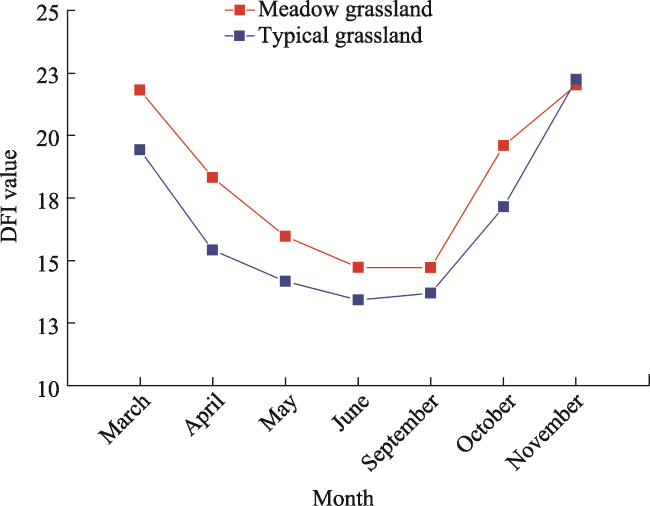
Figure 11 Monthly distribution of DFI fire prevention period in the China-Mongolia border area during 2001-2020
The temporal variation of the typical steppe of DFI showed a significant increase of 11.37% (approximately 24,235.49 km²) at a 0.05 level and was distributed in the central and northern parts of East Ujumqin Banner, the central part of Xilinhot City, Horqin Right Middle Banner, Tuquan County, Central Xin Barag Right Banner, Manzhouli, Northern Xin Barag Left Banner, Central Matad and Suhbaater, parts of Khalzan, Ongon and borders of Asgat, and Erdenetsagaan in Mongolia. At 0.05, there was a significant decrease of 5.39% (approximately 11,483.96 km²), which was distributed in the central and northeastern parts of Arxan in Inner Mongolia, the southern part of the Ewenki Autonomous Banner, Central Erdenetsagaan, scattered Naran and Dariganga, and northern Chuluunkhoroot in Mongolia. A non-significant increase of 42.46% (90,495.23 km²) was observed in central Sergelen, Bulgan, Choibalsan, and other places with significantly increased area. A non-significant decrease of 40.78% (86,914.20 km²) was observed in the central-eastern and northern parts of Matad in Mongolia, and highest decreases were in Khalkhgol, Tsagaan-Ovoo, Gurvanzagal, Holonbuir, Bayan-Uul, Bayandun, Dashbalbar Abaga Banner, and this was small in Xin Barag Right Banner (Figure 10b). The DFI value was the highest in November, decreased to its lowest in June, increased from September to November, and decreased from November to June. This was consistent with the increase and decrease observed in the withered grass (Figure 11).

3.3.3 Influence of DFI value distribution

The above observations are consistent with the DFI values with population and livestock partial correlation coefficients of -0.158 and 0.108, respectively (Table 7). There are many coal mines in sumu in southern Mongolia, and the DFI distribution of a high fire occurrence probability is low, indicating that human activities have a considerable impact on DFI distribution in the grassland area; therefore, the population and number of livestock may influence the DFI distribution (Table 7 and Figure 12). The distribution of DFI values was low in semi-agricultural and semi-pastoral banners (counties). Climatic factors and human activities influence global fires (Aldersley et al., 2011). The DFI value is generally higher in some years than in others, which may be related to the amount of precipitation and temperature of that year. A correlation was observed between the DFI values and precipitation and temperature, with correlation coefficients of 0.225 and -0.614, respectively (Table 7 and Figure 13). Dead fuel moisture and available water capacity showed weak correlations (Sesnie et al., 2018), whereas temperature showed a greater correlation.
Table 7 Influencing factors of DFI value partial correlation coefficient
Temperature Precipitation Livestock Population
DFI values -0.641 0.225 0.108 -0.158

*Significance at the 0.01 level.

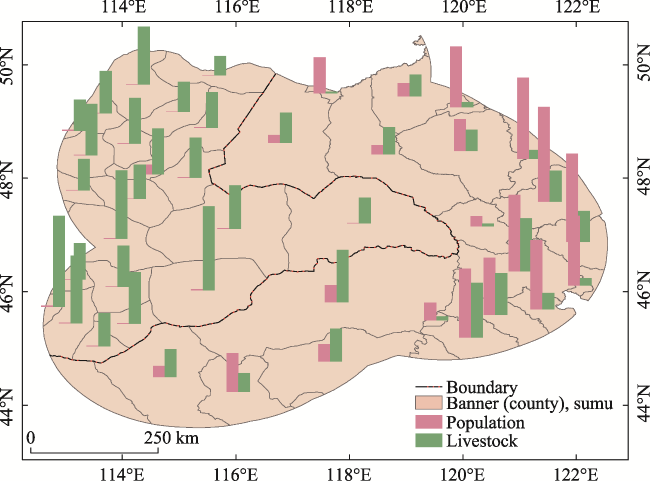
Figure 12 Population and livestock densities in the China-Mongolia border area
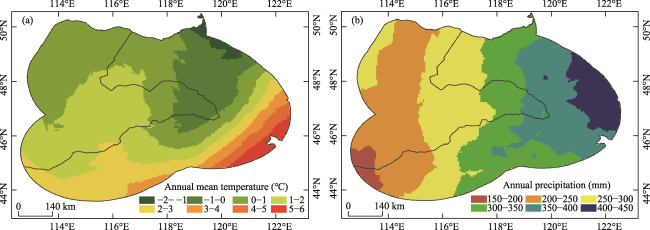
Figure 13 Spatial distribution of the average annual air temperature (a) and precipitation (b) in the China-Mongolia border area

4 Discussion

4.1 Determination of DFI thresholds for fire occurrence areas

Compared with hyperspectral CDI index, multi-spectral DFI was more applicable. Compared with NDI, NDTI, NDSVI, STI, SWIR32, CRIM and SACRI, DFI had better inversion of non-photosynthetic vegetation and could a better express dry grass and provide data support for fire warning. The distribution of fire occurrence area (DFI values of 12-26 and 14-26) in the meadow steppe and typical steppe areas, respectively, and were similar to the distribution of the non-photosynthetic vegetation index (NPV) values in the range of 2.67-27.2 (Chai et al., 2020) and 7.05-26.5 (Cao et al., 2010). Moisture content has a significant effect on the spectral characteristics of Bare Soil (BS) and NPV, especially in the SWIR spectral region, and can help distinguish between BS and NPV (Quemada and Daughtry, 2016). In the 400-2400 nm spectral region, moisture content not only reduces the spectral reflectance of BS and NPV but also changes the spectral curve shape (Xie et al., 2016). A larger DFI value is related to moisture content. Normalization-corrected data attenuates the effects of moisture (Jacques et al., 2014). The DFI values of the water bodies were very high (greater than 26); therefore, the water bodies were all masked. However, the values around the water bodies were also relatively high, reflecting the fires that occur in the meadow steppe area, in the 20-22 range. The typical steppe mainly occurs in the 16-22 range. The range of values is related to the moisture content of the water bodies. The DFI value of the typical steppe area was lower than that of the meadow steppe area, because the meadow steppe area consist of rich vegetation types and superior water and heat conditions (Ol et al., 2013; Ren et al., 2018). Plateau forests and meadow steppes have the latest withering periods, which may be related to their productivity. The typical steppes are relatively late (Zhao et al., 2021). The results of the aforementioned study are consistent with those of the present study, in terms of the distribution of DFI values for meadow and typical steppes.
The fire in Khalkhgol on the southern China-Mongolia on October 25th, 2021 (DOY 298) midday was reported by http://news.cctv.com/china/. Using MCD64A1 data the occurrence and DFI of the fire area was quantified using MOD09A1 data (DOY 297). The range of the DFI values was with in the DFI fire occurrence thresholds, and its accuracy was 98.3% (Table 8). The meadow steppe DFI values and typical steppe DFI values of these areas are distributed in the ranges of 20-22 and 16-22, respectively, which are consistent with our results that showed a high probability of fire. The fire is categorized as an emergency hazard, the DFI is calculated from past fire occurrences, therefore, field data validation is more difficult except during the fire prevention period, where the study area is monitored. However, the DFI quantified for the area where the fire occurred indicates potential fire hazards, showing the reliability of the statistics of this study.
Table 8 Accuracy of DFI thresholds
DFI values Area (km2) Accuracy
In threshold 893.275623 0.983
Not in threshold 15.43

4.2 DFI value distribution characteristics

Mongolia Matad Sum, Erdenetsagaan Sum, and Khalkhgol Sum are located in the Dornod Mongol Strictly Protected Areas of the Eastern Mongolian Grassland Nature Reserve in Mongolia, mainly on hills and plains (Hong, 2016). The Daur National Nature Reserve in Haorotu Sumu of Dornod Province is sparsely populated (Sukhbaatar and Odgerel, 2006; Ol et al., 2013), and its natural and geographical environment has not been polluted or damaged by human activities. It has maintained its original natural appearance and abundant pasture resources. Other protected areas include the Nomrog strictly protected area, Daguuriin Mongol - A Strictly Protected Area, Daguuriin Mongol - B Strictly Protected Area, Nomrog Mnt. Strictly Protected Area, the Ugtam Mnt. Nature Reserves, Toson Khulstai Nature Reserves, and Lkhachinvandad Mnt. Nature Reserves. Hulunbuir City, Khingan League, Xilingol League, and other areas in Inner Mongolia have continuous grassland distributions, long withers period, and a dry climate. Grassland fires occur frequently due to drought, and with the implementation of ecological projects, such as Restoring Farmland to Grassland in recent years, some areas that used to be ecologically degraded, with low vegetation coverage and low amounts of fuel, now show increased vegetation coverage and availability, with an increasing content of combustible materials, creating new fire zones (Huang et al., 2021). The Mongolian Plateau of the China-Mongolia border has distributions of the easy to burn fuel vegetation type meadow steppe and typical steppe. Abaga Banner has a relatively high population and stocking density, and its grassland fire rate is relatively low. Mongolia’s Dornod and Suhbaatar provinces have relatively low populations and stocking densities, and the grassland fire rate is significantly high (Qu et al., 2010). Grazing and mowing management can affect the distribution of DFI values (Li et al., 2016). The area burned by fires decreases when the population density exceeds a certain threshold, and these thresholds vary with location (Bistinas et al., 2013).
The probability of occurrence of large fires in study area in April was higher than that in March because of the impact of snow and frost in the northern region in March, a value above 26 was calculated in meadow and typical steppes. Alternatively, drought in April caused green grass to turn yellow. The probability of fire occurrences in October was higher than that in September because the vegetation withered and yellowed on DOY 290. In September, it was not completely withered or yellowed, and green vegetation was still present (Ren et al., 2019). The high values in November and March were due to snow, and the moisture in the soil severely reduced the reflectance in all ranges. The snow coverage rate of the Mongolian Plateau reached its maximum in December and January of the following year, and the snow began to melt from March to April of the following year (Liu et al., 2011; Li et al., 2020). Therefore, the DFI values for December, January, and February were not calculated (Zhang et al., 2016). The DFI in July and August were not selected for use because there were fewer fires in July and August (Liu et al., 2010; Liu et al., 2017; Chen et al., 2019).
The DFI values around Hulun Lake were generally low, and the DFI values in the Greater Khingan and Khentii Mountains were high. The vegetation phenology is delayed with increasing altitude (Bao et al., 2021; Wu et al., 2021), and the DFI value is related to increasing altitude. Elevation is an important factor in the vertical distribution of vegetation in mountainous areas because it influences precipitation and air temperature (Jin et al., 2009; Zhang et al., 2011; Mu et al., 2013; Zhao et al., 2016), and may also be influenced by the population and livestock (Zhang et al., 2022).
Many standard fire data products are currently available, such as MCD54A1, MCD64A1, MCD14ML, GFED and Fire_CCI. The MCD64A1 burned area mapping algorithm was developed in 2009(Louis, 2009). The product was generated using surface reflectance and active fire input data. General improvement (reduced omission error) was detected in the burned area. There were significantly better detection of small burns. Expanded per-pixel quality assurance (QA) product layer. The MCD54A1 product was then discontinued and replaced with MCD64A1. The MCD14ML resolution was 1000 m (Louis, 2016). GFED4 burned area data provided the global monthly burned area at 0.25° spatial resolution from 1997 to 2015 (Louis, 2013). The most recent BA algorithm from the ESA was designed for MERIS sensor of ENVISAT, which offers spectral bands in the visible and near infrared spectra at a spatial resolution of 300 m. The higher spatial resolution of the Fire_CCI product (300 m) enabled better detection of smaller fires; however, the results proved the opposite. The pixel size analysis showed a tendency for large commission errors due to confusion between burned land and other disturbances. Fire_CCI is a recent product and its validation is still at its initial stage; preliminary comparisons showed good agreement with other global products, but greater omission and commission errors. Further validation is in progress (Davide, 2017). The MCD64A1 product was used for data quality and resolution.
This study provides some reference basis for the later research on the relationship between DFI and fire, but there are still some limitations. Combustibles are the basis for the occurrence and development of fires, but there is a lack of real-time monitoring of combustibles and reliable data. Fire warnings necessitate determining the basic data required for combustibles. However, a good indicator of non-photosynthetic vegetation is DFI, which was previously indicated by NDVI for combustibilities (Bao, 2013; Liu et al., 2014), there are many reasons for why the complete presence or absence of NDVI during the fire protection period is related to local grazing and mowing. Although DFI can better express combustible materials, it uses an index to represent the amount of dead grass cover rather than the actual amount of dead grass. The actual amount of dead grass, degree of fuel continuity, and water content of fuel provide more accurate data for determining fire risk. The fire source is random, and the fire risk weather is relatively large, but no fire will occur when in the absence of combustibles. Therefore, an accurate expression of combustibles is very important in fire risk warnings, and the accurate calculation of combustibles can provide data support for real-time monitoring of fire risk warnings. Currently, most research is focused on weather warnings of fire risk rather than on the warnings of combustible fire risk (Fox et al., 2018; Puneet et al., 2020; Zhuang et al., 2021). Research on the relationship between DFI and fire can provide reliable scientific data support and knowledge for fire warnings. The varying threshold ranges of DFI in the study area may be different.
The fire areas were all in the grassland areas of the China-Mongolia border. Water and snow have certain influence on the DFI inversion. Verification of the DFI retrieved by Sentinel-2 and non-photosynthetic vegetation cover measured in the field will be our future work. In the future, the red-edge bands (705, 740, and 783) of Sentinel-2 will be used to improve the estimation accuracy of vegetation combustibles (Sesnie et al., 2018). However, because the fire occurred suddenly and the DFI was collected in the area where the fire occurred, monitoring the field DFI in the area before the fire was difficult.

5 Conclusion

The meadow steppe DFI threshold for fire occurrence areas was 14-26, of which 20-22 had the highest fire occurrence rate, accounting for 31.0%. The typical steppe DFI threshold for fire occurrence areas was 12-26. This can be used for real-time fire risk warning and to provide data on basic flammable materials. The result also showed that areas with high fire DFI values included Khalkhgol, Matad, Erdenetsagaan, Bayandun, Gurvanzagal, Dashbalbar in Mongolia, and scattered areas of the Greater Khingan Mountains (forest edge meadow steppe area), East and West Ujumqin Banner, and Xin Barag Right Banner. The DFI is higher on the Mongolian side of the border in the specified fire months. Therefore, it is better to focus on fire management in Mongolia and on defense in China. The results of this study may provide useful information on surface energy balance, grassland carbon storage, soil moisture, grassland health, land desertification, and grazing in the study area, especially for fire risk management.
[1]
Aase J K, Tanaka D L, 1991. Reflectances from four wheat residue cover densities as influenced by three soil backgrounds. Agronomy Journal, 83(4): 753-757.

DOI

[2]
Abera T A, Heiskanen J, Maeda E E et al., 2022. Improved detection of abrupt change in vegetation reveals dominant fractional woody cover decline in Eastern Africa. Remote Sensing of Environment, 271: 112897.

DOI

[3]
Aldersley A, Murray S J, Cornell S E, 2011. Global and regional analysis of climate and human drivers of wildfire. The Science of the Total Environment, 409: 3472-3481.

DOI PMID

[4]
Bai X L, Zhao W Z, Ji S X et al., 2021. Estimating fractional cover of non-photosynthetic vegetation for various grasslands based on CAI and DFI. Ecological Indicators, 131: 108252.

DOI

[5]
Balshi M S, McGuire A D, Zhuang Q et al., 2007. The role of historical fire disturbance in the carbon dynamics of the pan-boreal region: A process-based analysis. Journal of Geophysical Research, 112(G2): G02029.

[6]
Bao G, Bao Y H, Qin Z H et al., 2016. Modeling net primary productivity of terrestrial ecosystems in the semi-arid climate of the Mongolian Plateau using LSWI-based CASA ecosystem model. International Journal of Applied Earth Observation and Geoinformation, 46: 84-93.

DOI

[7]
Bao G, Jin H G J L T, Tong S Q et al., 2021. Autumn phenology and its covariation with climate, spring phenology and annual peak growth on the Mongolian Plateau. Agricultural and Forest Meteorology, 298/299: 108312.

DOI

[8]
Bao G, Qin Z H, Bao Y H et al., 2014. NDVI-based long-term vegetation dynamics and its response to climatic change in the Mongolian Plateau. Remote Sensing, 6(9): 8337-8358.

DOI

[9]
Bao Y L, 2013. Study on inversion of combustible characteristic parameters and evaluation of flammability and early warning of fire risk in Songnen grassland[D]. Changchun: Northeast Normal University. (in Chinese)

[10]
Bao Y L, Zhang J Q, Liu X P et al., 2013. Analysis on grass fire traces extracted and pre-disaster characteristics of combustibles based on HJ-1B satellite data. Journal of Catastrophology, 28(1): 32-35. (in Chinese)

[11]
Bao Y L, Zhang J Q, Zhao Y S et al., 2011. Estimation of moisture content of grassland fuel based on hyperspectra. Infrared, 32(7): 38-42. (in Chinese)

[12]
Bistinas I, Oom D, Sa A C et al., 2013. Relationships between human population density and burned area at continental and global scales. PloS One, 8(12): e81188.

DOI

[13]
Blickensdörfer L, Schwieder M, Pflugmacher D et al., 2022. Mapping of crop types and crop sequences with combined time series of Sentinel-1, Sentinel-2 and Landsat 8 data for Germany. Remote Sensing of Environment, 269: 112831.

DOI

[14]
Cao X, Chen J, Matsushita B et al., 2010. Developing a MODIS-based index to discriminate dead fuel from photosynthetic vegetation and soil background in the Asian steppe area. International Journal of Remote Sensing, 31(6): 1589-1604.

DOI

[15]
Carlson J D, Burgan R E, 2010. Review of users needs in operational fire danger estimation: The Oklahoma example. International Journal of Remote Sensing, 24(8): 1601-1620.

DOI

[16]
Ceccato P, Gobron N, Flasse S et al., 2002. Designing a spectral index to estimate vegetation water content from remote sensing data (Part 1): Theoretical approach. Remote Sensing of Environment, 82(2): 188-197.

DOI

[17]
Chai G Q, Wang J P, Wu M Q et al., 2020. Mapping the fractional cover of non-photosynthetic vegetation and its spatiotemporal variations in the Xilingol grassland using MODIS imagery (2000-2019). Geocarto International, 37(7): 1-17.

DOI

[18]
Chen B Z, Xu G, Coops N C et al., 2014. Changes in vegetation photosynthetic activity trends across the Asia-Pacific region over the last three decades. Remote Sensing of Environment, 144: 28-41.

DOI

[19]
Chen J Q, John R, Sun G et al., 2018. Prospects for the sustainability of social-ecological systems (SES) on the Mongolian plateau: Five critical issues. Environmental Research Letters, 13(12): 123004.

DOI

[20]
Chen L F, Dou Q, Zhang Z M et al., 2019. Moisture content variations in soil and plant of post-fire regenerating forests in central Yunnan Plateau, Southwest China. Journal of Geographical Sciences, 29(7): 1179-1192.

DOI

[21]
Claudia V, Francesca D G, Blazej K et al., 2019. Data descriptor: A 1980-2018 global fire danger re-analysis dataset for the Canadian fire weather indices. Scientific Data, 6(190032): 1-10.

DOI

[22]
Dai E F, Huang Y, Wu Z et al., 2016. Analysis of spatio-temporal features of a carbon sourcesink and its relationship to climatic factors in the Inner Mongolia grassland ecosystem. Journal of Geographical Sciences, 26(3): 297-312.

DOI

[23]
Donald M, Jeremy S L, 2017. Climate change and the eco-hydrology of fire: Will area burned increase in a warming western USA? Ecological Applications, 27(1): 26-36.

DOI PMID

[24]
Douglas E M, Vogel R M, Kroll C N, 2000. Trends in floods and low flows in the United States: Impact of spatial correlation. Journal of Hydrology, 240(1/2): 90-105.

DOI

[25]
Elvidge C D, 2007. Visible and near infrared reflectance characteristics of dry plant materials. International Journal of Remote Sensing. 11(10): 1775-1795.

DOI

[26]
Feng Z D, Zhai X W, Ma Y Z et al., 2007. Eolian environmental changes in the northern Mongolian Plateau during the past -35,000 yr. Palaeogeography, Palaeoclimatology, Palaeoecology, 245(3/4): 505-517.

DOI

[27]
Fox D M, Carrega P, R en Y et al., 2018. How wildfire risk is related to urban planning and fire weather index in SE France (1990-2013). Science of the Total Environment, 621: 120-129.

DOI

[28]
French N H F, de Groot W J, Jenkins L K et al., 2011. Model comparisons for estimating carbon emissions from North American wildland fire. Journal of Geophysical Research: Biogeosciences, 116(G4): G00K05.

[29]
Ghesquiere F, 2018. A decade of progress in disaster risk management. Global Facility for Disaster Reduction and Recovery GFDRR, N.W., Washington, D.C., U.S.A.

[30]
Guerschman J P, Hill M J, Renzullo L J et al., 2009. Estimating fractional cover of photosynthetic vegetation, non-photosynthetic vegetation and bare soil in the Australian tropical savanna region upscaling the EO-1 Hyperion and MODIS sensors. Remote Sensing of Environment, 113(5): 928-945.

DOI

[31]
Guo Z K, Kurban A, Ablekim A et al., 2021. Estimation of photosynthetic and non-photosynthetic vegetation coverage in the lower reaches of Tarim River based on Sentinel-2A data. Remote Sensing, 13(8): 1458.

DOI

[32]
He T H, Lamont B B, Pausas J G, 2019. Fire as a key driver of Earths biodiversity. Biological Reviews of the Cambridge Philosophical Society, 94(6): 1983-2010.

DOI

[33]
Hilker T, Natsagdorj E, Waring R H et al., 2014. Satellite observed widespread decline in Mongolian grasslands largely due to overgrazing. Global Change Biology, 20(2): 418-428.

DOI PMID

[34]
Hong Y Y, 2016. Analysis of spatial-temporal changes of vegetation NDVI in border areas of China-Mongolia[D]. Hohhot: Inner Mongolia Normal University. (in Chinese)

[35]
Huang L, Ning J, Zhu P et al., 2021. The conservation patterns of grassland ecosystem in response to the forage-livestock balance in North China. Journal of Geographical Sciences, 31(4): 518-534.

DOI

[36]
Jacques D C, Kergoat L, Hiernaux P et al., 2014. Monitoring dry vegetation masses in semi-arid areas with MODIS SWIR bands. Remote Sensing of Environment, 153: 40-49.

DOI

[37]
Jeong S J, Ho CH H, Gim H J et al., 2011. Phenology shifts at start vs. end of growing season in temperate vegetation over the Northern Hemisphere for the period 1982-2008. Global Change Biology, 17(7): 2385-2399.

DOI

[38]
Jin X M, Wan L, Zhang Y K et al., 2009. Quantification of spatial distribution of vegetation in the Qilian Mountain area with MODIS NDVI. International Journal of Remote Sensing, 30(21): 5751-5766.

DOI

[39]
John R, Chen J Q, Yang O Z T et al., 2013. Vegetation response to extreme climate events on the Mongolian Plateau from 2000 to 2010. Environmental Research Letters, 8(3): 035033.

DOI

[40]
Kirchmeier Y M C, Gillett N P, Zwiers F W et al., 2019. Attribution of the influence of human-induced climate change on an extreme fire season. Earths Future, 7(1): 2-10.

[41]
Li C H, Sachula, Liu G X et al., 2020. Spatiotemporal changes of snow cover and its response to climate changes in the Mongolian Plateau from 2000 to 2017. Chinese Journal of Grassland, 42(2): 95-104. (in Chinese)

[42]
Li N, Bao Y L, Yin S et al., 2016. Spatiotemporal characteristics of grassland fire in China-Mongolia border regions. Journal of Catastrophology, 31(3): 207-210. (in Chinese)

[43]
Li N, Zhang J Q, Bao Y L et al., 2018. Himawari-8 satellite based dynamic monitoring of grassland fire in China-Mongolia border regions. Sensors, 18(1): 1-15.

DOI

[44]
Li W L, Kuang W H, Jun L et al., 2021. Adaptive evolution of the rural human-environment system in farming and pastoral areas of northern China from 1952-2017. Journal of Geographical Sciences, 31(6): 859-877.

DOI

[45]
Li X S, Zheng G X, Wang J Y et al., 2016. Comparison of methods for estimating fractional cover of photosynthetic and non-photosynthetic vegetation in the Otindag Sandy Land using GF-1 wide-field view data. Remote Sensing, 8(10): 800.

DOI

[46]
Li Y P, Zhao J J, Guo X Y et al., 2017. The influence of land use on the grassland fire occurrence in the northeastern Inner Mongolia Autonomous Region, China. Sensors, 17(3): 437.

DOI

[47]
Liu J Y, Qi Y Q, Shi H D et al., 2008. Estimation of wind erosion rates by using 137Cs tracing technique: A case study in Tariat-Xilin Gol transect, Mongolian Plateau. Chinese Science Bulletin, 53(5): 751-758.

DOI

[48]
Liu M F, Zhao J J, Guo X Y et al., 2017. Study on climate and grassland fire in Hulun Buir, Inner Mongolia Autonomous Region, China. Sensors, 17(3): 616.

DOI

[49]
Liu X P, Zhang J Q, Tong Z J, 2010. The dynamic danger assessment for grassland fire disaster in Xilingol, Inner Mongolia. Computational Intelligence: Foundations and Applications, 1110-1116.

[50]
Liu X P, Zhang J Q, Tong Z J et al., 2011. Grid-based multi-attribute risk assessment of snow disasters in the grasslands of Xilingol, Inner Mongolia. Human and Ecological Risk Assessment: An International Journal, 17(3): 712-731.

DOI

[51]
Liu X P, Zhang J Q, Tong Z J et al., 2012. GIS-based multi-dimensional risk assessment of the grassland fire in northern China. Natural Hazards, 64(1): 381-395.

DOI

[52]
Liu X P, Zhang J Q, Tong Z J, 2014. Modeling the early warning of grassland fire risk based on fuzzy logic in Xilingol, Inner Mongolia. Natural Hazards, 75(3): 2331-2342.

DOI

[53]
Long T F, Zhang Z M, He G J et al., 2019. 30 m resolution global annual burned area mapping based on Landsat Images and Google Earth Engine. Remote Sensing, 11(5): 489.

DOI

[54]
Louis G, Boschetti L, David R et al., 2018.

[55]
Louis G, James T R, Guido R et al., 2013. Analysis of daily, monthly, and annual burned area using the fourth-generation global fire emissions database (GFED4). Journal of Geophysical Research: Biogeosciences, 118(1): 317-328.

[56]
Louis G, Tatiana L, David P R et al., 2009. An active-fire based burned area mapping algorithm for the MODIS sensor. Remote Sensing of Environment, 113(2): 408-420.

DOI

[57]
Louis G, Wilfrid S, Christopher O J, 2016. The collection 6 MODIS active fire detection algorithm and fire products. Remote Sensing of Environment, 178: 31-41.

DOI PMID

[58]
Luis C A, Raquel S A, Santos C et al., 2011. Identification of mangrove areas by remote sensing: The ROC curve technique applied to the northwestern Mexico coastal zone using landsat imagery. Remote Sensing, 3(1): 1568-1583.

DOI

[59]
Miguel M P, Carlos C D, Alexandra H et al., 2020. Enhancing the fire weather index with atmospheric instability information. Environmental Research Letters, 15(9): 0940b0947.

[60]
Mu S J, Yang H F, Li J L et al., 2013. Spatio-temporal dynamics of vegetation coverage and its relationship with climate factors in Inner Mongolia, China. Journal of Geographical Sciences, 23(2): 231-246.

DOI

[61]
Nagler P L, Inoue Y, Glenn E P et al., 2003. Cellulose absorption index (CAI) to quantify mixed soil-plant litter scenes. Remote Sensing of Environment, 87(2/3): 310-325.

DOI

[62]
Neupert R F, 1999. Population, nomadic pastoralism and the environment in the Mongolian Plateau. Population and Environment, 20(5): 413-441.

DOI

[63]
Nikolaos N, Marios S, Lampros V, 2022. Contribution to the study of forest fires in semi-arid regions with the use of Canadian fire weather index application in Greece. Climate, 10(10): 143.

DOI

[64]
Ol J, Bo L R, Ge R CH T, 2013. Present situation and protection in Daurian steppe ecological area. Journal of MUC (Natural Sciences Edition), 12(1): 24-26. (in Chinese)

[65]
Partal T, Kahya E, 2006. Trend analysis in Turkish precipitation data. Hydrological Processes, 20(9): 2011-2026.

DOI

[66]
Puneet A, Tang J L, Adithya N L N, 2020. Big data and predictive analytics in fire risk using weather data. Risk Analysis, 13480.

[67]
Qi J G, Robin M, Philip H et al., 2002. RANGES improves satellite-based information and land cover assessments in southwest United States. EOS Transactions American Geophysical Union, 83(51): 601-612.

[68]
Qu Z P, Zheng S X, Bai Y F, 2010. Spatiotemporal patterns and driving factors of grassland fire on Mongolian Plateau. Chinese Journal of Applied Ecology, 21(4): 807-813. (in Chinese)

[69]
Quemada M, Daughtry C S T, 2016. Spectral indices to improve crop residue cover estimation under varying moisture conditions. Remote Sensing, 8(8): 660.

DOI

[70]
Reid C E, Brauer M, Johnston F H et al., 2016. Critical review of health impacts of wildfire smoke exposure. Environmental Health Perspectives, 124(9): 1334-1343.

DOI PMID

[71]
Ren H R, Zhang B, Guo X L, 2018. Estimation of litter mass in nongrowing seasons in arid grasslands using MODIS satellite data. European Journal of Remote Sensing, 51(1): 222-230.

DOI

[72]
Ren S L, Qin Q M, Ren H Z et al., 2019. New model for simulating autumn phenology of herbaceous plants in the Inner Mongolian Grassland. Agricultural and Forest Meteorology, 275: 136-145.

DOI

[73]
Roberts D A, Dennison P E, Gardner M E et al., 2015. Evaluation of the potential of hyperion for fire danger assessment by comparison to the airborne visible/infrared imaging spectrometer. Transactions on Geoscience & Remote Sensing IEEE, 41(6): 1297-1310.

[74]
Rong G Z, Alu S, Li K W et al., 2020. Rainfall induced landslide susceptibility mapping based on Bayesian optimized random forest and gradient boosting decision tree models: A case study of Shuicheng County, China. Water, 12(11): 3066.

DOI

[75]
Sesnie S, Eagleston H, Johnson L et al., 2018. In-situ and remote sensing platforms for mapping fine-fuels and fuel-types in Sonoran semi-desert grasslands. Remote Sensing, 10(9): 1357-1387.

DOI

[76]
Seyin B T, 2002. Preliminary study on grassland fire risk regionalization. Inner Mongolia Prataculture, 14(4): 32-35. (in Chinese)

[77]
Suk B, Od G R, 2006. A study on e-government policy in Mongolia. In: Symposium on Information & Telecommunication Technologies.

[78]
Tong S Q, Zhang J Q, Bao Y H et al., 2018. Analyzing vegetation dynamic trend on the Mongolian Plateau based on the Hurst exponent and influencing factors from 1982-2013. Journal of Geographical Sciences, 28(5): 595-610.

DOI

[79]
Tucker C J, Daniel A S, Jorge E P et al., 2001. Higher northern latitude normalized difference vegetation index and growing season trends from 1982 to 1999. International Journal of Biometeorology, 45(4): 184-190.

PMID

[80]
Vermote E F, Roger J C, Ray J P, 2015. MODIS Surface Reflectance User’s Guide Collection 6. ttps://ladsweb.modaps.eosdis.nasa.gov/search/.

[81]
Wang J, Zhao M L, Willms W D et al., 2015. Can plant litter affect net primary production of a typical steppe in Inner Mongolia? Journal of Vegetation Science, 22(2): 367-376.

DOI

[82]
Wang W Q, Chen X H, Cao X et al., 2020. A novel spectral linear transformation to estimate non-photosynthetic vegetation coverage in North Asian Steppe. In: The International Archives of the Photogrammetry, R.S.a.S.I.S. (ed.), 2020 XXIV ISPRS Congress Germany.

[83]
Wu L Z, Ma X F, Dou X et al., 2021. Impacts of climate change on vegetation phenology and net primary productivity in arid Central Asia. Science of the Total Environment, 796: 149055.

DOI

[84]
Xie X Y, Liu Y M, Li J Z et al., 2016. Remote sensing estimation of plant litter cover based on the spectra of plant litter-soil mixed scenes. Spectroscopy and Spectral Analysis, 36(7): 2217-2223. (in Chinese)

[85]
Yang J, Dong Q R, 2020. Simulation of the evolution of the 21 May 2009 wildfire from Mongolia to China using WRF-Fire Model. Transactions of Atmospheric Sciences, 43(4): 718-727. (in Chinese)

[86]
Yu S, Jiang L, Du W L et al., 2020. Estimation and spatio-temporal patterns of carbon emissions from grassland fires in Inner Mongolia, China. Chinese Geographical Science, 30(4): 572-587.

DOI

[87]
Yue J B, Tian Q J, 2020. Estimating fractional cover of crop, crop residue, and soil in cropland using broadband remote sensing data and machine learning. International Journal of Applied Earth Observation and Geoinformation, 89: 1-15.

[88]
Zahidi S, 2022. The Global Risks Report 2022. World Economic Forum, Geneva, Switzerland, p.7.

[89]
Zhang G L, Xu X L, Zhou C P et al., 2011. Responses of grassland vegetation to climatic variations on different temporal scales in Hulun Buir Grassland in the past 30 years. Journal of Geographical Sciences, 21(4): 634-650.

DOI

[90]
Zhang J Q, Cui L, Tong Z J et al., 2013. Grid GIS and optimal segmentation based early warning of grassland fire disaster risk threshold in Hulunbeier grassland. Systems Engineering: Theory & Practice, 33(3): 770-775. (in Chinese)

[91]
Zhang J Q, Liu X P, Tong Z J, 2007. The study of grassland fire disaster risk assessment and regionalization: A case study in the western Jilin province. Geographical Research, 26(4): 755-762. (in Chinese)

DOI

[92]
Zhang J Q, Zhou D W, Song Z S et al., 2006. A new preception on risk assessment and risk management of grassland fire disaster. Journal of Basic Science and Engineering, 14(Suppl.): 56-62. (in Chinese)

[93]
Zhang X Y, Hu Y F, Zhuang D F et al., 2009. NDVI spatial pattern and its differentiation on the Mongolian Plateau. Journal of Geographical Sciences, 19(4): 403-415.

DOI

[94]
Zhang Y H, Cao T, Kan X et al., 2016. Spatial and temporal variation analysis of snow cover using MODIS over Qinghai-Tibetan Plateau during 2003-2014. Journal of the Indian Society of Remote Sensing, 45(5): 887-897.

DOI

[95]
Zhang Z P, Liu J B, Chen S Q et al., 2022. Anthropogenic origin of a change in the fire-climate relationship in northern China after -2000 yr BP: Evidence from a 15,500-year black carbon record from Dali Lake. Journal of Geographical Sciences, 32(6): 1136-1156.

DOI

[96]
Zhang Z X, Feng Z Q, Zhang H Y et al., 2017. Spatial distribution of grassland fires at the regional scale based on the MODIS active fire products. International Journal of Wildland Fire, 26(3): 209-218.

DOI

[97]
Zhao H Y, Gong L J, Qu H H et al., 2016. The climate change variations in the northern Greater Khingan Mountains during the past centuries. Journal of Geographical Sciences, 26(5): 585-602.

DOI

[98]
Zhao X, Shen H H, Geng X Q et al., 2021. Three-decadal destabilization of vegetation activity on the Mongolian Plateau. Environmental Research Letters, 16(3): 034049.

DOI

[99]
Zhou D W, Zhang Z S, 1996. Grassland fire factors and their ecological effects. Grassland of China, (2): 73-76. (in Chinese)

[100]
Zhuang Y Z, Fu R, Benjamin D S et al., 2021. Quantifying contributions of natural variability and anthropogenic forcings on increased fire weather risk over the western United States. PNAS, 118(45): e2111875118.

DOI

Outlines

/