Special Issue: Human-environment interactions and Ecosystems

Remote sensing assessment of the ecological benefits provided by national key ecological projects in China during 2000-2019

  • SHAO Quanqin , 1, 2 ,
  • LIU Shuchao 1, 2 ,
  • NING Jia 1 ,
  • LIU Guobo 1, 2 ,
  • YANG Fan 3 ,
  • ZHANG Xiongyi 1, 2 ,
  • NIU Linan 1, 2 ,
  • HUANG Haibo 1 ,
  • FAN Jiangwen 1 ,
  • LIU Jiyuan 1
Expand
  • 1. Key Laboratory of Terrestrial Surface Pattern and Simulation, Institute of Geographic Sciences and Natural Resources Research, CAS, Beijing 100101, China
  • 2. University of Chinese Academy of Sciences, Beijing 100049, China
  • 3. School of Economics and Management, Zhejiang Ocean University, Zhoushan 316022, Zhejiang, China

Shao Quanqin (1962-), PhD and Professor, specialized in ecological information. E-mail:

Received date: 2023-04-02

  Accepted date: 2023-05-25

  Online published: 2023-08-29

Supported by

National Key R&D Program of China(2017YFC0506501)

Strategic Priority Research Program of the Chinese Academy of Sciences(XDA23100203)

Abstract

We propose a theoretical framework for assessing the ecological benefits provided by key national ecological projects in China over the past 20 years. A dataset consisting of six primary indicators and nine secondary indicators of ecosystem structure, ecosystem quality, and ecosystem services for 2000-2019 was generated using ground survey and remote sensing data. Ecological benefits were quantitatively evaluated following the implementation of these projects in China. Areas with medium, relatively high, and high degrees of ecological restoration accounted for 24.1%, 11.9%, and 1.7% of the national land, respectively. Degrees of ecological restoration were higher in areas with greater numbers of ecological projects. Areas with relatively and absolutely high degrees of ecological restoration were mainly concentrated in the Loess Plateau, the farming-pastoral zone of northern China, the Northeast China Plain, and an area spanning the borders of Sichuan, Yunnan, Guizhou, Chongqing, and Hunan. The relative contributions of climatic factors and ecological projects to changes in vegetation net primary productivity were 85.4% and 14.6%, respectively, and the relative contributions of climatic factors and ecological projects to changes in water erosion modulus were 69.5% and 30.5%, respectively. The restoration potential of national vegetation coverage was 20%, and the restoration potential percentage of forest and grassland vegetation coverage was 6.4% and 23%, respectively. Climatic conditions can inhibit ecological restoration. Areas with relatively high and high degrees of ecological restoration were mainly distributed in areas with an average annual temperature greater than 0°C and annual precipitation greater than 300 mm. Therefore, the limitations associated with climate conditions require consideration during the implementation of national ecological projects. The implementation of combined measures should be emphasized, and the benefits of ecological investment funds should be maximized.

Cite this article

SHAO Quanqin , LIU Shuchao , NING Jia , LIU Guobo , YANG Fan , ZHANG Xiongyi , NIU Linan , HUANG Haibo , FAN Jiangwen , LIU Jiyuan . Remote sensing assessment of the ecological benefits provided by national key ecological projects in China during 2000-2019[J]. Journal of Geographical Sciences, 2023 , 33(8) : 1587 -1613 . DOI: 10.1007/s11442-023-2144-4

1 Introduction

China has enjoyed rapid social and economic development since its reform and opening up in 1978. However, with the accelerated development of industrialization, urbanization, and agricultural modernization, there has been a long-term irrational utilization of resources, resulting in serious ecosystem degradation. In November 1998, the State Council adopted the “National Ecological and Environmental Construction Plan”, which aimed to complete a series of projects with significant impact on improving the country’s ecological environment and reversing the trend of environmental deterioration which has occurred over approximately 50 years. To achieve the above objectives, the Chinese government has launched a series of major ecological projects, including the Natural Forest Protection Program, the Grain for Green Project, the Three-North Shelterbelt Forest Program (fourth and fifth phases), the Beijing-Tianjin Sand Source Control Program, the Yangtze River Shelterbelt Construction Project (second and third phases), the Karst Rocky Desertification Control Program in Southwest China (launched in 2005), and the Returning Rangeland to Grassland Program (launched in 2003) (Shao et al., 2017). According to incomplete statistics, the total investment in China’s major ecological projects has exceeded 1.7 trillion yuan (Cai et al., 2020). To evaluate the ecological benefits of these major ecological projects after 20 years of implementation, this paper proposes ecological benefit evaluation indicators, index acquisition technology, and the evaluation of major ecological projects method, carried out by a quantitative evaluation.
In 2000, the United States initiated and carried out the Millennium Ecosystem Assessment (MA) (MEA, 2003) internationally, proposing the framework and indicator system for ecosystem assessment for the first time. The study evaluated the methods for assessing ecosystem conditions and services, as well as the impact of ecosystem service changes on human well-being. The MA’s ecosystem assessment framework has been widely applied in ecosystem assessments at home and abroad, but the MA’s assessment indicators focused on ecosystem service functions, and the assessment methods mainly relied on qualitative judgments based on literature review. Canadian scholars have carried out strategic ecological restoration assessments using expert scoring methods and ranked the priority of restoration treatment after the implementation of ecological engineering in degraded forest ecosystems, but lacked quantitative assessment of the ecological benefits of the project (Holt et al., 2001). The ecological conservation effectiveness assessment project implemented by the U.S. Department of Agriculture used methods such as comparison within and outside the project area and comparison before and after project implementation to evaluate the effectiveness of ecological conservation projects, but the department did not carry out an ecological restoration potential assessment (Euliss et al., 2011). The Center for International Forestry Research evaluated the effectiveness of forest conservation project implementation of REDD+ (Reducing Emissions from Deforestation and Forest Degradation) strategies in 15 countries, assessing the contribution of ecological engineering to carbon storage, but lacking an assessment of the impact of ecological engineering on other ecological services (Bǒrner et al., 2016). The European Union adopted a participatory evaluation method to evaluate the effectiveness of desertification prevention and control engineering measures in 12 countries, but it did not quantitatively evaluate the ecological benefits of desertification prevention and control projects (Rojo et al., 2012). In China, Liu et al. (2006) used the MA framework to conduct the first comprehensive evaluation of the ecosystems in western China. Ouyang et al. (2016) developed a quantitative evaluation method for regional ecosystem services, as well as an assessment method for the importance of regional ecological protection based on the quantity of ecosystem services and the number of beneficiaries. They furthermore established a quantitative evaluation method for regional ecosystem services, as well as an evaluation method for the importance of regional ecological protection that integrated the power of ecosystem services and the number of beneficiary populations. Wu et al. (2016) used ecosystem macrostructure, vegetation coverage, and windbreak and sand-fixation services as indicators, and employed linear regression analysis to examine the changing characteristics of vegetation coverage and windbreak and sand-fixation service function in the context of the first phase of the Beijing-Tianjin Sand Source Control Program from 2000 to 2010. Liu et al. (2017) evaluated the effects of soil and water conservation and ecological governance on the Loess Plateau using indicators such as land use type, vegetation coverage, soil moisture, soil erosion, and runoff sediment. However, none of these scholars have conducted research on the degree and potential of ecological system restoration, nor have they determined the contribution of ecological engineering and climate factors to changes in the ecosystem. Shao et al. (2016) selected evaluation indicators such as ecosystem structure, ecosystem quality, and ecosystem services to assess the ecological effects of the first phase of the Ecological Conservation and Restoration Project in Three-river Headwaters, and proposed a model parameter control method to determine the impact of ecological engineering and climate on changes in the Three-river Headwaters Region ecosystem. Huang et al. (2018) compared the ecological service quantity under average climate conditions and real climate conditions, and determined the effects of climate change, ecological engineering, and other human activities on changes in the ecosystem in the project area. Cai et al. (2020) used indicators such as normalized difference vegetation index (NDVI), total primary productivity (GPP), leaf area index (LAI), land use, and climate factors to evaluate the contribution of ecological engineering to vegetation restoration in arid and semi-arid areas of northern China over the past 40 years. Although these scholars have determined the contribution of ecological engineering and climate to ecological restoration in ecological engineering ecological benefit evaluation, they have not evaluated the degree and potential of ecological restoration. Currently, most research focuses on a specific region or project, and there is a lack of comprehensive ecological benefit assessment research on a national scale concerning the long-term implementation of major ecological projects.
Based on the theoretical framework of ecological benefit evaluation, this paper selects three categories of indicators, including ecosystem macrostructure, ecosystem quality, and ecosystem services, and applies six primary and nine secondary indicators, using ground and remote sensing data combined with modeled data to evaluate the ecosystem conditions. The simulation generates a long-term evaluation index parameter data set from 2000 to 2019 and quantitatively evaluates the ecological restoration degree and potential of major ecological projects over the past two decades, as well as the contribution rate of ecological projects to ecosystem changes.

2 Materials and methods

2.1 Implementation scope of major ecological projects

Since 2000, China has implemented nine major ecological projects, which involve 31 provinces (autonomous regions and municipalities directly under the Central Government) in China, with a total ecological project coverage of about 924.8 × 10⁴ km2. The nine major ecological projects mainly include the Three-North Shelterbelt Forest Program (Phase IV, Phase V, Figure 1a), Grain for Green Project (Figure 1b), Natural Forest Protection Program (Figure 1c), Beijing-Tianjin Sand Source Control Program (Figure 1d), Yangtze River Shelterbelt Construction Project (Phase II, Phase III, Figure 1e), the Pearl River Shelterbelt System Construction Project (Phase II, Phase III, Figure 1f), the Returning Rangeland to Grassland Program (Figure 1g), Ecological Conservation and Restoration Project in Three-river Headwaters (Figure 1h), and the Karst Rocky Desertification Control Program in Southwest China (Figure 1i).
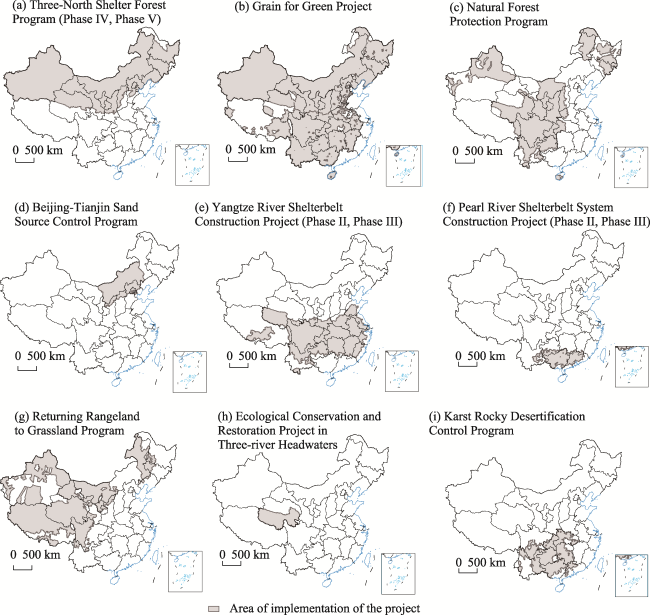
Figure 1 Spatial distribution of key ecological projects in China

Note: This map is based on the standard map with approval number GS(2019)1823 downloaded from the standard map service website of the National Bureau of Surveying, Mapping, and Geographic Information, and the base map has not been modified.

The area where three implemented ecological projects overlapped is the largest, accounting for 35.1% of the national land area according to the spatial overlap of the implementation scope of the nine major ecological projects (Figure 2 and Table 1). The area without ecological engineering implementation is the smallest, accounting for 3.7%, and was mainly distributed in coastal areas. The implemented ecological projects which overlapped with five, accounting for 6.1% of the total area, and mainly distributed in the Three-river Headwaters Region in Qinghai, central and western Inner Mongolia, northern Shaanxi, southwestern Sichuan, and northern Yunnan.
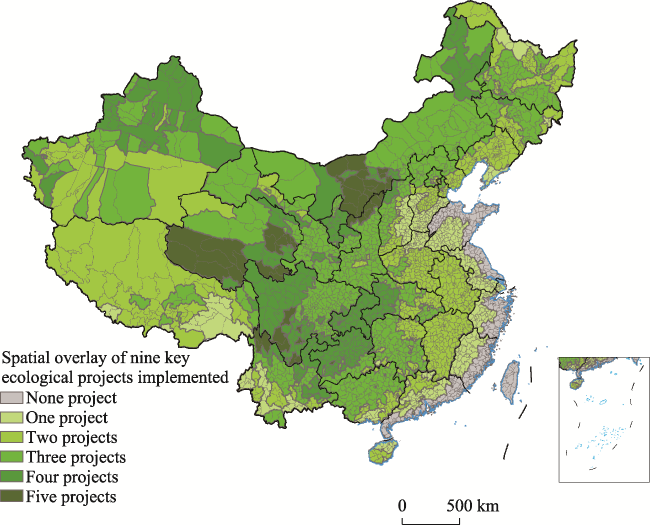
Figure 2 Spatial overlay of nine key ecological projects in China

Note: This map is based on the standard map with approval number GS(2019)1823 downloaded from the standard map service website of the National Bureau of Surveying, Mapping, and Geographic Information, and the base map has not been modified.

Table 1 Number of overlapping ecological projects and the area of each of nine key ecological projects in China
Number of projects implemented Area (× 104 km2) Percentage of land area in China (%)
0 35.2 3.7
1 78.8 8.2
2 282.1 29.4
3 336.9 35.1
4 168.4 17.5
5 58.7 6.1

2.2 Indexes for assessing the ecological benefits of key ecological projects in China over the past 20 years

The planned ecological management objectives of nine major ecological projects in China were comprehensively analyzed in this study, mainly through protecting existing vegetation, increasing vegetation coverage, improving ecosystem quality, and improving ecosystem service functions such as water retention, soil retention, and windbreak and sand fixation. Three categories of ecosystem macro-structure, ecosystem quality, and ecosystem services, six first-level indicators, and nine second-level indicators were finally selected for the evaluation of key ecological benefits of major ecological implementation over the past 20 years (Table 2) based on the principles of operability, practicality, scientific merit and pertinence of evaluation indicators, availability of remote sensing data, and their accordance to the ecological governance objectives of major ecological engineering planning.
Table 2 Indexes for assessing the ecological benefits of key ecological projects in China over the past 20 years
Categories Assessment indicators
First-level indicators Second-level indicators
Ecosystem macro-structure Area of various ecosystems Area of ecosystem structure
Rate of area change
Ecosystem quality Net primary productivity of vegetation NPP
Fractional vegetation coverage FVC
Ecosystem services Water retention Water retention
Soil retention Soil erosion modulus
Soil retention
Windbreak and sand fixation Wind erosion modulus
Windbreak and sand fixation

2.3 Acquisition and verification of evaluation index parameter data

2.3.1 Remote sensing acquisition and verification of ecosystem macro-structure data

The 1:100,000 scale national land use/cover vector data in 2008 were obtained by human-machine interactive interpretation, using the Landsat8 and other satellite remote sensing data in 2018 and referring to the China Land Use Remote Sensing Classification System (Liu et al., 2014; 2018). Then, the land-use data were repeatedly revised through field verification with GF-2, UAV images, and field survey data, and finally, the classification accuracy and total accuracy were evaluated through the confusion matrix, and the comprehensive evaluation accuracy reached 93%. The 1-km raster percentage ecosystem type dataset was generated from the 2018 land-use data in terms of the land ecosystem macro-structure classification system and its conversion relationship with the land-use/cover classification system (Liu et al., 2016). Based on the existing data, three national datasets of ecosystem types were built for 2000, 2010, and 2018.

2.3.2 Acquisition and verification of ecosystem quality data

(1) Vegetation coverage (FVC)
Using the MODIS remote sensing product NDVI data with a time resolution of 16 days and a spatial resolution of 250 m from 2000 to 2019, the vegetation cover data with 16 days temporal resolution were calculated by the image dichotomy method after S-G filtering, and then the annual vegetation cover was generated by the maximum synthesis method. The annual vegetation cover was generated by resampling.
(2) Net primary productivity of vegetation (NPP)
The MOD17A3 product of MODIS was directly adopted with a temporal resolution of one year and a spatial resolution of 500 m. The precision of the MODIS NPP data was verified by using the 168 grassland sample biomass data obtained from the field survey accumulated by the research team over the years (Fan et al., 2008) and the productivity data set of China’s typical forest ecosystem derived from the long-term dynamic monitoring database of the China Ecosystem Research Network (CERN), with R2 of 0.75. The vegetation net primary productivity data set with a 1-km resolution was generated by resampling from 2000 to 2019.

2.3.3 Estimation and verification of ecosystem services

(1) Water retention services
The water retention amount of ecological services is calculated by the water balance method, described by:
${{Q}_{wr}}=P-ET-R$
where Qwr is water retention, P is precipitation, ET is actual surface evapotranspiration, and R is surface runoff.
Acquisition of spatial precipitation data: the observed data from the national meteorological stations were interpolated into 1-km resolution spatial data of precipitation using AUNSPLINE software; then they were fused with the 0.25° × 0.25° precipitation raster data provided by the National Meteorological Information Center to generate a 1-km resolution precipitation spatial data set from 2000 to 2019.
Surface runoff was obtained using runoff coefficients multiplied by precipitation for different land-use types and soil types and was calculated using the SCS hydrological model developed by the Soil Conservation Service of the United States Department of Agriculture (Xu et al., 2017).
The calculation of surface evapotranspiration was based on the monthly average temperature and lowest temperature and highest temperature 1-km dataset in China (Peng et al., 2019); the reference crop evapotranspiration was obtained by the Hargreaves calculation formula (Peng et al., 2017). Then, the potential evapotranspiration of different land-use types was obtained by multiplying the evapotranspiration coefficient of different land-use types of FAO (Zhou et al., 2003) by the reference crop evapotranspiration. Finally, the InVEST model was used to convert the potential surface evapotranspiration into the actual evapotranspiration of the surface.
The results of the national water content estimated by simulation in this paper are consistent with the results of Gong et al. (2017), both in order of magnitude and spatial trends, and the forest water content is consistent with the results of Chen et al. (2005) and Lu et al. (2005) in order of magnitude. The simulation results of the Three-river Headwaters Region were further validated by fieldwork, selecting a total of four hydrological stations in the key Three-river Headwaters Region, namely, Tuotuo River, Zhimenda station, Jimai station, and Tangnaihai station, for the years 1990-2018, with mean R2 values above 0.60. The final dataset of water-bearing services at a 1-km resolution for 2000-2019 was generated.
(2) Soil retention services
The soil retention amount in the ecosystem is the difference between the potential soil water erosion amount in the bare soil condition and the soil water erosion amount in the real vegetation condition. The water erosion modulus was the Revised Universal Soil Loss Equation (RUSLE) (Wischmeier et al., 1978), and is described as:
$A={{R}_{{}}}{{\times }_{{}}}{{K}_{{}}}\times L{{S}_{{}}}{{\times }_{{}}}{{C}_{{}}}{{\times }_{{}}}P$
where A is soil water erosion modulus (t·ha-1·a-1); R is the rainfall erosivity factor (M·J·mm·ha-1·h-1·a-1); K is the soil erodibility factor (t·ha·h·ha-1·M·J-1·mm-1); LS is the slope length factor (dimensionless); C is the coverage and management factor (dimensionless), with values ranging from 0 to 1; P is the factor of water and soil retention measures (dimensionless), with values ranging from 0 to 1. The calculation method of the model parameters is detailed in Shao et al. (2018).
The results of the national soil water erosion modulus simulated and estimated in this study were compared and verified with the results of the existing literature (Yuan et al., 2003; Li et al., 2006; Pan et al., 2010), and the results are relatively consistent. After that, the simulation results of the local area of Three-river Headwaters were further validated using the sand content monitoring data from four hydrological stations in the Three-river Headwaters Region, with R2 exceeding 0.55. Finally, a dataset of soil retention services with a 1-km resolution from 2000 to 2019 was generated.
(3) Service volume of wind prevention and sand fixation
The amount of wind protection and sand fixation in the ecosystem is the difference between the potential soil wind erosion under the bare soil condition and the actual soil wind erosion under the actual vegetation condition. The wind erosion modulus was calculated using the modified wind erosion equation (RWEQ) (Fryrear et al., 2000) and is defined as follows:
$SL=\frac{{{Q}_{\text{x}}}}{X}$,
${{Q}_{x}}={{Q}_{max}}\left[ 1-{{e}^{{{\left( \frac{X}{S} \right)}^{2}}}} \right]$,
${{Q}_{max}}=109.8\times (WF\times EF\times SCF\times {K}'\times COG),$
$S=150.71\times {{(WF\times EF\times SCF\times {K}'\times COG)}^{-0.3711}}$
where SL is soil wind erosion modulus (kg·m–2); X is the length of the plot (m); Qx is the sand flux at plot length x (kg·m–1); Qmax is the maximum sediment transport capacity of the wind (kg·m–1); S is the length of the key plot (m); WF is the meteorological factor (kg·m–1); EF is the soil erodibility factor (dimensionless); SCF is soil crust factor (dimensionless); ${K}'$is the soil roughness factor (dimensionless); COG is a comprehensive vegetation factor (dimensionless). The calculation method of model parameters is outlined in Shao et al. (2018)
In this study, the wind erosion modulus estimated by the RWEQ model was compared with the results estimated from the empirical model of wind erosion forecasting based on wind tunnel tests (Cheng et al., 2007) with R2= 0.40. Finally, the dataset of wind and sand control services with a 1-km resolution from 2000-2019 was generated.

2.4 Methods for assessing the degree of ecological restoration and restoration potential of major ecological projects 20 years after implementation

2.4.1 Ecological restoration trend and restoration degree assessment method

The recovery trend is the continuous change trend of a single indicator in two periods. This paper used the least square method to calculate the slope of change (P). Here, p > 0.05 is judged to have improved, -0.05 ≤ p ≤ 0.05 is judged to be basically stable, and p < -0.05 is judged to have worsened; the erosion modulus and wind erosion modulus are the opposite of ecosystem quality (vegetation coverage, net primary productivity of vegetation) and ecosystem services (water retention, soil retention, wind protection, and sand fixation) in the two periods from 2000 to 2010 and 2010 to 2019. The ecological restoration trend of ecosystem quality and ecosystem services from 2000 to 2019 was also judged based on Table 3.
Table 3 Ordinal scale for evaluating the trend of restoration of ecosystem quality and ecosystem services
Judgement basis Judgement result
2000-2010 2010-2019 Overall restoration tendency from 2000 to 2019
Improved Improved Continuously improved
Worsened Worsened Continuously worsened
Basically stable Basically stable Continuously basically stable
Improved Worsened First improved and then worsened
Improved Basically stable First improved and then basically stable
Worsened Improved First worsened and then improved
Worsened Basically stable First worsened and then basically stable
Basically stable Improved First basically stable and then improved
Basically stable Worsened First basically stable and then worsened
The degree of recovery is the level of regional recovery resulting from the superposition of different numbers of indicators in different states (the improving, remaining stable, and or worsening trends). In this paper, five indicators, including the net primary productivity of vegetation, vegetation coverage, water retention, soil water erosion modulus, and the soil wind erosion modulus, were selected, and their spatial slopes of change from 2000 to 2019 were calculated using the Sen method, and significance tests were conducted using the M-K method (Yi et al., 2014). The spatial distribution data of change trends in the three categories of improved, basic stability, and worsed were obtained based on the slope of change of each indicator judgment. The spatial data of change trends of five indicators were analyzed by superposition. The degree of recovery was indicated by the superposition effect of the different number of indicators with different statuses, and the areas with more indicators changing in a positive manner corresponded to the areas with a higher degree of recovery. The spatial distribution of the degree of recovery of the national ecosystem was obtained according to the judgment basis presented in Table 4.
Table 4 Basis for judging the ecological restoration degree
Ecological restoration degree Judgment condition1
Basically remained stable Si ≥ 3
Slightly worsened Si < 3 and Wi = 2
Moderately worsened Si < 3 and Wi = 3
Severely worsened Si < 3 and Wi ≥ 4
Extremely improved ecological restoration degree Bi ≥ 4
Strongly improved ecological restoration degree Bi = 3
Moderately improved ecological restoration degree Si < 3 and Wi < 2 and Bi = 2
Some elements improved while some elements worsened Si < 3 and Wi < 2 and Bi = 1

1 Note: Wi represents the number of indicators that exhibited deterioration, Bi represents the number of indicators that exhibited improvement, Si represents the number of indicators that basically remained stable, and i ≤ 5.

2.4.2 Ecological restoration potential assessment method based on “ecological background at the top of the zone-ecological status-ecological restoration potential”

The restoration potential is the difference between the ecological status quo and the ecological background at the top of the zone. The “zonal apex ecological background” refers to the ecological status of the apex community of the same type of ecosystem located in the same ecogeographic zone as the assessment area. The data of ecological-geographical regions were mainly based on the secondary zoning in the national ecogeographic zoning (Zheng et al., 2008), and the adjacent secondary zoning located in the same primary ecogeographic zoning with small areas were combined to generate an ecogeographic zoning map with 15 zones (Figure 3).
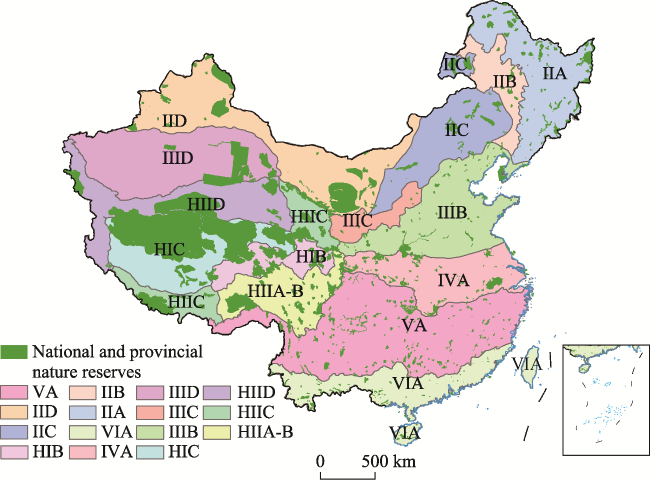
Figure 3 Spatial distribution of ecological-geographical zones and nature reserves in China

VA is middle-subtropical humid zone; IID is middle-temperate arid zone; IIC is middle-temperate and semi-arid zone; IIB is middle-temperate subhumid zone; IIA is middle-temperate humid zone; VIA is south subtropical humid zone; IVA is north subtropical humid zone; IIID is warm-temperate arid zone; IIIC is warm-temperate semi-arid zone; IIIB is warm-temperate subhumid zone; HIC is the sub-cold and semi-arid region of the plateau; HIID is the temperate arid zone of the plateau; HIIC is the temperate semi-arid zone of the plateau; HIIA-B is the temperate humid and subhumid zone of the plateau; HIB is the sub-cold subhumid zone of the plateau.

Note: This map is based on the standard map with approval number GS(2019)1823 downloaded from the standard map service website of the National Bureau of Surveying, Mapping, and Geographic Information, and the base map has not been modified.
In this study, the ecosystems in national and provincial nature reserves are regarded as excellent ecosystems and represent the climax ecological background of the same ecosystem type in the same ecological-geographical area. The national and provincial nature reserves (Figure 3) were obtained from the Earth System Science Data Sharing Network (http://www.geodata.cn/).
The vegetation cover from 2000 to 2019 was overlaid with ecogeographic divisions and nature reserves, and the vegetation cover of forest, grassland, and desert ecosystems within nature reserves in each ecogeographic division was extracted separately to establish binary linear regression equations with temperature and precipitation. To avoid and reduce the errors between those years caused by climate fluctuations, the average temperature and precipitation from 2017 to 2019 were selected for calculation, and the simulated values of the climax vegetation coverage of forest, grassland, and desert ecosystems in this period were obtained. Upon comparison with the vegetation coverage data from 2000 to 2019, if the simulated value of the climax is less than the actual value, the actual value is by replaced the simulated value of the climax, and the final climax background data is obtained.
The average vegetation cover from 2017 to 2019 was taken as the actual value of ecological status, and the top value was subtracted from the actual value to obtain the restoration potential (gap) for calculating vegetation cover. The vegetation cover restoration potential index is then calculated using the following formula.
$EPRI=\left( \frac{E{{R}_{t}}-E{{R}_{c}}}{E{{R}_{t}}} \right)\times 100\%\text{ }$
where ERPI is the ecological restoration potential index of the project area; ERt is the top ecological background value of the zone; ERc is the current value of ecological restoration. The greater the ecological restoration potential index, the greater the ecological restoration potential.

2.5 Determination method of ecological engineering contribution rate to ecosystem change

The influence factors for ecosystem change fall into two main categories: climate and human activities (mainly eco-engineering). We selected the vegetation net primary productivity and soil retention services and used residual analysis (Evans et al., 2004) and model variable control (Gao et al., 2008; Shao et al., 2016; 2018) to determine the contribution of ecological engineering and climate, respectively.
In the residual analysis method, the term residual refers to the difference between the observed and predicted values (fitting values). The multiple regression residual analysis method can separate the impact of climate and human activities on vegetation coverage and can quantitatively reflect the impact of human activities on vegetation coverage.
The model parameter control method applies the estimation equations of ecosystem quality and service quality. The climate parameters (temperature, precipitation, wind speed, etc.) in the equations are controlled to estimate the data of ecosystem services under real climate and fixed climate conditions, respectively. It is generally accepted that the calculation results under real climate conditions are affected by both climate fluctuations and human activities (mainly ecological engineering), while the calculation results under fixed climate conditions are only affected by human activities (mainly ecological engineering).

3 Results

3.1 Spatial and temporal changes in ecosystems in the past 20 years

3.1.1 Analysis of macro-structural changes in ecosystems

In 2018, farmland ecosystems accounted for 18.8% of the land area, forest ecosystems accounted for 23.6%, grassland ecosystems accounted for 31.4%, settlement ecosystems accounted for 2.4%, water and wetland ecosystems accounted for 3.8%, desert ecosystems accounted for 13.4%, and other ecosystems accounted for 6.6%.
In the two time periods from 2000 to 2010 and from 2010 to 2018, the macrostructure of terrestrial ecosystems was generally stable, the area of community ecosystems continued to significantly increase, the area of the grassland, farmland, and desert ecosystems continued to decrease, and the area of forests first increased and then decreased. From 2000 to 2018, the net increase in the area of settlement ecosystems was 5.2 × 10⁴ km2, the net decrease in the area of grassland ecosystems was 2.7 × 10⁴ km2, the net decrease in the area of farmland ecosystems was 1.7 × 10⁴ km2, and the net decrease in the area of desert ecosystems was 1.0 × 10⁴ km2 (Figure 4).
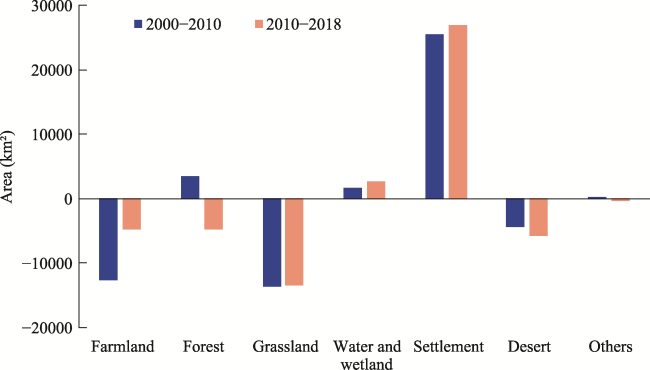
Figure 4 Changes in ecosystem macro structure area in China in two periods (2000-2010 and 2010-2018)

3.1.2 Spatial and temporal changes in ecosystem quality

The average FVC was 53.3% in 2019, higher than the average value of 52.6% in the past 20 years. The FVC showed an overall increasing trend from 2000 to 2019, with an overall stable increase and a local decrease. The areas with increasing FVC were mainly located in the Loess Plateau, Northeast China Plain, Sichuan Basin, and Yunnan-Guizhou Plateau, and the areas with decreasing FVC were mainly located in eastern Inner Mongolia and southeastern Qinghai-Tibet Plateau (Figure 5). The slope of FVC change was tested for significance (p<0.05); the percentage of the areas having a significant decreasing trend and increasing trend was 8.4% and 10.2%, respectively, and the percentage of areas with insignificant trends was 63.8%.
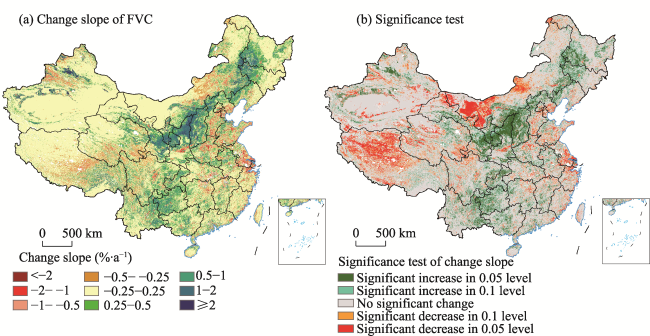
Figure 5 Distribution of changes in the slope of FVC (a) and its significance test (b) in China from 2000 to 2019

Note: This map is based on the standard map with approval number GS(2019)1823 downloaded from the standard map service website of the National Bureau of Surveying, Mapping, and Geographic Information, and the base map has not been modified.

The average vegetation NPP was 353.0 g·C·m-2·a-1 in 2019, which was higher than the average value of 335.2 g·C·m-2·a-1 in the past 20 years. From 2000 to 2019, the average rate of change of vegetation NPP was 2.4 g·C·m-2·a-2, with an overall stable increase and local decrease. The regions with increasing vegetation NPP were mainly distributed in the northern agropastoral mosaic zone region, the eastern Sichuan basin, and the Greater Higgnan Mountains, with the most significant increase in the Loess Plateau region; the decreasing regions were mainly distributed in southern Tibet and Guangdong, Fujian, and Yunnan (Figure 6). Upon testing the slope of NPP of vegetation for statistical significance (p<0.05), the percentage areas with significant decreasing and increasing trends were 0.7% and 29.8%, respectively, and the percentage of areas that demonstrated insignificant trends was 49.7%.
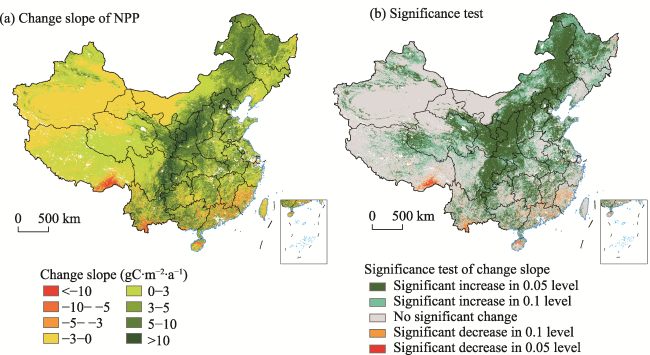
Figure 6 Distribution of changes in the slope of NPP (a) and its significance test (b) in China from 2000 to 2019

Note: This map is based on the standard map with approval number GS(2019)1823 downloaded from the standard map service website of the National Bureau of Surveying, Mapping, and Geographic Information, and the base map has not been modified.

3.1.3 Spatial and temporal changes in ecosystem services

The annual water content of terrestrial ecosystems in 2019 was 1.8 × 10¹² m3·a-1, higher than the average value of the past 20 years (Table 5). From 2000 to 2019, the overall water retention capacity showed a decreasing trend, with roughly half of the area showing increases and the other half showing decreases (Figure 7). The increasing regions are mainly located in the Yangtze River Delta and the Three-river Headwaters Region of Qinghai, while the decreasing regions are mainly located in southern Tibet, the Sichuan Basin, and the Yunnan-Guizhou Plateau. The percentage of areas exhibiting statistically significant (p<0.05) decreasing and increasing trends was 12.6% and 7.9%, respectively, and the percentage of areas with insignificant trends was 71.7%.
Table 5 Annual mean value of ecosystem services in China
Ecosystem service 2000-2010 2010-2019 2000-2019
Water retention Water retention per unit area (m3·ha-1·a-1) 2105.0 2099.1 2083.4
Total amount of water conserved (× 108 m3·a-1) 17979.9 17929.4 17795.7
Soil retention Soil erosion modulus per unit area (t·ha-1·a-1) 14.5 10.9 12.8
Total soil erosion modulus amount (× 108 t·a-1) 103.4 78.1 91.3
Soil retention per unit area (t·ha-1·a-1) 33.0 46.4 39.2
Total amount of soil conserved (× 108 t·a-1) 235.7 331.6 280.0
Windbreak and
sand fixation
Wind erosion modulus per unit area (t·ha-1·a-1) 25.1 17.6 21.5
Total wind erosion modulus amount (× 108 t·a-1) 138.7 96.9 118.8
Windbreak and sand fixation per unit area (t·ha-1·a-1) 24.8 19.8 22.4
Windbreak and sand fixation per unit area (× 108 t·a-1) 137.0 109.5 123.7
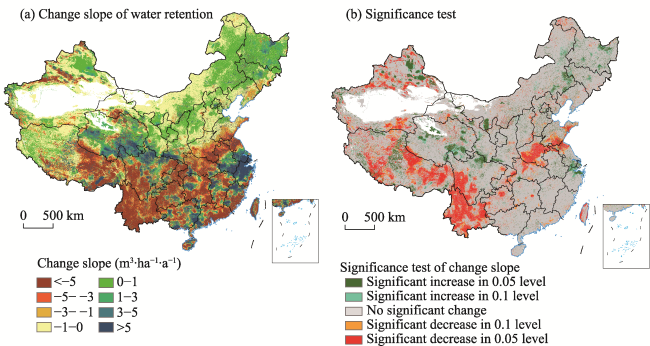
Figure 7 Distribution of the change slope of water retention services (a) and its significance test (b) in China from 2000 to 2019

Note: This map is based on the standard map with approval number GS(2019)1823 downloaded from the standard map service website of the National Bureau of Surveying, Mapping, and Geographic Information, and the base map has not been modified.

The average soil water erosion modulus in the water erosion area was 10.26 t·ha-1·a-1 in 2019, which was lower than the average value of the past 20 years (Table 5), and the soil retention is 371.5 × 10⁸ t·a-1 which was higher than the average value of the most recent 20 years (Table 5). From 2000 to 2019, the soil water erosion modulus showed a decreasing trend with an average change rate of -0.2 t·ha-1·a-1, and the soil retention amount showed an increasing trend with an average change rate of 1.1 t·ha-1·a-1, reflecting the stability and high performance of the soil retention service function of the ecosystem (Figure 8). Upon conducting a significance test on the slope of soil retention change we found that the proportion of areas with statistically significant (p<0.05) decreasing and increasing trends was 0.3% and 34.4%, respectively, and the proportion of areas with insignificant changes was 57.4%.
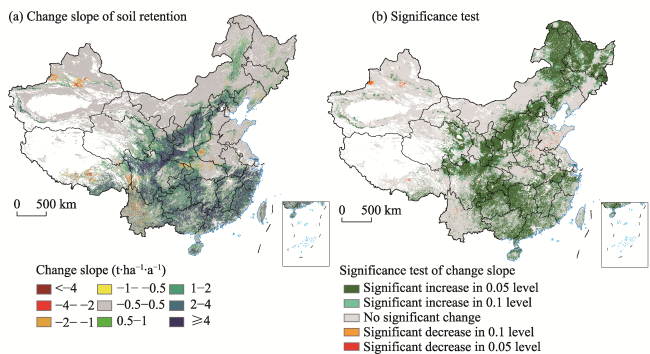
Figure 8 Distribution of changes in the slope of soil retention services (a) and its significance test (b) in China from 2000 to 2019

Note: This map is based on the standard map with approval number GS(2018)1823 downloaded from the standard map service website of the National Bureau of Surveying, Mapping, and Geographic Information, and the base map has not been modified.

The average soil wind erosion modulus in the northern wind-sand region was 16.6 t·ha-1·a-1 in 2019, which was lower than the average value in the past 20 years (Table 5). The amount of windbreak and sand fixation was 128.0 × 10⁸ t·a-1 in 2019, which was higher than the average value of the recent 20 years (Table 5). From 2000 to 2019, the average rate of change of wind erosion modulus in the northern wind-sand region was -1.8 t·ha-1·a-1, and the average rate of change in the amount of wind and sand control was -0.6 t·ha-1·a-1. The wind and sand control service function of the ecosystem in the northern wind and sand area was basically stable, and the difference between the better and worse regions was obvious (Figure 9). A significance test was carried out on the change in the slope of windbreak and sand-fixation, and the percentage of the area with statistically significant (p<0.05) decreasing and increasing trends was 30.4% and 4.8%, respectively, while the percentage of the area with insignificant changes was 57.8%.
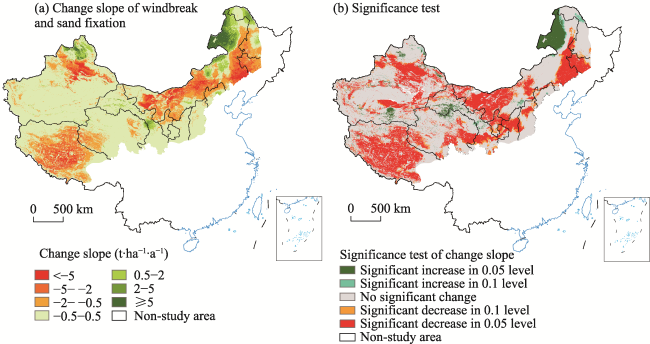
Figure 9 Distribution of the change slope of windbreak and sand fixation services (a) and its significance test (b) in China from 2000 to 2019

Note: This map is based on the standard map with approval number GS(2019)1823 downloaded from the standard map service website of the National Bureau of Surveying, Mapping, and Geographic Information, and the base map has not been modified.

3.2 Ecosystem recovery tendency and recovery degree and the contribution rate of ecological engineering

3.2.1 Ecosystem restoration tendency and spatial difference analysis

(1) Ecosystem quality
Compared with 2000-2010, the average annual maximum FVC increased by 2.2% in 2010-2019. During the two periods, the area where the FVC continuously improved accounted for 11.8%, the area where the FVC remained stable accounted for 36.7%, and the area where the FVC continuously worsened accounted for 4.6% (Table 6). Among these, the areas that have continued to improve were mainly distributed in the northern farming-pastoral ecotone, the Loess Plateau, the Northeast China Plain, the Xinjiang Oasis, and the Yunnan-Guizhou Plateau, and the areas that have continued to deteriorate are mainly distributed in eastern Inner Mongolia and central Tibet (Figure 10a).
Table 6 Statistical analysis of the restoring tendency of ecosystem quality
Recovery tendency The area proportion of different recovery tendencies of FVC (%) The area proportion of different recovery tendencies of NPP (%)
Continuously improving 11.8 32.9
Continuously worsening 4.6 1.5
Remaining stable 36.6 34.3
First improving and then worsening 10.8 6.2
First improving and then remaining stable 9.1 10.9
First worsening and then improving 7.0 4.7
First worsening and then remaining stable 4.6 1.6
First remaining stable and then improving 7.7 6.3
First remaining stable and then worsening 10.8 6.2
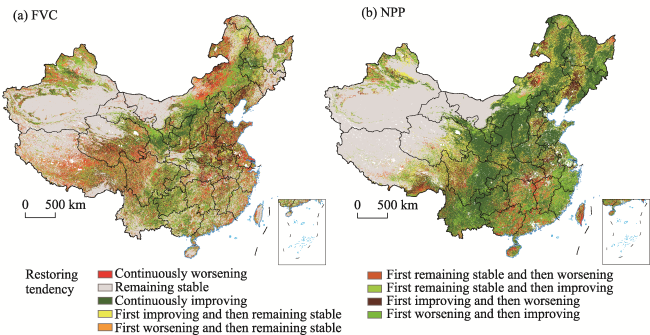
Figure 10 Spatial distribution of restoring tendency of FVC (a) and NPP (b) in China from 2000 to 2019

Note: This map is based on the standard map with approval number GS(2019)1823 downloaded from the standard map service website of the National Bureau of Surveying, Mapping, and Geographic Information, and the base map has not been modified.

The national vegetation NPP increased by 6.8% in 2010-2019 compared with 2000-2010. During the two periods, the area where the vegetation NPP remained stable was the largest, accounting for 34.3%, followed by the area where the vegetation NPP continuously improved, which accounted for 32.9%. The area where the vegetation NPP continuously worsened was only 1.5% (Figure 10b and Table 6).
(2) Ecosystem services
The average annual water retention of terrestrial ecosystems in China decreased slightly in 2010-2019 compared with 2000-2010. During the two periods, the areas where water retention continuously improved accounted for 9.4%, the areas where water retention remained stable accounted for 17.0%, and the areas where water retention continuously worsened accounted for 21.7% (Table 7). Among them, the areas where the water retention service continuously improved were mainly distributed in the Loess Plateau, the eastern part of the Three-river Headwaters Region, and the northern Tianshan Mountains in Xinjiang.
Table 7 Statistical of restoring tendency of ecosystem services
Recovery tendency The area proportion of different recovery tendency of water retention (%) The area proportion of different recovery tendency of soil
retention (%)
The area proportion of different recovery tendency of windbreak and sand fixation (%)
Continuously improving 9.4 5.1 1.4
Continuously worsening 21.7 0.7 13.5
Remaining stable 17.0 74.9 46.5
First improving and then worsening 15.1 2.6 3.6
First improving and then remaining stable 14.2 3.2 0.7
First worsening and then improving 8.1 3.9 17.8
First worsening and then remaining stable 2.6 1.4 6.8
First remaining stable and then improving 8.2 6.9 4.2
First remaining stable and then worsening 3.7 1.3 5.5
The annual soil water erosion modulus in water-eroded areas decreased by 24.5% in 2010-2019 compared with 2000-2010, and the amount of soil retention increased by 40.7%. During the two periods, the area where the soil retention service continuously improved accounted for 5.1%, the area of soil retention service that remained stable accounted for 74.9%, and the area of soil retention service that continuously worsened accounted for 0.7% (Figure 11a and Table 7). Among them, the areas where soil retention service continuously improved were mainly distributed in the Loess Plateau, the junction of Sichuan, Yunnan, Guizhou, Chongqing, and Hunan.
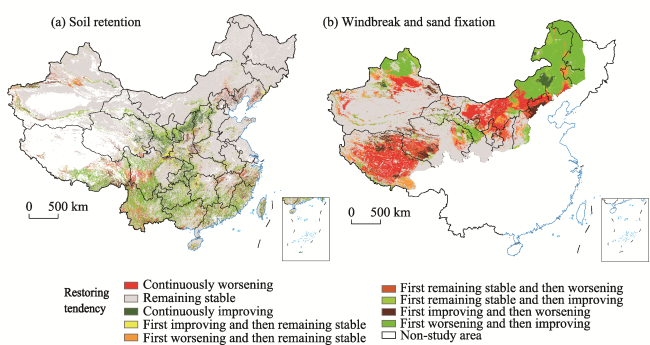
Figure 11 Spatial distribution of restoring tendency of soil retention (a) and windbreak and sand fixation (b) in China from 2000 to 2019

Note: This map is based on the standard map with approval number GS(2019)1823 downloaded from the standard map service website of the National Bureau of Surveying, Mapping, and Geographic Information, and the base map has not been modified.

The annual soil wind erosion modulus in wind-eroded areas decreased by 30.1% in 2010-2019 compared with 2000-2010, and the amount of windbreak and sand fixation decreased by 20.0%. During the two periods, the area of windbreak and sand fixation service which remained stable accounted for 46.5%, the area of windbreak and sand fixation service which continuously worsened accounted for 13.5%, and the area of windbreak and sand fixation service which continuously improved accounted for 1.4% (Figure 11b and Table 7).

3.2.2 Ecosystem restoration degree and spatial difference analysis

Significant spatial differences existed in the degree of ecosystem restoration from 2000 to 2019 (Figure 12 and Table 8). The area with ecosystems that basically remained stable was the largest, accounting for 32.4% of the country’s land area, mainly distributed in the Tarim Basin, Qaidam Basin, and the western part of the Inner Mongolia Plateau. The area with a moderately improved degree of ecological restoration was next, accounting for 21.3%, mainly distributed in the eastern part of Northeast China, northern Xinjiang, the eastern edge of the Qinghai-Tibet Plateau, southwest China, and the Yangtze River Delta region. The area with a strongly improved and an extremely improved degree of ecological restoration were 11.6% and 1.7%, respectively, mainly concentrated in the Loess Plateau, the northern farming-pastoral ecotone, the Northeast China Plain, and the junction of Sichuan, Yunnan, Guizhou, Chongqing, and Hunan. The area with a slightly worsened degree of ecological restoration accounted for 7.8%, and the proportion of the areas with a moderately worsened and a severely worsened degree of ecological restoration were 0.9% and 0.1%, respectively. The areas with worsened degrees of ecological restoration were mainly distributed in the central part of the Qinghai-Tibet Plateau.
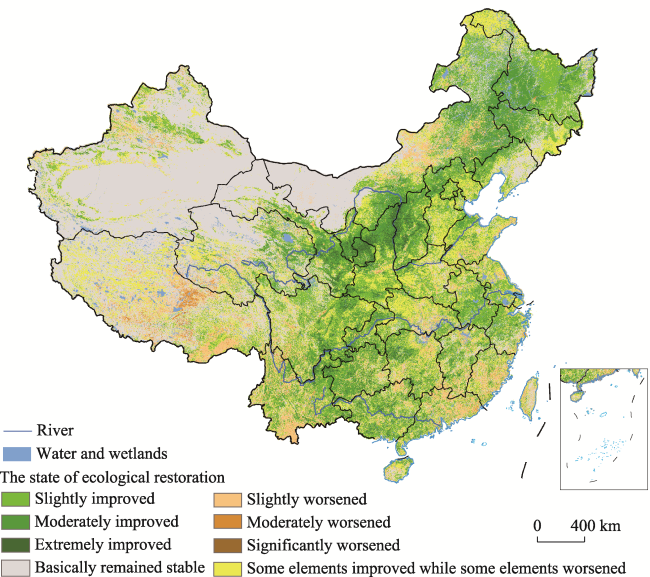
Figure 12 Spatial distribution of the degree of ecosystem restoration in China from 2000 to 2019

Note: This map is based on the standard map with approval number GS(2019)1823 downloaded from the standard map service website of the National Bureau of Surveying, Mapping, and Geographic Information, and the base map has not been modified.

Table 8 Area of different degrees of ecological restoration
Restoration degree Area (×104 km2) Area ratio (%)
Basically remained stable 310.9 32.4
Slightly worsened 74.6 7.8
Moderately worsened 9.0 0.9
Severely worsened 0.5 0.1
Extremely improved ecological restoration degree 16.2 1.7
Strongly improved ecological restoration degree 111.5 11.6
Moderately improved ecological restoration degree 204.1 21.3
Some elements improved while some elements worsened 181.8 18.9

3.2.3 Contribution rate of ecological engineering and climate factors to changes in ecosystem quality and services

The contribution rates of ecological engineering and climate factors to the change in vegetation net primary productivity from 2000 to 2019 were 14.6% and 85.4%, respectively (Table 9). Among them, the contribution rate of ecological engineering to NPP was the highest in the Pearl River Shelterbelt System Construction Project Region, at 24.8%. The contribution rate of ecological engineering to NPP was the lowest in the Returning Rangeland to Grassland Program region, at 10.1%. Climate factors were the main factors for changing vegetation net primary productivity in each ecological engineering area. At the same time, the contribution rates of ecological engineering to the restoration of the vegetation net primary productivity demonstrate significant spatial variations. Among these, the ecological engineering in the Loess Plateau region had the highest contribution rate to the restoration of vegetation net primary productivity, with an average of 24.3%. In some areas of the Loess Plateau, the contribution rate of ecological engineering was as high as 50% or more.
Table 9 Relative contributions of ecological projects and climate to changes in NPP and water erosion modulus from 2000 to 2019
Zone Changes in NPP Changes in the soil erosion modulus
Contribution rate
of ecological
engineering (%)
Contribution
rate of climate (%)
Contribution rate of ecological
engineering (%)
Contribution rate of climate (%)
China 14.6 85.4 30.5 69.5
Three-North Shelterbelt Forest Program region 10.4 89.6 36.9 63.1
Natural Forest Protection Program region 18.7 81.3 27.6 72.4
Beijing-Tianjin Sand Source Control Program region 18.3 81.7 25.6 74.4
Grain for Green Project region 14.0 86.0 31.0 69.0
Returning Rangeland to Grassland Program region 10.1 89.9 36.8 63.2
Karst Rocky Desertification Control Program in Southwest China region 20.8 79.2 20.3 79.7
Yangtze River Shelterbelt Construction
Project region
20.5 79.5 23.8 76.2
Ecological Conservation and Restoration Project in Three-river Headwaters Region 12.5 87.5 26.2 73.8
Pearl River Shelterbelt System Construction Project Region 24.8 75.2 18.0 72.0
The contribution rates of ecological engineering and climate factors to the change of soil water erosion modulus from 2000 to 2019 were 30.5% and 69.5%, respectively (Table 9). The contribution rate of ecological engineering to the change in soil water erosion modulus is highest in the Three-North Shelterbelt Forest Program region, at 36.9%. The contribution rate of ecological engineering to the change of soil water erosion modulus was the lowest in the Pearl River Shelterbelt System Construction Project Region, which is 18.0%.

3.3 Analysis of ecological restoration potential of major ecosystems

From 2017 to 2019, the average FVC of major ecosystems, such as forest, grassland, and desert, decreased from southeast to northwest in space under extreme ecological conditions, with an average vegetation coverage of 40.3% (Figure 13a). There was still a gap of 8.0% between the ideal value and the actual FVC of forest, grassland, and desert, and the percentage of ecological restoration potential was 19.7% (Figure 13b).
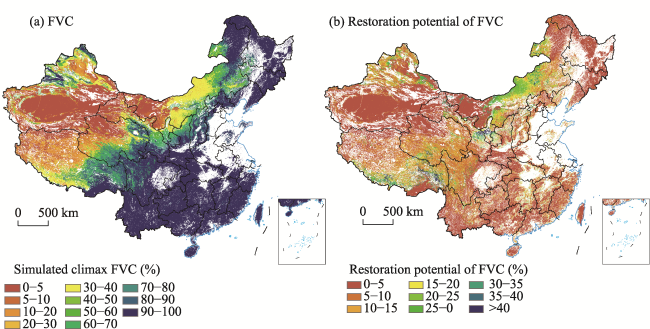
Figure 13 Spatial distribution of FVC under climax ecological conditions (a) and restoration potential of FVC (b) in China from 2017 to 2019

Note: This map is based on the standard map with approval number GS(2019)1823 downloaded from the standard map service website of the National Bureau of Surveying, Mapping, and Geographic Information, and the base map has not been modified.

From 2017 to 2019, the average FVC of the forest ecosystem under extreme ecological conditions was 97.1%. The gap between the ideal value and the actual average FVC of forest in the same period was 6.1%, and the percentage of land with ecological restoration potential was 6.4%.
From 2017 to 2019, the average FVC of the grassland ecosystem under extreme ecological conditions was 53.9%. The gap between the ideal value and the actual average FVC of forest in the same period was 12.4%, and the percentage of land with ecological restoration potential was 23.0%.
From 2017 to 2019, the average FVC of the desert ecosystem under extreme ecological conditions was 6.9%. The gap between the ideal value and the actual average FVC was 3.4%, and the percentage of land with ecological restoration potential was 49.3%.

4 Discussion

Based on the ecological objectives of major ecological engineering planning, we constructed an evaluation index system for the ecological benefits of major ecological projects. When selecting the evaluation indicators, the ease of obtaining data and the convenience of calculating each index were considered. The selected indicators of ecosystem macrostructure, quality, and services were widely used in the comprehensive assessment of ecological benefits of ecological projects at home and abroad (Liu et al., 2018; Kang et al., 2019; Wang et al., 2019; Sun et al., 2022), and the calculation methods of each indicator were also widely used at home and abroad. However, different remote sensing data have certain errors in measurement, scale effect, transmission, and acquisition of remote sensing data we used in the evaluation process, which introduces some uncertainties in the results. The calculation method of recovery potential was also difficult, as it was relatively rough and lacked ground data verification. Subsequent research work should focus on reducing data errors, improving data accuracy, increasing ground data validation, and further improving the assessment results.

4.1 Constraints of climate pattern on ecological restoration

The national average annual temperature and annual precipitation gradually decreased from southeast to northwest from 2000 to 2019, showing obvious horizontal and vertical zonal distribution patterns (Figure 14). By spatially overlaying the national average annual temperature and annual precipitation data with the ecosystem restoration degree data, we analyzed that the places with a high degree of ecosystem restoration are mainly distributed in areas where the average annual temperature is greater than 0°, and the annual precipitation exceeds 300 mm. It showed that the climate pattern had obvious constraints on ecological restoration, and the spatial layout of ecological restoration needs to fully consider the climate pattern.
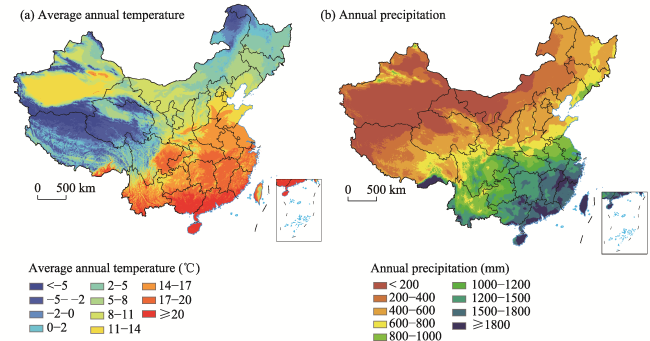
Figure 14 Spatial distribution of the average annual temperature (a) and annual precipitation (b) in China from 2000 to 2019

Note: This map is based on the standard map with approval number GS(2019)1823 downloaded from the standard map service website of the National Bureau of Surveying, Mapping, and Geographic Information, and the base map has not been modified.

In addition, combined with the change trends of average annual temperature and annual precipitation from 2000 to 2019, it was found that in areas with a high degree of ecosystem restoration, the average annual temperature did not rise significantly, and the annual precipitation increased or remained basically unchanged.

4.2 The ecological restoration of the multi-type ecological project superimposed implementation area is generally better than that of a single project implementation area

By superimposing the spatial distribution map of the national ecosystem restoration degree and the regional distribution map of major ecological projects, we obtain statistical data for the area of different degrees of ecological restoration in the superimposed implementation areas of ecological projects in China (Table 10). In the superimposed implementation areas of 5 major ecological projects, the proportion of areas with relatively high or high degrees of ecological restoration was 17.0%. In the superimposed implementation areas of 4 or 3 major ecological projects, the proportion of areas with relatively high or high degrees of ecological restoration accounted for 17.3% and 19.1%, respectively. In areas where less than 3 major ecological projects have been implemented, the proportion of areas with relatively high and high degrees of ecological restoration was less than 11%. The greater the number of major ecological projects implemented, the more comprehensive the implementation of engineering measures and the higher the degree of ecological restoration. For example, major ecological projects such as the Three-North Shelterbelt Forest Program, the Natural Forest Protection Program, the Grain for Green Project, the Returning Rangeland to Grassland Program, and the Beijing-Tianjin Sand Source Control Program have been implemented in the Loess Plateau (Yi et al., 2014). Notably, the Loess Plateau adopted comprehensive restoration measures by combining biological measures and engineering measures, which was the most remarkable area of ecological restoration in China. Although many ecological projects have been implemented in individual areas, such as the central and western regions of the Three-river Headwaters Region in Qinghai, the degree of ecological restoration degree was not ideal; the main reason for this may be the restriction by climate factors. The number of major ecological projects implemented was small, and the ecological restoration measures were relatively singular, so there was a possibility that the degree of ecological restoration was low. For example, only 1 or 2 major ecological projects that focus on rocky desertification control have been deployed. The degree of ecological restoration in southwest Yunnan was also low (Gu et al., 2009). At the same time, the deployment of major ecological projects in some areas was relatively scattered, and it may be difficult to realize comprehensive benefits.
Table 10 Statistics of the degree of ecological restoration in the ecological project overlay implementation area (×104 km²)
Number of implemented projects (pieces) Basically remained stable Slightly worsened Moderately worsened Severely worsened Extremely improved
ecological
restoration degree
Strongly
improved
ecological restoration degree
Moderately improved ecological restoration degree Some elements improved, while some elements
worsened
0 4.3 6.2 0.7 0 0.2 2.9 8.8 9.5
1 9.8 10.9 1.0 0.1 1.0 7.1 22.3 22.5
2 115.5 21.9 3.1 0.1 1.6 16.2 44.3 59.7
3 108.7 21.5 2.4 0.1 8.6 52.9 77.3 50.0
4 55.0 8.9 1.3 0.1 4.1 23.8 40.0 28.1
5 17.0 5.3 0.7 0.1 0.8 8.5 11.2 11.4

4.3 The spatial differences in ecological restoration

There were large spatial differences in the degree of ecological restoration in the 20 years since the implementation of major ecological projects. Areas with a high degree of ecological restoration accounted for 13.3% of China’s land area and were mainly concentrated in the Loess Plateau, the farming-pastoral zone of northern China, the Northeast China Plain, and an area spanning the border areas of Sichuan, Yunnan, Guizhou, Chongqing, and Hunan. However, there were still some areas where ecological restoration was obviously not enough; these areas were mainly distributed in the central part of the Qinghai-Tibet Plateau, the central part of Inner Mongolia, and southern Yunnan. The reasons for the large spatial differences were mainly related to climatic factors and human activities. From 1990 to 2000, a large area of grasslands was converted to farmland in the northern farming-pastoral ecotone, the Loess Plateau, and the Northeast China Plain, while there were large areas of forests. The conversion of grasslands to cultivated land (Liu et al., 2014) and reclamation activities negatively impacted the ecosystem. From 2000 to 2010, large areas of cultivated land were transformed into forests and grasslands in Inner Mongolia’s farming-pastoral ecotone, the Loess Plateau, Yunnan-Guizhou, and Northeast China. From 2010 to 2015, the conversion of large areas of cultivated land into forests and grasslands continued (Liu et al., 2018). These areas were the main locations of sloping cultivated land between 15 and 25 degrees and greater than 25 degrees in China and were also the areas where the Grain for Green (Grassland) Project was implemented in 2000. The regional distribution was basically the same, and the conversion of farmland activities significantly promoted the restoration of local ecosystems. These regional distributions were basically consistent with the regional distributions of relatively high and high degrees of ecosystem restoration, and the activities of returning farmland had a significant role in promoting the restoration of local ecosystems.
Therefore, the deployment of major ecological projects should fully consider the limitations of climatic conditions. For areas with annual precipitation below 300 mm and average annual temperature below 0℃, artificial ecological restoration measures should be avoided as much as possible to reduce human disturbances and promote natural ecological restoration. In ecologically fragile areas, ecological barrier areas, and important ecological function areas where the annual precipitation is greater than 300 mm and the average annual temperature is greater than 0 ℃, the comprehensive management of mountains, rivers, forests, fields, lakes, grass, and sand should be further promoted, and single ecological projects or single ecological restoration measures should be avoided giving full consideration to the comprehensive effect of ecological engineering combined with measures that improve the maximum benefit of ecological investment funds. However, in areas with fragile ecology and relatively lagging economic development, the contradiction between ecological protection and resource utilization remains prominent. This is mainly due to the lagging economic and social development, single production modes, and lack of endogenous motivation for industrial transformation in these regions. It is urgent to explore a new mode of synergistic promotion of comprehensive ecologic environmental management and regional revitalization and development that treats both the symptoms and root causes. It is necessary to innovate and build a comprehensive governance system that coordinates the promotion of ecological protection and restoration, economic and social transformation and development, and establish a long-term ecological compensation mechanism. By implementing a series of comprehensive governance measures, the win-win combination of high-quality economic and social regional development and the improvement in the quality and efficiency of “clear waters and green mountains” will be realized.

5 Conclusions

This paper quantitatively evaluates the ecological benefits of China’s major ecological projects in the past 20 years. The main conclusions were as follows:
(1) From 2000 to 2018, the area of national settlement ecosystems increased by 5.2 × 10⁴ km2, the area of grassland, farmland, and desert ecosystems decreased by 2.7 × 10⁴ km2, 1.7 × 10⁴ km2, and 1.0 × 10⁴ km2, respectively, and the area and macrostructure of other ecosystems were generally stable. The area of other ecosystems did not change much, and the macrostructure of the ecosystem was generally stable.
(2) From 2000 to 2019, the ecosystem quality and service functions were generally improving stably, while some areas were getting worse. The FVC and NPP have generally increased steadily, with some exceptions. The area of increased water retention service accounted for half. The soil retention service of the ecosystems was stable and improving. The windbreak and sand fixation service of the ecosystems in the northern sandstorm area was basically stable, and there were obvious differences between the improving and the worsening areas.
(3) The ecological benefit of ecological engineering was good. During the two periods of 2000-2010 and 2010-2019, the area where the quality of the ecosystem continued to be stable and improved was relatively large. From 2000 to 2019, the areas with medium, relatively high, and high degrees of ecological restoration accounted for 24.1%, 11.9%, and 1.7% of the national land area, respectively. The regions with relatively high and high degrees of ecological restoration were mainly concentrated in the Loess Plateau, the northern agropastoral ecotone, the Northeast China Plain, and the junction of Sichuan, Yunnan, Guizhou, Chongqing, and Hunan.
(4) Climate was the dominant factor driving changes in ecosystem quality and services. From 2000 to 2019, climate contributed 85.4% to changes in vegetation net primary productivity and 69.5% to changes in soil water erosion modulus in China. The contribution rate of ecological engineering to the change of vegetation net primary productivity was 14.6%, and the contribution rate to the change of soil water erosion modulus was 30.5%. The contribution rate of ecological engineering to the change of the vegetation net primary productivity significantly varied.
(5) The FVC had a restoration potential of 20%, and the difference was obvious among different ecosystem types. There was still a gap of 8.0% between the ideal value and the actual FVC of forest, grassland, and desert, and the percentage of ecological restoration potential was 19.7%. Among them, the gap in forest vegetation coverage was 6.1%, and the restoration potential percentage was 6.4%. The gap in grassland vegetation coverage was 12.4%, and the restoration potential percentage was 23.0%.

Acknowledgments

In the process of researching and writing the thesis, we have received guidance and help from Academician Fu Bojie, Academician Lu Daodao, Academician Wang Qiao, Professor Shu Jianmin, Professor Lu Qi, Professor Zeng Lan, Professor Gong Huili, Professor Yang Xueqing, Professor Liu Qinhuo, Professor Yan Xiaodong, Professor Pang Yong, Professor He Shujin, Professor Hou Peng, Professor Liu Hui, Professor Du Yunyan and other experts, and hereby express our heartfelt gratitude!
[1]
Bǒrner J, Baylis K, Corbera E et al., 2016. Emerging evidence on the effectiveness of tropical forest conservation. PLoS ONE, 11(11): 0159152.

[2]
Cai D W, Ge Q S, Wang X M et al., 2020. Contributions of ecological programs to vegetation restoration in arid and semiarid China. Environmental Research Letters, 15(11): 114046.

DOI

[3]
Chen D L, Yu X X, Liao B H, 2005. Analysis on the function of conservation water of the Chinese forest ecosystem. World Forestry Research, 18(1): 49-54. (in Chinese)

[4]
Cheng H, Zou X Y, Zhang C L, 2007. A study on the relationship between friction wind velocity and mean wind velocity. Research of Soil and Water Conservation, 14(2): 133-138. (in Chinese)

[5]
Euliss N H, Smith L M, Liu S G et al., 2011. Integrating estimates of ecosystem services from conservation programs and practices into models for decision makers. Ecological Applications, 21(3): S128-S134.

DOI

[6]
Evans J, Roland G, 2004. Discrimination between climate and human-induced dryland degradation. Journal of Arid Environment, 57: 535-554.

DOI

[7]
Fan J W, Zhong H P, Harris W et al., 2008. Carbon storage in the grasslands of China based on field measurements of above- and below-ground biomass. Climatic Change, 86: 375-396.

DOI

[8]
Fryrear D F, Bilbro J D, Saleh A et al., 2000. RWEQ: Improved wind erosion technology. Journal of Soil and Water Conservation, 55(2): 183-189.

[9]
Gao S Y, Zhang C L, Zou X Y et al., 2008. Benefits of Beijing-Tianjin Sand Source Control Engineering. Beijing: Science Press. (in Chinese)

[10]
Gong S H, Xiao Y, Zheng H et al., 2017. Spatial patterns of ecosystem water conservation in China and its impact factors analysis. Acta Ecologica Sinica, 37(7): 1-8. (in Chinese)

DOI

[11]
Gu Y, Chen F, Li K et al., 2009. Ecological control of land rocky desertification and vegetation recovery in karst region of Yunnan province. Science and Technology Review, 27(5): 75-80. (in Chinese)

[12]
Holt R F, 2001. Strategic Ecological Restoration Assessment (SERA) of the Kamloops Forest Region[EB/OL]. [2021-12-23]. British Columbia, Canada. Pandion Ecological Research Ltd., http://www.env.gov.bc.ca/wld/documents/Kamloops.pdf.

[13]
Huang L, Zhu P, Xiao T et al., 2018. The sand fixation effects of Three-North Shelter Forest Program in recent 35 years. Scientia Geographica Sinica, 38(4): 600-609. (in Chinese)

DOI

[14]
Kang T T, Li Z, Gao Y C, 2019. Effectiveness of ecological restoration in the mountain-oasis-desert system of northwestern arid area of China. Acta Ecologica Sinica, 39(20): 7418-7431. (in Chinese)

[15]
Li Z G, Liu B Z, 2006. Calculation on soil erosion amount of main river basin in China. Science of Soil and Water Conservation, 4(2): 1-6. (in Chinese)

[16]
Liu G B, Shangguan Z P, Yao W Y et al., 2017. Ecological effects of soil conservation in Loess Plateau. Bulletin of Chinese Academy of Sciences, 32(1): 11-19. (in Chinese)

[17]
Liu J Y, Kuang W H, Zhang Z X et al., 2014. Spatiotemporal characteristics, patterns and causes of land use changes in China since the late 1980s. Acta Geographica Sinica, 69(1): 3-14. (in Chinese)

DOI

[18]
Liu J Y, Ning J, Kuang W H et al., 2018. Spatio-temporal patterns and characteristics of land-use change in China during 2010-2015. Acta Geographica Sinica, 73(5): 789-802. (in Chinese)

DOI

[19]
Liu J Y, Shao Q Q, Yu X B et al., 2016. Integrated Monitoring and Assessment of Terrestrial Ecosystems in China. Beijing: Science Press. (in Chinese)

[20]
Liu J Y, Yue T X, Ju H B et al., 2006. Integrated Ecosystem Assessment in Western China. Beijing: China Meteorological Press. (in Chinese)

[21]
Liu S T, Niu X, Wang B et al., 2018. An ecological benefit assessment of the Grain for Green Project in Shaanxi province. Acta Ecologica Sinica, 38(16): 5759-5770. (in Chinese)

[22]
Lu S W, Mao F L, Jin F et al., 2005. The water resource conservation of forest ecosystem in China. Research of Soil Water Conservation, 12(4): 223-226. (in Chinese)

[23]
Millennium Ecosystem Assessment MEA, 2003. Ecosystems and Human Well-being. Washington DC: Island Press.

[24]
Ouyang Z Y, Zheng H, Xiao Y et al., 2016. Improvements in ecosystem services from investments in natural capital. Science, 352(6292): 1455-1459.

DOI PMID

[25]
Pan M H, Wu Y Q, Ren F P et al., 2010. Estimating soil erosion in the Dongjiang river basin based on USLE. Journal of Natural Resources, 25(12): 2155-2164. (in Chinese)

[26]
Peng S Z, Ding Y X, Liu W Z et al., 2019. 1 km monthly temperature and precipitation dataset for China from 1901 to 2017. Earth System Science Data, 11: 1931-1946.

DOI

[27]
Peng S Z, Ding Y X, Wen Z M et al., 2017. Spatiotemporal change and trend analysis of potential evapotranspiration over the Loess Plateau of China during 2011-2100. Agricultural and Forest Meteorology, 233: 183-194.

[28]
Rojo L, Bautista S, Orr B J et al., 2012. Prevention and restoration actions to combat desertification an integrated assessment: The practice project. Sécheresse, 23(3): 219-226.

DOI

[29]
Shao Q Q, Fan J W, 2018. Monitoring and Evaluating the Ecological Benefits of the First-stage Ecological Conservation and Restoration Project in Sanjiangyuan Region. Beijing: Science Press. (in Chinese)

[30]
Shao Q Q, Fan J W, Liu J Y et al., 2016. Assessment on the effects of the first-stage ecological conservation and restoration project in Sanjiangyuan region. Acta Geographica Sinica, 71(1): 3-20. (in Chinese)

DOI

[31]
Shao Q Q, Fan J W, Liu J Y et al., 2017. Approaches for monitoring and assessment of ecological benefits of national key ecological projects. Advances in Earth Science, 32(11): 1174-1182. (in Chinese)

DOI

[32]
Sun Z X, Li W Y, Liu J M et al., 2022. Evaluation of comprehensive benefit for ecological restoration in Shanxi Province. Acta Ecologica Sinica, 42(7): 1-12. (in Chinese)

[33]
Wang Z Z, Wang H, Feng X M et al., 2019. Evaluation index system of comprehensive benefits of ecological restoration in key ecologically vulnerable regions. Acta Ecologica Sinica, 39(20): 7356-7366. (in Chinese)

[34]
Wischmeier W H, Smith D D, 1978. Predicting Rainfall Erosion Losses. A Guide to Conservation Planning. U.S. Department of Agriculture: Washington, DC, USA.

[35]
Wu D, Gong G L, Shao Q Q et al., 2016. Ecological effects assessment of Beijing and Tianjin sandstorm source control project. Journal of Arid Land Resources and Environment, 30(11): 117-123. (in Chinese)

[36]
Xu S, Zhang Y Y, Dou M et al., 2017. Spatial distribution of land use change in the Yangtze River Basin and the impact on runoff. Progress in Geography, 36(4): 426-436. (in Chinese)

DOI

[37]
Yi L, Ren Z Y, Zhang C et al., 2014. Vegetation cover, climate and human activities on the Loess Plateau. Resources Science, 36(1): 166-174. (in Chinese)

[38]
Yuan M C, Lang N J, Wen S L et al., 2003. Soil and water loss and countermeasures in Yunnan province. Bulletin of Soil and Water Conservation, 23(2): 60-63. (in Chinese)

[39]
Zheng D, 2008. Study on Eco-geographical Regional System in China. Beijing: The Commercial Press. (in Chinese)

[40]
Zhou W Z, Liu G H, Pan J J, 2003. Soil available water capacity and it is empirical and statistical models. Journal of Arid Land Resources and Environment, 17(4): 88-95. (in Chinese)

Outlines

/