Special Issue: Land for High-quality Development

Multi-scale coupling analysis of urbanization and ecosystem services supply-demand budget in the Beijing-Tianjin-Hebei region, China

  • ZHANG Fan , 1 ,
  • XU Ning 1 ,
  • WANG Chao 2 ,
  • GUO Mingjing , 3, 4, 5, * ,
  • Pankaj KUMAR 6
Expand
  • 1. Key Laboratory of Land Surface Pattern and Simulation, Institute of Geographic Sciences and Natural Resources Research, CAS, Beijing 100101, China
  • 2. State Key Laboratory of Water Environment Simulation, School of Environment, Beijing Normal University, Beijing 100875, China
  • 3. School of Economics and Management, China University of Geosciences, Wuhan 430074, China
  • 4. Key Laboratory of Land and Resources Strategy Research, Ministry of Natural Resources of the People’s Republic of China, Beijing 100812, China
  • 5. Research Center of Resource and Environmental Economics, China University of Geosciences, Wuhan 430074, China
  • 6. Department of Geography, Delhi School of Economics, University of Delhi, New Delhi 110021, India
*Guo Mingjing (1978-), Associate Professor, specialized in resource management and regional sustainable development. E-mail:

Zhang Fan (1989-), Associate Professor, specialized in environmental and ecological management. E-mail:

Received date: 2021-07-29

  Accepted date: 2022-02-21

  Online published: 2023-02-21

Supported by

National Natural Science Foundation of China(72004215)

Copyright

© 2023

Abstract

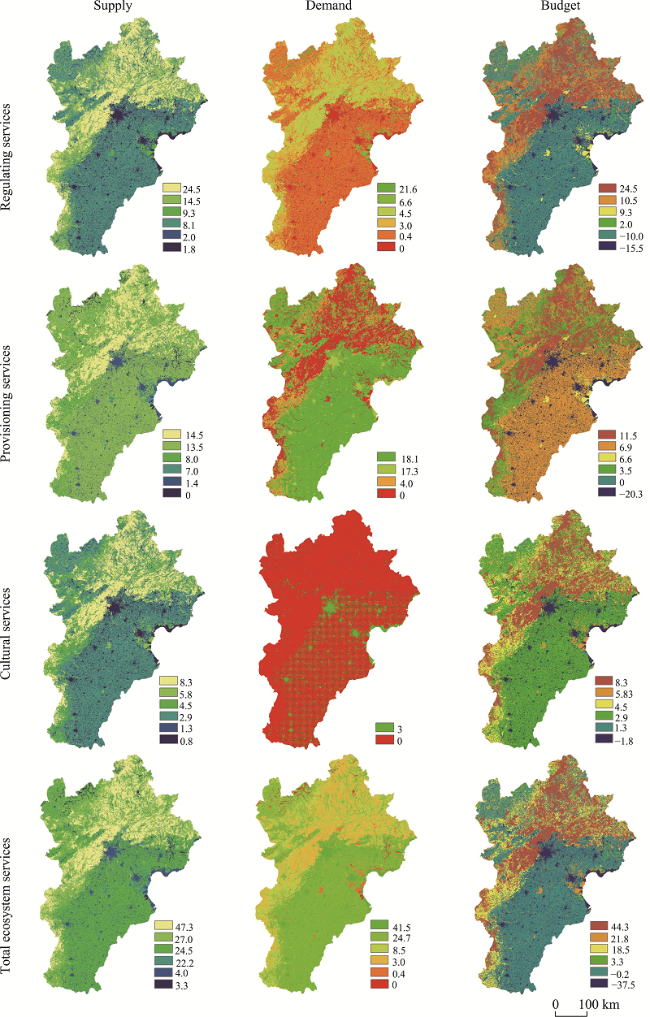
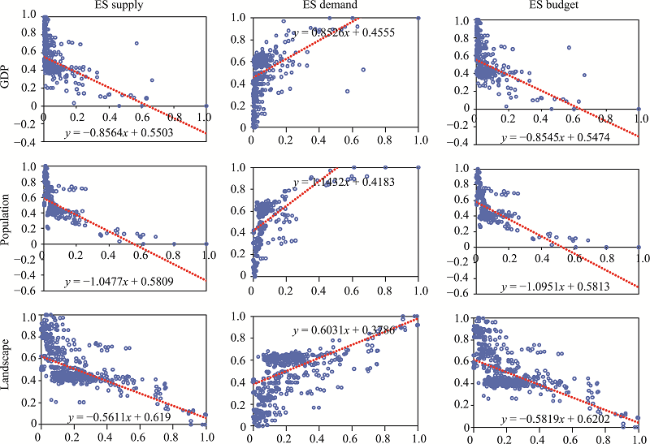
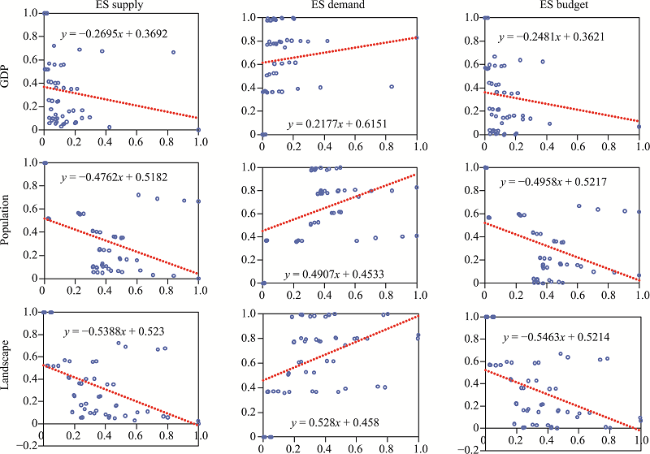
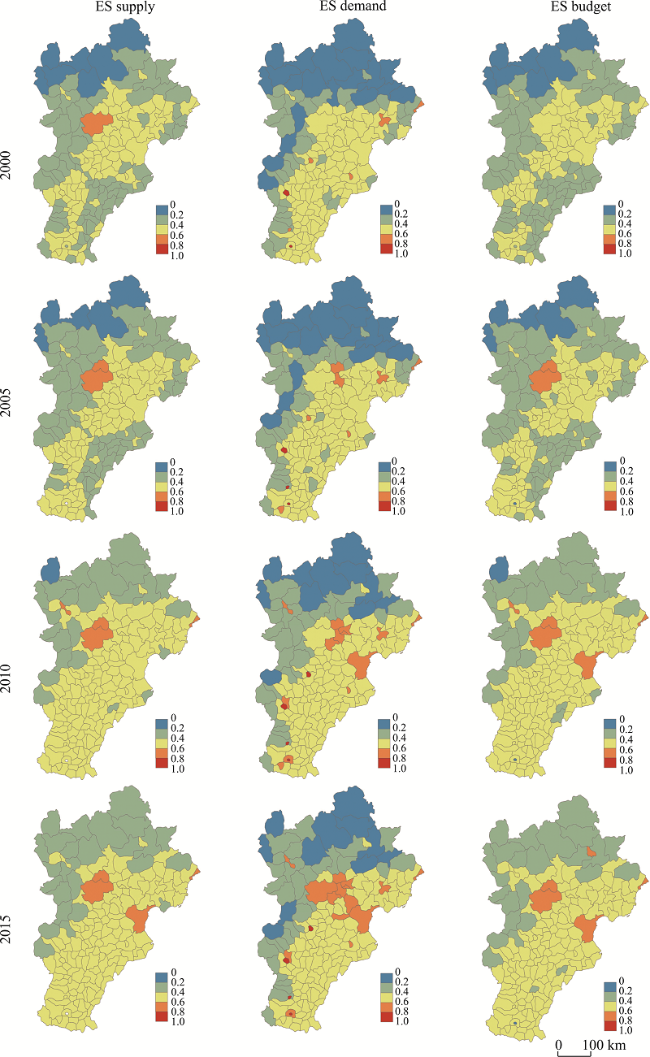
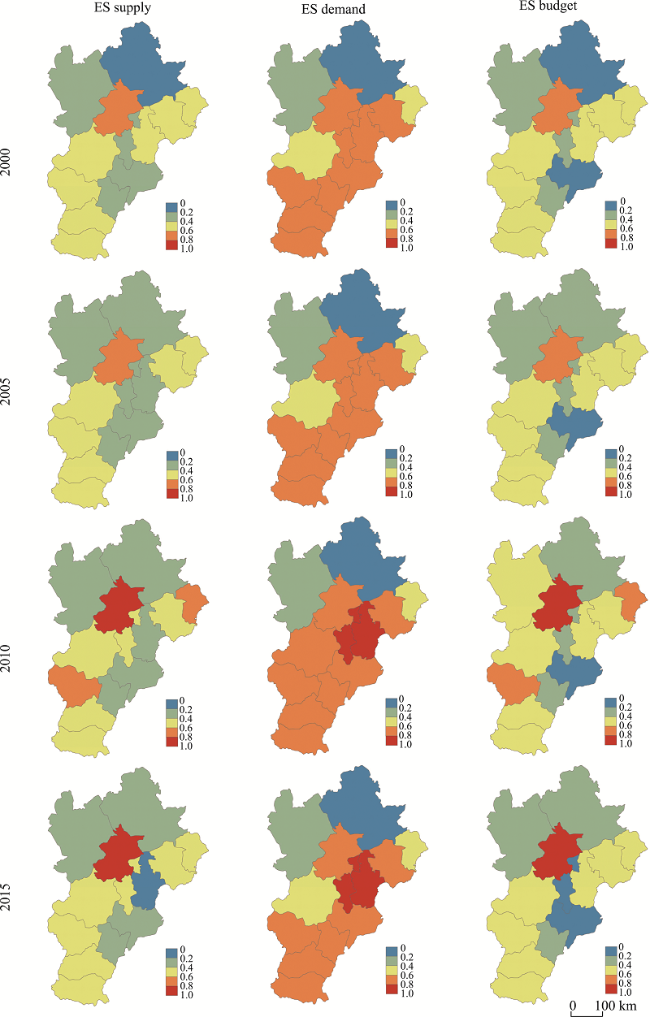
Rapid economic development and human activities have severely affected ecosystem function. Analysis of the spatial distribution of areas of rapid urbanization is the basis for optimizing urban-ecological spatial design. This paper evaluated the spatial distribution of urbanization in the Beijing-Tianjin-Hebei (BTH) region, and then quantified the ecosystem services (ES) budget in the region based on an ES supply and demand matrix. The results showed that (1) urbanization patterns in the BTH region were relatively stable from 2000 to 2015, with clear patterns of low levels of urbanization in the northwest and high levels in the southeast; (2) areas with positive ES budget values were found throughout the region, except in built-up areas, with high ES supply areas concentrated in the northwest, and high ES demand areas in the southeast; (3) at both the county and prefecture-city levels, urbanization had negative, positive, and negative correlations with ES supply, demand, and budget, respectively; (4) the coupling coordination degree (CCD) increased, with high CCD values in the southeast. Based on these results, policy recommendations include strengthening rational land-use planning and ecosystem management, promoting the coordinated development of the economy and ecological function, and coordinating the provision of production-life- ecological functions.

Cite this article

ZHANG Fan , XU Ning , WANG Chao , GUO Mingjing , Pankaj KUMAR . Multi-scale coupling analysis of urbanization and ecosystem services supply-demand budget in the Beijing-Tianjin-Hebei region, China[J]. Journal of Geographical Sciences, 2023 , 33(2) : 340 -356 . DOI: 10.1007/s11442-023-2085-y

1 Introduction

Ecosystem services (ES) are the products and services that humans can directly or indirectly obtain from ecosystem structure, function, and processes (Costanza et al., 1997). The Millennium Ecosystem Assessment (MEA, 2005) states that ES include supporting, regulating, provisioning, and cultural services, and reports that more than half of ecosystems have experienced degradation as a result of human activities. Since the beginning of the 21st century, more than half of the world’s population has been living in urban areas, and the process of global urbanization is accelerating (Chen et al., 2019; Wang et al., 2020). Urbanization promotes the rapid development of society, economy, and culture, but also leads to environmental problems, such as a shortage of cultivable land and destruction of ecosystem function. Such changes can lead to challenges in resource utilization and environmental protection (Liu et al., 2017; Liu et al., 2020; Wiederkehr et al., 2020). In China, land use is constantly being converted by construction, and ecosystem imbalance occurs frequently (Peng et al., 2020). In this context, assessment of ES in relation to urbanization is an effective tool to support decision-making processes for sustainable land use. This approach has important practical significance for coordinating regional sustainable development, optimizing land-use planning, and ensuring ecological security.
With the rapid progression of urbanization and economization, landscapes have undergone significant changes. Consequently, there is an urgent need to analyze the effects of urbanization on ES (Wu et al., 2019). Previous studies have used statistical indicators (Schrandt et al., 2021) and spatial econometric models (Wang et al., 2021) to explore the relationships between urbanization and ES and diverse relationships have been found, including negative (Aguilera et al., 2020), positive (Deng et al., 2021), and non-linear correlations (Peng et al., 2017). In addition, the degree of spatial coupling between urbanization and ES is generally low (Zhou et al., 2017; Cui et al., 2019). Most researchers have analyzed these relationships using only a single dimension of urbanization. Few studies have attempted to comprehensively examine the coupling and coordination of relationships between urbanization and ES from multiple dimensions.
From the perspectives of production and consumption, ES can be divided into two aspects: supply and demand (Uthes and Matzdorf, 2016). Specifically, ES supply refers to the ability of ecosystems to provide products and services for humans; ES demand refers to the sum of ecosystem products and services used by humans. Previous studies have mainly focused on changes in ES supply in relation to urbanization (Galcía-Nieto et al., 2018), and there is little discussion of the relationships between urbanization and ES demand. An exploration of the overall effects of urbanization on ES is needed.
The ES supply-demand budget reflects the balance between natural and human socio-economic systems (Peng et al., 2022). In recent years, research on ES supply-demand budgets has emerged. Uthes and Matzdorf (2016) measured ES supply and demand using questionnaires and an optimization method to explore the government budget allocation in rural Germany. Bukvareva et al. (2017) established a comprehensive index to evaluate the ES of air and water purification in Russia, which shows the practicability of this method in estimating inter-regional ES budgets. Ala-Hulkko et al. (2019) used spatial accessibility analysis to measure crop supply and demand in the European Union, considering cultivated land types and population density. Burkhard et al. (2012) developed an ES matrix model to calculate ES supply, demand, and overall budget, based on the potential impact of land use/cover change (LUCC) on ES and an expert scoring method. The ES matrix model has been widely used in studies of ES supply-demand budgets. Tao et al. (2018), Guan et al. (2020), and Sun et al. (2020) have verified that the method can quickly and effectively evaluate ES supply and demand under LUCC and encourage spatial visualization. While there is a wealth of research on ES supply-demand budgets, few studies have addressed the long-term dynamics of ES budgets in a comprehensive way (Pang et al., 2017). There is an urgent need to use long-term time series data to explore ES in different areas.
The Beijing-Tianjin-Hebei (BTH) region is the capital economic center of China, as well as an important ecological barrier of the North China Plain. As a result of grassland ecosystem degradation and desertification, ecosystem services and the ecological carrying capacity of the BTH region are low (Zhou et al., 2021). With rapid urbanization, the BTH region has become one of the areas in China with the greatest pressure on natural resources and the environment (Chu et al., 2017; Wang et al., 2021). Ecological protection and restoration have become core issues in the coordinated development of the BTH region (Zhao et al., 2018). It is urgent, therefore, to understand the influence of urbanization on ES and formulate a reasonable urbanization development strategy.
To address this need of the BTH region and meet the research gap of coordinated analysis between urbanization and ES, we evaluated the ES supply, demand, and supply-demand budget using an ES matrix model. The spatio-temporal evolution of urbanization and ES in the BTH region from 2000 to 2015 were analyzed. A coupling coordination degree (CCD) model was used to analyze the relationships between urbanization and ES. The results can provide a reference for decision-makers in terms of ecological protection and sustainable development in BTH and other similar areas.

2 Methods and materials

2.1 Study area

The BTH region is located in the northern part of the North China Plain (36°05′N-42°40′N, 113°27′E-119°50′E) (Figure 1). The provincial administrative units include Beijing, Tianjin, and Hebei. The area is about 21.8 × 10⁴ km2, accounting for 2.3% of China’s land area. At the end of 2019, the population was 113 million, and the regional GDP was 8.46 × 10¹⁶ yuan, accounting for 8.80% and 8.58% of national totals, respectively. There is significant spatial variation in the topography of the BTH region; the northwestern part has high elevation, while the southeastern part is low. The region includes a variety of geomorphic types. Grasslands, basins, and mountains are common in the north and northwest. The eastern region is dominated by mountains and hills. Due to its proximity to the Bohai Bay, the western region is dominated by wetlands and the central and southern regions are dominated by plains. The area has a warm temperate continental monsoon climate and the period from mid-April to late September is a major rainy season.
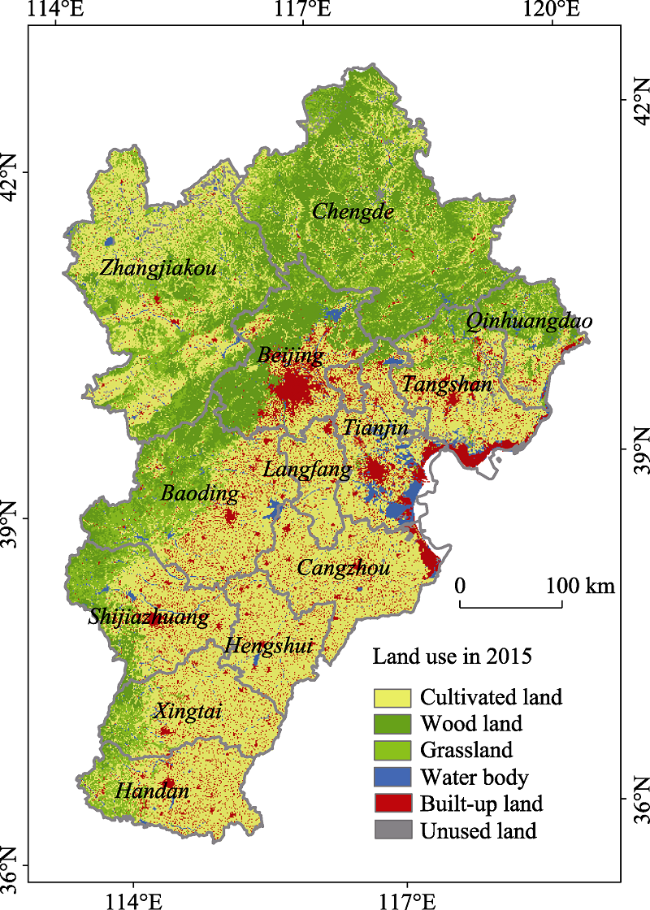
Figure 1 Geographical location and land use of the Beijing-Tianjin-Hebei region

2.2 Methods

This study conducts the study according to the framework as shown in Figure 2. Firstly, we prepared the data including land use/cover data, social-economic data and night lighting data.
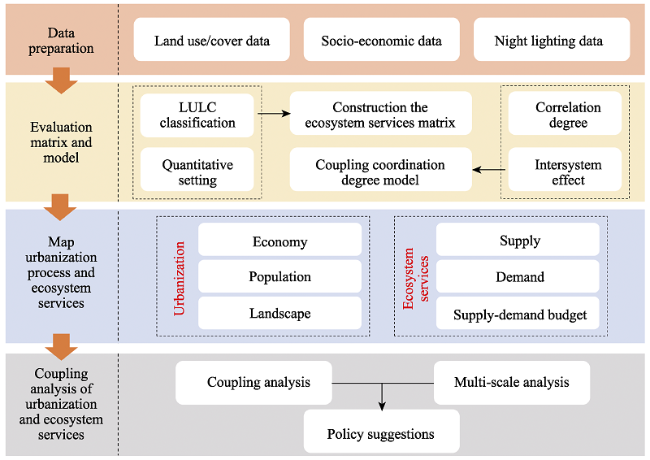
Figure 2 The overall framework of this study
Secondly, we analyzed the ecosystem services matrix and coupling degree model. Then, we mapped the urbanization process and ecosystem services. Finally, we carried out the multi-scale coupling analysis of urbanization and ecosystem services in the BTH region.

2.2.1 Urbanization indices

Urbanization is multi-dimensional and includes a series of complex evolutionary processes, such as population migration, urban land expansion, industrial structure adjustment, capital agglomeration, and a change in consumption habits (Inostroza and Zepp, 2021). Typically, single-dimension indices such as LUCC (Zhou and Chen, 2018), population urbanization rate (Yuan et al., 2018), or nighttime lighting data (Wang et al., 2020) are used to measure the level of urbanization. However, these metrics do not provide an overarching picture of the characteristics and level of urbanization.
Referring to the existing research (Dadashpoor et al., 2019; Bian et al., 2021), this study comprehensively characterized urbanization using three dimensions. First, economic urbanization refers to the flow of capital and technology from rural areas to cities. This study uses regional GDP to represent economic urbanization. Second, population urbanization is the process of regional human capital accumulation and this paper used population density to characterize population urbanization. Third, landscape urbanization refers to the gradual expansion of urban land to cover the regional space. The digital number (DN) for nighttime light intensity was used to reflect regional patterns of landscape urbanization (Dakhlia et al., 2021).

2.2.2 Ecosystem service supply-demand budget

This paper established ES bundles suitable for the BTH region. Specifically, the ES bundles included nine regulating services (local climate regulation, global climate regulation, flood protection, groundwater recharge, air quality regulation, erosion regulation, nutrient regulation, water purification, and pollination), eleven provisioning services (crops, livestock, fodder, capture fisheries, aquaculture, wild foods, timber, wood fuel, energy (biomass), biochemicals/medicine, and freshwater) and two cultural services (recreational and aesthetic values, intrinsic value of biodiversity) (Peng et al., 2020). Based on the above, ecosystem service types and six land use/cover types were combined in ES supply, demand, and budget matrix tables (Figure 3). Each matrix table comprised 132 subunits and 18 summative units. The initial values of the ES supply and demand matrix elements were determined with reference to the research of Burkhard et al. (2012). Furthermore, referring to the research of Costanza et al. (2014), Xie et al. (2008), and Zhan et al. (2019), this paper compiled the ES supply and demand matrix tables for the BTH region. The values for each subunit ranged from 0 to 5; the higher the value, the higher the supply or demand level of the corresponding LUCC type per unit area. The ES budget matrix was calculated as ES supply minus ES demand, and its values reflect the surplus, deficit, or balance of supply and demand.
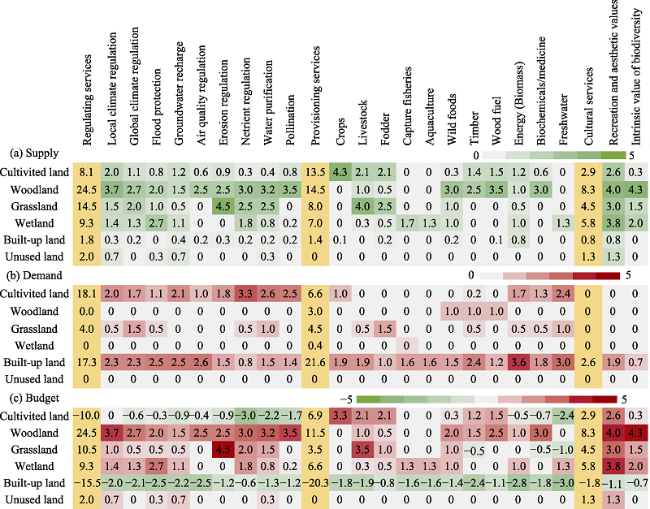
Figure 3 Matrix of ecosystem service demand (a), supply (b), and budget (c) for different land cover types
For region i, the level of ES supply of type j was calculated using the following formula:
$\text{ ES supply}{{\text{ }}^{ij}}=\sum\limits_{m=1}^{6}{K_{m}^{i}}{{V}_{mj}}$
where ES supplyij is the supply level of ES type j in region i; $K_{m}^{i}$ is the area ratio of specific land use/cover types in region i; and Vmj is the corresponding element value in the ES supply matrix table. This method is also applicable to the calculation of ES demand level. The research goal was to explore the overall state of ES in the BTH region. Therefore, for ES supply, demand, and supply-demand budget, this study only show the summative results for regulating services, provisioning services, and cultural services.

2.2.3 Coupling analysis

CCD can be used to describe the correlation between two or more systems (Shi et al., 2020). This paper used the following equations to calculate the CCD between urbanization level and ecosystem service budget (Gan et al., 2020; Liu et al., 2021).
$CCD={{(C\times T)}^{\frac{1}{2}}}$
$C={{\left[ \frac{UL\times ESB}{{{\left( \frac{UL+ESB}{2} \right)}^{2}}} \right]}^{\frac{1}{2}}}$
$T=\alpha \times UL+\beta \times ESB$
where CCD is the coupling coordination degree between urbanization level and ecosystem service budget, with a range from 0 to 1; C is the coupling degree; T is the comprehensive evaluation index, which presents the overall effect and level; and α and β are the proportional contributions to the system (α+β=1).

2.3 Data sources and materials

The basic data used included land use/cover, socio-economic, and nighttime light data. Land use/cover data for 2000, 2005, 2010, and 2015 were obtained from the Resource and Environmental Science Data Center of the Chinese Academy of Sciences (http://www.resdc.cn). This data set is generated by artificial visual interpretation, and the spatial resolution is 1 km. The socio-economic data were divided into two parts: population density and GDP density, both of which were obtained from the Environmental Science Data Center of the Chinese Academy of Sciences. The gridded population data were generated using a multi-factor weight distribution method to overlay the population data on a spatial grid, with administrative region as the basic statistical unit, which shows the spatial properties of the population. Similar to the population data, the gridded GDP data considered the influence of many factors, including residential density, nighttime light brightness, and land-use type. The widely used nighttime light intensity image data were obtained from the National Centers for Environmental Information (https://www.ngdc.noaa.gov/ngdc.html), including DMSP/OLS and NPP/VIIR data (Gerace and Montanaro, 2017). This paper used DMSP/OLS data for 2000, 2005, 2010, and 2013 and performed spatial correction (Ali et al., 2019).

3 Results and analysis

3.1 Urbanization process

The development of multi-dimensional urbanization in the BTH region from 2000 to 2015 is shown in Figure 4. There were no significant changes in the pattern of population urbanization in the region from 2000 to 2015, especially from 2000 to 2010. The areas of highest urbanization were mainly located in the center of the BTH region, and areas with low urbanization were distributed in the northwest. Population urbanization has a causal relationship with development of the regional economy and landscape change. The results support this theory and the spatial distribution of the regional economic and landscape indices was generally similar to that of the population index. In addition, the high value areas for economic and landscape development clearly reflect the agglomeration effects of urbanization. Beijing, Tianjin, Shijiazhuang, and other urbanized regions has higher urbanization levels from all the population, GDP and landscape perspectives. GDP increased evidently from 2000 to 2015, with Beijing and Tianjin dominated in this area. Urbanization process accelerated, especially in southwest China.
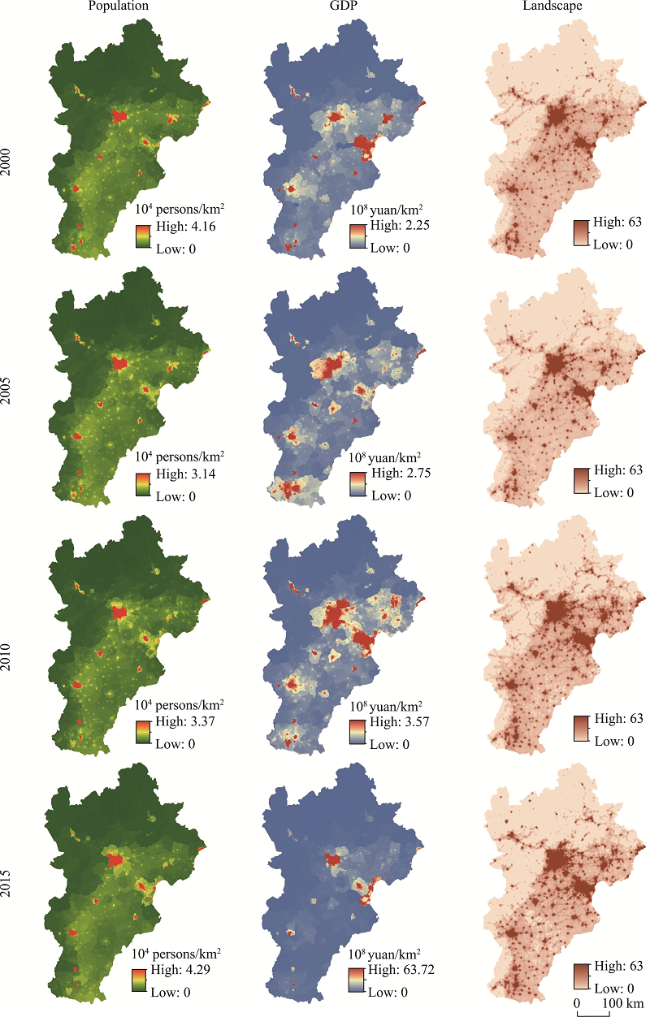
Figure 4 Temporal and spatial variation in urbanization indices in the Beijing-Tianjin-Hebei region from 2000 to 2015

3.2 Ecosystem services supply-demand budget

Based on the LUCC data and the ecosystem service matrix, this paper quantified and mapped the supply, demand, and budget of the three ES categories (regulating, provisioning, and cultural services). Figure 5 shows the quantitative maps for 2015, representing the distribution of ES supply, demand, and supply-demand budget. There was considerable spatial variation in ES in the BTH region. In terms of the total ES supply, high ES supply areas were concentrated in the northwest, including northwest Hebei. Low ES supply areas were located in the southeast, including Beijing, Tianjin, and southeast Hebei. The three categories of ES showed similar spatial patterns. Regulation services and provision services have relative high values on the whole. Wood land can provide more ES owning to the rich biodiversity and ecosystem structure. Rapidly urbanized areas had the lowest ES supply levels. ES demand had the opposite spatial distribution to that of ES supply. Densely populated areas have higher demand for ES. Areas in the southeast with dense populations and rapid economic development had greater ES demand. Areas in the northwest with the most grassland and woodland had lower ES demand. As for the ES budget, positive ES budget values were distributed throughout the BTH region, but with lower representation in built-up areas and cultivated land. ES budget is positive in the northwest of the BTH region, while negative in the southeast region. Moreover, the three categories of ES supply, demand, and budget showed similar spatial patterns.
Figure 5 Spatial variation in ES supply, demand, and budget in the Beijing-Tianjin-Hebei region in 2015

3.3 Coupling analysis of urbanization and ecosystem services supply-demand budget

This study used GDP density, population density, and landscape type as the three main indicators of urbanization. Figure 6 shown the relationships at the county scale. There were negative relationships between ES supply and urbanization, and between ES budget and urbanization. The strongest relationships, based on the coefficients, were between population density and ES supply, demand, and budget. Population density has the most evident relationships with and ES supply (β=-1.048) and ES budget (β=-1.095). There was a positive relationship between urbanization and ES demand, with the greatest coefficient of 1.143 of population density. Similar relationships existed at the prefecture-city scale (Figure 7). There were evident negative relationships between urbanization and ES supply and budget, while positive relationships between urbanization and ES demand, at prefecture-city scale. However, landscape index has the strongest relationships with ES supply, demand and budget, with the coefficients of -0.539, 0.528, and -0.546, respectively.
Figure 6 Relationships between urbanization indexes and ES supply, demand, and budget at the county scale
Figure 7 Relationships between urbanization indexes and ES supply, demand, and budget at the prefecture-city scale
The coupling analysis of urbanization and the ES supply-demand budget showed similar spatial patterns at both county and prefecture-city scales from 2000 to 2015. As shown in Figure 8, the spatial patterns were similar in 2000, 2005, 2010 and 2015, and the overall coupling degree improved from 2000 to 2015. Some high values were distributed in cities with high urbanization levels. In 2000, the mount of CCD more than 0.6 only 1 unit (Beijing) in ES supply, 7 units (Qinhuangdao, Tangshan, Baoding, Cangzhou, Shijiazhuang, Xingtai, and Handan) in ES demand, and 0 unit in ES budget. In contrast, in 2015, the mount of CCD more than 0.6 are 4 units (Beijing, Tianjin, Qinhuangdao, and Changping) in ES supply, 19 units (Qinhuangdao, Tangshan, Baoding, Cangzhou, Shijiazhuang, Xingtai, and so on) in ES demand, and 0 unit in ES budget. From the perspective of spatial pattern, the CCD values present banded distribution. The counties with a lower coupling degree were mainly distributed in the northwest areas, while those with a higher coupling degree were in the southeast. The spatial patterns at the prefecture-city scale were similar to those at the county scale (Figure 9). The coupling degree of the prefecture-cities in the BTH region improved from 2000 to 2015. The high urbanized areas, such as Beijing, Tianjin, and southern cities in Hebei, have relatively high CDD values.
Figure 8 Spatial variation in coupling levels of urbanization and ecosystem services supply-demand budget at the county scale in the Beijing-Tianjin-Hebei region
Figure 9 Spatial variation in coupling levels of urbanization and ecosystem services supply-demand budget from 2000 to 2015 at the prefecture-city scale in the Beijing-Tianjin-Hebei region

4 Discussion

Over the past few decades, urbanization has been advancing rapidly in China. Cities have been losing ecological space, and sustainable urbanization has been difficult to maintain. Facing rapid urbanization process, this study explored the relationship between ES budget
and urbanization level. Furthermore, we conducted multi-scale coupling analysis to quantify the correlations. According to the results, we found that urbanization is evident from the perspectives of population, economic and landscape. The development trends are consistent with those of others (Wang et al., 2021; Peng et al., 2017). The spatial pattern of ES demand and supply is based on the LUCC in the BTH region. It’s reason that the urbanized area with high ES demand, and ecological area with high ES supply. As for the correlations, negative, positive, and negative relationships exist between urbanization levels and ES supply, demand, and budget, respectively. These is mainly because that ES demand is mainly caused by the increasing living standard and urbanization level, and the ES supply is mainly dominated by the ecological land. These results are credible to provide scientific evidences for policy makers.
As shown in this study, there is a negative correlation between urbanization and ES supply-demand budget, which reflects the irrationality of land-use change as a result of human intervention. The process of urbanization crowds out natural spaces, leading to a decline in typical ecosystem services such as productivity and water conservation, and limits the sustainable development of the BTH region. To overcome this obstacle, ecological protection and environmental optimization must be given equal weight to urban development. Expanding the area of ecological land contributes to improving the ES value in the BTH region. Green roof, ecological garden and grain to green are effective projects to expand the ecological area. Meanwhile, with the process of urbanization, controlling its negative effects should be paid more attention. The spatial planning should take ES supply and demand into account for sustainable development. In terms of and ecological restoration in the BTH region, regional government agencies should take agricultural needs and ecological protection into account during the process of urbanization and construction, in order to optimize ecological security. During the construction of cities, it is important to establish ecological compensation mechanisms and optimize the spatial design of urban-ecological networks to incorporate inter-regional land multifunctionality. In addition, policies related to land use should be designed according to local conditions but consideration must also be given to coordinated development of areas of rapid urbanization.

5 Conclusions

Urbanization is an important driver of changes in ecosystem types and services. In this study, an ES matrix was used to analyze ES supply, demand, and budget in the BTH region from 2000 to 2015. GDP, population density, and nighttime light brightness were used as indicators of different dimensions of urbanization. Multi-scale coupling analysis was used to quantify the correlations between urbanization and ES supply, demand, and budget and identify regional differences. The results provide a reference for ecosystem management and environmental protection in the BTH region.
The main research conclusions are as follows. (1) The effects of population agglomeration and factor agglomeration are important drivers shaping patterns of urbanization in the BTH region. Between 2000 and 2015, spatial patterns of urbanization in the BTH region remained stable, and the areas with the highest levels of urbanization were mainly located in the central part of the region. (2) From 2000 to 2015, ES supply in the BTH region was high in the northwest and low in the southeast, while ES demand showed the opposite pattern. Areas with positive ES supply-demand budget values were found throughout the BTH region, but the ES budget of built-up areas requires attention. (3) There were negative, positive, and negative correlations between urbanization levels and ES supply, demand, and budget, respectively, in the BTH region. The urban-ecological coupling degree in the BTH region increased during the study period. Spatially, areas with a high coupling degree were concentrated in the southeast of the region.

Conflicts of interest

The authors declare no conflicts of interest.

Appendix

Table S1 165 counties in the Beijing-Tianjin-Hebei region
No. County Province No. County Province No. County Province
1 Weichang Hebei 43 Tangshan Hebei 85 Pingshan Hebei
2 Kangbao Hebei 44 Tongzhou Beijing 86 Lingshou Hebei
3 Fengning Hebei 45 Dachang Hebei 87 Hejian Hebei
4 Guyuan Hebei 46 Changli Hebei 88 Lixian Hebei
5 Longhua Hebei 47 Laishui Hebei 89 Xingtang Hebei
6 Chengde Hebei 48 Baodi Tianjin 90 Dingzhou Hebei
7 Pingquan Hebei 49 Xianghe Hebei 91 Cangxian Hebei
8 Zhangbei Hebei 50 Daxing Beijing 92 Boye Hebei
9 Shangyi Hebei 51 Luannan Hebei 93 Suning Hebei
10 Chicheng Hebei 52 Fengnan Hebei 94 Anguo Hebei
11 Luanping Hebei 53 Wuqing Tianjin 95 Xinle Hebei
12 Chongli Hebei 54 Ninghe Tianjin 96 Cangzhou Hebei
13 Chengde Hebei 55 Langfang Hebei 97 Xianxian Hebei
14 Huairou Beijing 56 Laiyuan Hebei 98 Haixing Hebei
15 Wanquan Hebei 57 Zhuozhou Hebei 99 Anping Hebei
16 Kuancheng Hebei 58 Tanghai Hebei 100 Raoyang Hebei
17 Zhangjiakou Hebei 59 Yixian Hebei 101 Zhengding Hebei
18 Miyun Beijing 60 Gu’an Hebei 102 Mengcun Hebei
19 Xinglong Hebei 61 Shuiqing Hebei 103 Shuozhou Hebei
20 Xuanhua Hebei 62 Tianjin Tianjin 104 Luquan Hebei
21 Yanqing Beijing 63 Xincheng Hebei 105 Botou Hebei
22 Qinglong Hebei 64 Dingxing Hebei 106 Gaocheng Hebei
23 Huai’an Hebei 65 Baxian Hebei 107 Wuji Hebei
24 Huailai Hebei 66 Xiong’an Hebei 108 Nanpi Hebei
25 Qianxi Hebei 67 Xushui Hebei 109 Yanshan Hebei
26 Funing Hebei 68 Jinghai Tianjin 110 Jingjing Hebei
27 Zhuolu Hebei 69 Rongcheng Hebei 111 Shenzhou Hebei
28 Zunhua Hebei 70 Mancheng Hebei 112 Wuqiang Hebei
29 Pinggu Beijing 71 Shunping Hebei 113 Wuyi Hebei
30 Changping Beijing 72 Tangxian Hebei 114 Jinzhou Hebei
31 Qian’an Hebei 73 Wen’an Hebei 115 Xinji Hebei
32 Shunyi Beijing 74 Fuping Hebei 116 Shijiazhuan Hebei
33 Qinhuangdao Hebei 75 Anxin Hebei 117 Dongguang Hebei
34 Yangyuan Hebei 76 Renqiu Hebei 118 Fucheng Hebei
35 Jixian Tianjin 77 Baoding Hebei 119 Luancheng Hebei
36 Lulong Hebei 78 Qingyuan Hebei 120 Jingxian Hebei
37 Fengrun Hebei 79 Quyang Hebei 121 Yuanshi Hebei
38 Beijing Beijing 80 Dacheng Hebei 122 Zhaoxian Hebei
39 Sanhe Hebei 81 Qingxian Hebei 123 Hengshui Hebei
40 Yuxian Hebei 82 Wangdu Hebei 124 Wuqiao Hebei
41 Luanxian Hebei 83 Gaoyang Hebei 125 Ningjin Hebei
42 Yutian Hebei 84 Huanghua Hebei 126 Jixian Hebei
No. County Province No. County Province No. County Province
127 Zanhuang Hebei 140 Guangzong Hebei 153 Shexian Hebei
128 Zaoqiang Hebei 141 Renxian Hebei 154 Guantao Hebei
129 Gaoyi Hebei 142 Qinghe Hebei 155 Handan (county) Hebei
130 Boxiang Hebei 143 Pingxiang Hebei 156 Feixiang Hebei
131 Xinhe Hebei 144 Xingtai Hebei 157 Guangping Hebei
132 Gucheng Hebei 145 Nanhe Hebei 158 Handan (urban) Hebei
133 Lincheng Hebei 146 Shahe Hebei 159 Handan (suburb) Hebei
134 Longyao Hebei 147 Wu’an Hebei 160 Cixian Hebei
135 Nangong Hebei 148 Linxi Hebei 161 Chengan Hebei
136 Neiqiu Hebei 149 Jize Hebei 162 Daming Hebei
137 Julu Hebei 150 Quzhou Hebei 163 Weixian (Handan) Hebei
138 Xiangtai Hebei 151 Qiuxian Hebei 164 Linzhang Hebei
139 Weixian (Xingtai) Hebei 152 Yongnian Hebei 165 Laoting Hebei

Note: 165 counties ordered from north to south.

Table S2 13 prefecture-level cities in the Beijing-Tianjin-Hebei region
No. City Province No. City Province
1 Handan Hebei 8 Tianjin Tianjin
2 Xingtai Hebei 9 Beijing Beijing
3 Shijiazhuang Hebei 10 Zhangjiakou Hebei
4 Baoding Hebei 11 Tangshan Hebei
5 Hengshui Hebei 12 Qinhuangdao Hebei
6 Cangzhou Hebei 13 Chengde Hebei
7 Langfang Hebei

Note: 13 cities ordered from north to south.

[1]
Aguilera M A, Tapia J, Gallardo C et al., 2020. Loss of coastal ecosystem spatial connectivity and services by urbanization: Natural-to-urban integration for bay management. Journal of Environmental Management, 276: 111297.

DOI

[2]
Ala-Hulkko T, Kotavaara O, Alahuhta J et al., 2019. Mapping supply and demand of a provisioning ecosystem service across Europe. Ecological Indicators, 103: 520-529.

DOI

[3]
Ali M A, Islam M M, Islam M N et al., 2019. Investigations of MODIS AOD and cloud properties with CERES sensor based net cloud radiative effect and a NOAA HYSPLIT Model over Bangladesh for the period 2001-2016. Atmospheric Research, 215: 268-283.

DOI

[4]
Bian H Y, Gao J, Wu J G et al., 2021. Hierarchical analysis of landscape urbanization and its impacts on regional sustainability: A case study of the Yangtze River Economic Belt of China. Journal of Cleaner Production, 279, 123267.

DOI

[5]
Bukvareva K, Zamolodchikov D, Kraev G et al., 2017. Supplied, demanded and consumed ecosystem services: Prospects for national assessment in Russia. Ecological Indicators, 78: 351-360.

DOI

[6]
Burkhard B, Kroll F, Nedkov S et al., 2012. Mapping ecosystem service supply, demand and budgets. Ecological Indicators, 21: 17-29.

DOI

[7]
Chen M, Ye C, Lu D et al., 2019. Cognition and construction of the theoretical connotations of new urbanization with Chinese characteristics. Journal of Geographical Sciences, 29(10): 1681-1698.

DOI

[8]
Chu X, Deng X Z, Jin G et al., 2017. Ecological security assessment based on ecological footprint approach in Beijing-Tianjin-Hebei region, China. Physics and Chemistry of the Earth, Parts A/B/C, 101: 43-51.

DOI

[9]
Costanza R, Arge A D, de Groot R et al., 1997. The value of the world’s ecosystem services and natural capital. Nature, 387(6630): 253-260.

DOI

[10]
Costanza R, de Groot R, Sutton P et al., 2014. Changes in the global value of ecosystem services. Global Environmental Change, 26: 152-158.

DOI

[11]
Cui X G, Fang C L, Liu H M et al., 2019. Assessing sustainability of urbanization by a coordinated development index for an urbanization-resources-environment complex system: A case study of Jing-Jin-Ji region, China. Ecological Indicators, 96: 383-391.

DOI

[12]
Dadashpoor H, Azizi P, Moghadasi M, 2019. Land use change, urbanization, and change in landscape pattern in a metropolitan area. Science of The Total Environment, 655: 707-719.

DOI

[13]
Dakhlia S, Diallo B, Temimi A, 2021. Financial inclusion and ethnic development: Evidence from satellite light density at night. Journal of Behavioral and Experimental Finance, 29: 100455.

DOI

[14]
Deng C X, Liu J Y, Nie X D et al., 2021. How trade-offs between ecological construction and urbanization expansion affect ecosystem services. Ecological Indicators, 122: 107253.

DOI

[15]
Gan L, Shi H, Hu Y et al., 2020. Coupling coordination degree for urbanization city-industry integration level: Sichuan case. Sustainable Cities and Society, 58: 102136.

DOI

[16]
García-Nieto A P, Geijzendorffer I R, Baró F et al., 2018. Impacts of urbanization around Mediterranean cities: Changes in ecosystem service supply. Ecological Indicators, 91: 589-606.

DOI

[17]
Gerace A, Montanaro M, 2017. Derivation and validation of the stray light correction algorithm for the thermal infrared sensor onboard Landsat 8. Remote Sensing of Environment, 191: 246-257.

DOI

[18]
Guan Q C, Hao J M, Ren G P et al., 2020. Ecological indexes for the analysis of the spatial-temporal characteristics of ecosystem service supply and demand: A case study of the major grain-producing regions in Quzhou, China. Ecological Indicators, 108: 105748.

DOI

[19]
Inostroza L, Hamstead Z, Spyra M et al., 2019. Beyond urban-rural dichotomies: Measuring urbanisation degrees in central European landscapes using the technomass as an explicit indicator. Ecological Indicators, 96: 466-476.

DOI

[20]
Inostroza L, Zepp H, 2021. The metabolic urban network: Urbanisation as hierarchically ordered space of flows. Cities, 109: 103029.

DOI

[21]
Liu W, Zhan J, Zhao F et al., 2021. Exploring the coupling relationship between urbanization and energy eco-efficiency: A case study of 281 prefecture-level cities in China. Sustainable Cities and Society, 64: 102563.

DOI

[22]
Liu X L, Wang Y, Li Y et al., 2017. Changes in arable land in response to township urbanization in a Chinese low hilly region: Scale effects and spatial interactions. Applied Geography, 88: 24-37.

DOI

[23]
Liu X R, Sun T, Feng Q, 2020. Dynamic spatial spillover effect of urbanization on environmental pollution in China considering the inertia characteristics of environmental pollution. Sustainable Cities and Society, 52: 101903.

[24]
Millennium Ecosystem Assessment (MEA), 2005. Ecosystems and Human Well-being:Synthesis. Washington, DC: Island Press.

[25]
Pang X, Nordström E M, Böttcher H et al., 2017. Trade-offs and synergies among ecosystem services under different forest management scenarios: The LEcA tool. Ecosystem Services, 28: 67-79.

DOI

[26]
Peng J, Tian L, Liu Y X et al., 2017. Ecosystem services response to urbanization in metropolitan areas: Thresholds identification. Science of The Total Environment, 607/608: 706-714.

DOI

[27]
Peng J, Wang X Y, Liu Y X et al., 2020. Urbanization impact on the supply-demand budget of ecosystem services: Decoupling analysis. Ecosystem Services, 44: 101139.

DOI

[28]
Peng L, Zhang L, Li X, et al,. 2022. Spatial expansion effects on urban ecosystem services supply-demand mismatching in Guanzhong Plain Urban Agglomeration of China. Journal of Geographical Sciences, 32(5): 806-828.

DOI

[29]
Schrandt M N, MacDonald T C, Sherwood E T et al., 2021. A multimetric nekton index for monitoring, managing and communicating ecosystem health status in an urbanized Gulf of Mexico estuary. Ecological Indicators, 123: 107310.

DOI

[30]
Shi T, Yang S, Zhang W et al., 2020. Coupling coordination degree measurement and spatiotemporal heterogeneity between economic development and ecological environment: Empirical evidence from tropical and subtropical regions of China. Journal of Cleaner Production, 244, 118739.

DOI

[31]
Sun X, Tang H J, Yang P et al., 2020. Spatiotemporal patterns and drivers of ecosystem service supply and demand across the conterminous United States: A multiscale analysis. Science of The Total Environment, 703: 135005.

DOI

[32]
Tao Y, Wang H N, Ou W X et al., 2018. A land-cover-based approach to assessing ecosystem services supply and demand dynamics in the rapidly urbanizing Yangtze River Delta region. Land Use Policy, 72: 250-258.

DOI

[33]
Uthes S, Matzdorf B, 2016. Budgeting for government-financed PES: Does ecosystem service demand equal ecosystem service supply? Ecosystem Services, 17: 255-264.

DOI

[34]
Wang C, Zhan J Y, Xin Z L, et al., 2020. Comparative analysis of urban ecological management models incorporating low-carbon transformation. Technological Forecasting and Social Change, 159: 120190.

DOI

[35]
Wang C, Zhan J Y, Zhang F et al., 2021. Analysis of urban carbon balance based on land use dynamics in the Beijing-Tianjin-Hebei region, China. Journal of Cleaner Production, 281: 125138.

DOI

[36]
Wang Y H, Liu Z F, He C Y et al., 2020. Quantifying urbanization levels on the Tibetan Plateau with high-resolution nighttime light data. Geography and Sustainability, 1(3): 233-244.

DOI

[37]
Wang Z F, Xu M, Lin H W et al., 2021. Understanding the dynamics and factors affecting cultural ecosystem services during urbanization through spatial pattern analysis and a mixed-methods approach. Journal of Cleaner Production, 279: 123422.

DOI

[38]
Wiederkehr F, Wilkinson C L, Zeng Y W et al., 2020. Urbanisation affects ecosystem functioning more than structure in tropical streams. Biological Conservation, 249: 108634.

DOI

[39]
Wu Y, Tao Y, Yang G S et al., 2019. Impact of land use change on multiple ecosystem services in the rapidly urbanizing Kunshan city of China: Past trajectories and future projections. Land Use Policy, 85: 419-427.

DOI

[40]
Xie G, Zhen L, Lu C et al., 2008. Expert knowledge based valuation method of ecosystem services in China. Journal of Natural Resources, 23(5): 911-919. (in Chinese)

[41]
Yuan Y J, Wu S H, Yu Y N et al., 2018. Spatiotemporal interaction between ecosystem services and urbanization: Case study of Nanjing City, China. Ecological Indicators, 95: 917-929.

DOI

[42]
Zhan J Y, Chu X, Li Z et al., 2019. Incorporating ecosystem services into agricultural management based on land use/cover change in Northeastern China. Technological Forecasting and Social Change, 144: 401-411.

DOI

[43]
Zhao Z, Bai Y P, Wang G F et al., 2018. Land eco-efficiency for new-type urbanization in the Beijing-Tianjin-Hebei region. Technological Forecasting and Social Change, 137: 19-26.

DOI

[44]
Zhou K, Yin Y, Li H, et al., 2021. Driving factors and spatiotemporal effects of environmental stress in urban agglomeration: Evidence from the Beijing-Tianjin-Hebei region of China. Journal of Geographical Sciences, 31(1): 91-110.

DOI

[45]
Zhou S, Yang L, Gao R et al., 2017. A comparison study of carbonaceous aerosols in a typical North China Plain urban atmosphere: Seasonal variability, sources and implications to haze formation. Atmospheric Environment, 149: 95-103.

DOI

[46]
Zhou X F, Chen H, 2018. Impact of urbanization-related land use land cover changes and urban morphology changes on the urban heat island phenomenon. Science of The Total Environment, 635: 1467-1476.

DOI

Outlines

/